Every organization checks out the reports to analyze the progress of the services or products. We can analyze the appointments and meetings in a company using the Reporting feature. An Odoo ERP system provides Reporting features in most modules and recorded actions. The Odoo 15 Calendar module makes it easy to generate essential reports for all appointments. This module enables you to create Meetings, Online Appointments, set reminders and invitations. Anyone can maintain and record the event details with the advanced features of the Odoo 15 Calendar module.
This blog helps you to understand the Reporting Feature of the Odoo 15 Calendar module.
The Reporting features of the Odoo 15 Calendar module consist of Online Appointments and All Appointments. We can analyze the data of appointments in a graphical representation and other formats. Let's check the detailed view of the Reporting feature in the Odoo 15 Calendar module.
Reporting
We can access the data of all scheduled appointments in the calendar using the Reporting feature. You can access the Online Appointments and All Appointments from the Reporting tab of the Odoo 15 Calendar module. A dynamic report generated about all appointments is easily analyzed with the Calendar dashboard's Reporting feature.
Online Appointments
Select the Online Appointments menu from the Reporting tab, and you can access the data of appointments. Here, the reports are created based on the number of scheduled appointments. The graphical representation shows the Start date on X-axis and Count on Y-axis in the Graph view, as displayed in the screenshot below.
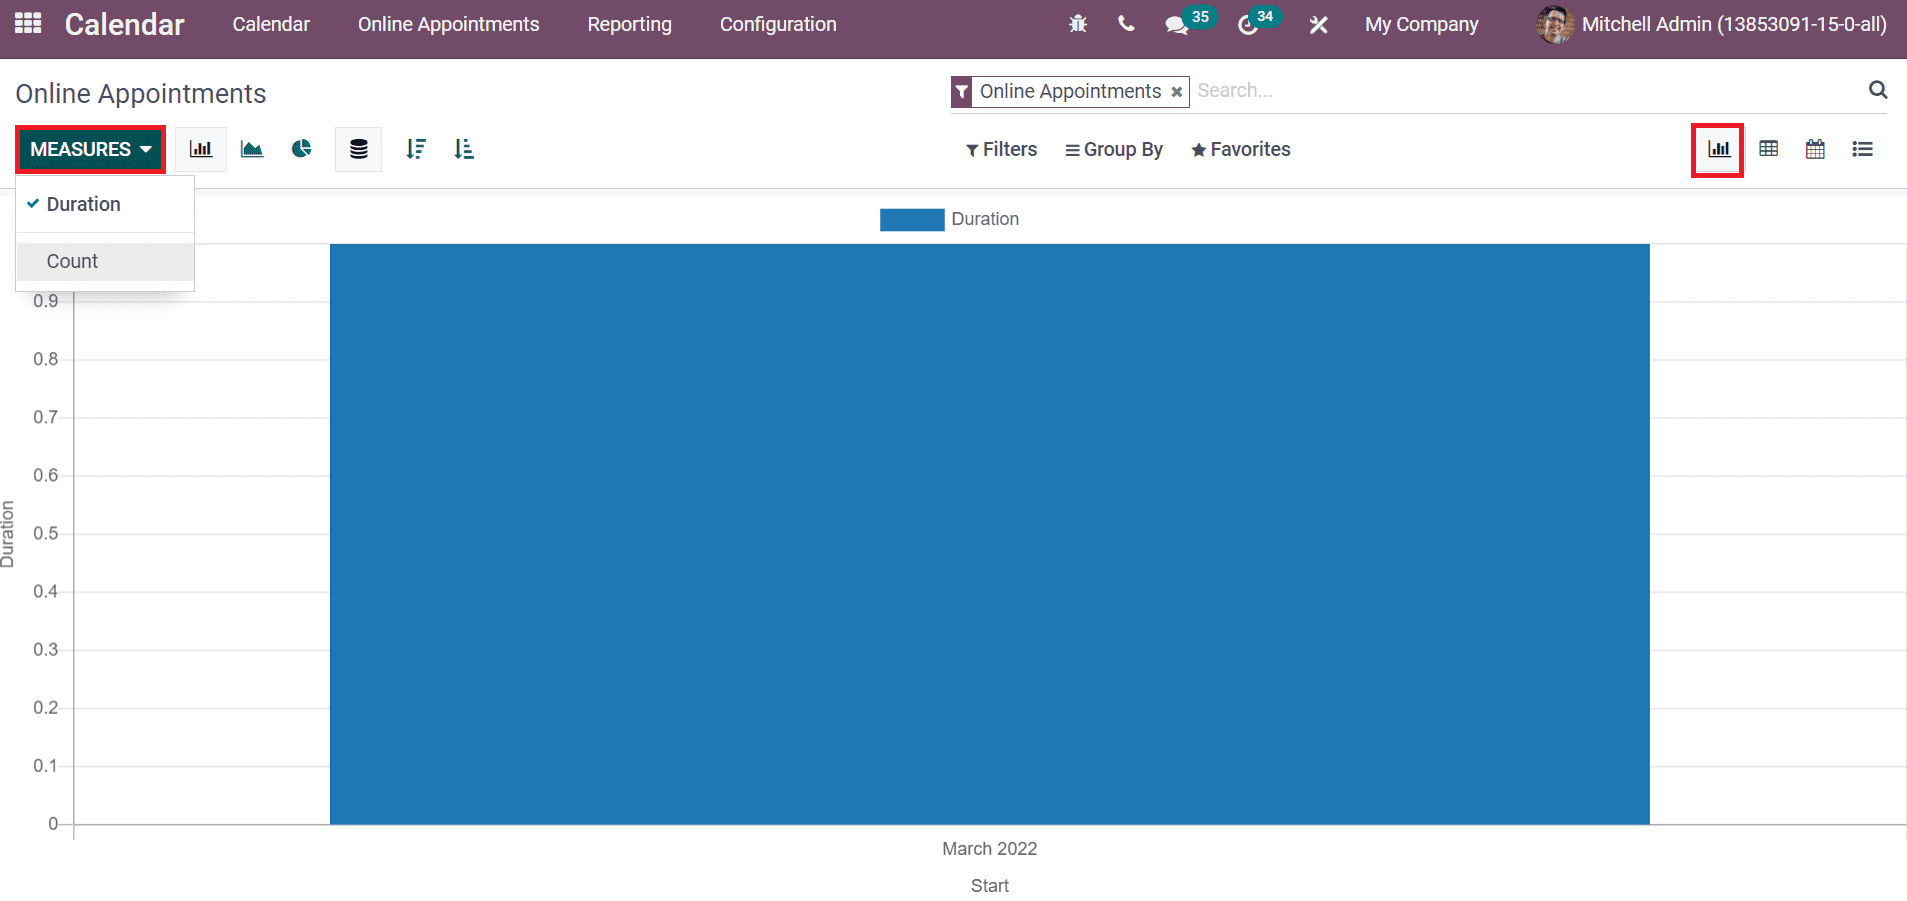
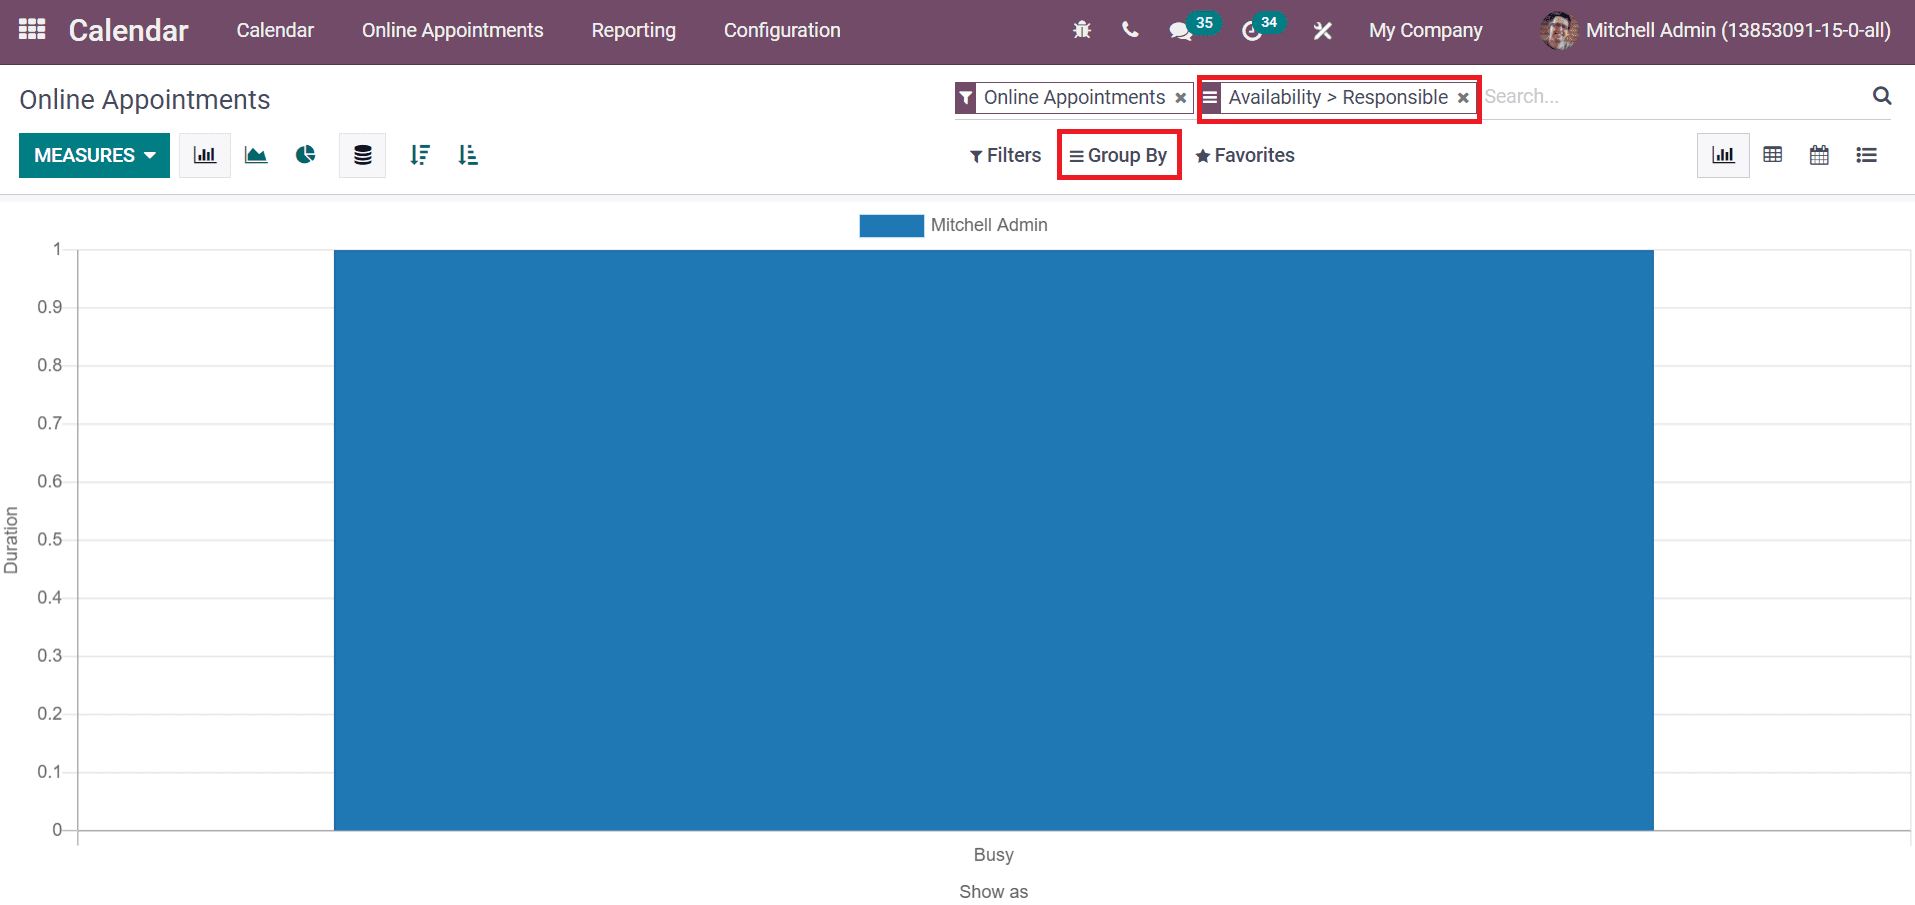
Using the Measure button, you can apply several measures to Graph, including Count and Duration. The Online Appointments data is viewable in Pie, Line and Bar chart forms. Users can Group By the appointments based on the availability and response time of the organizer shown in the screenshot below.
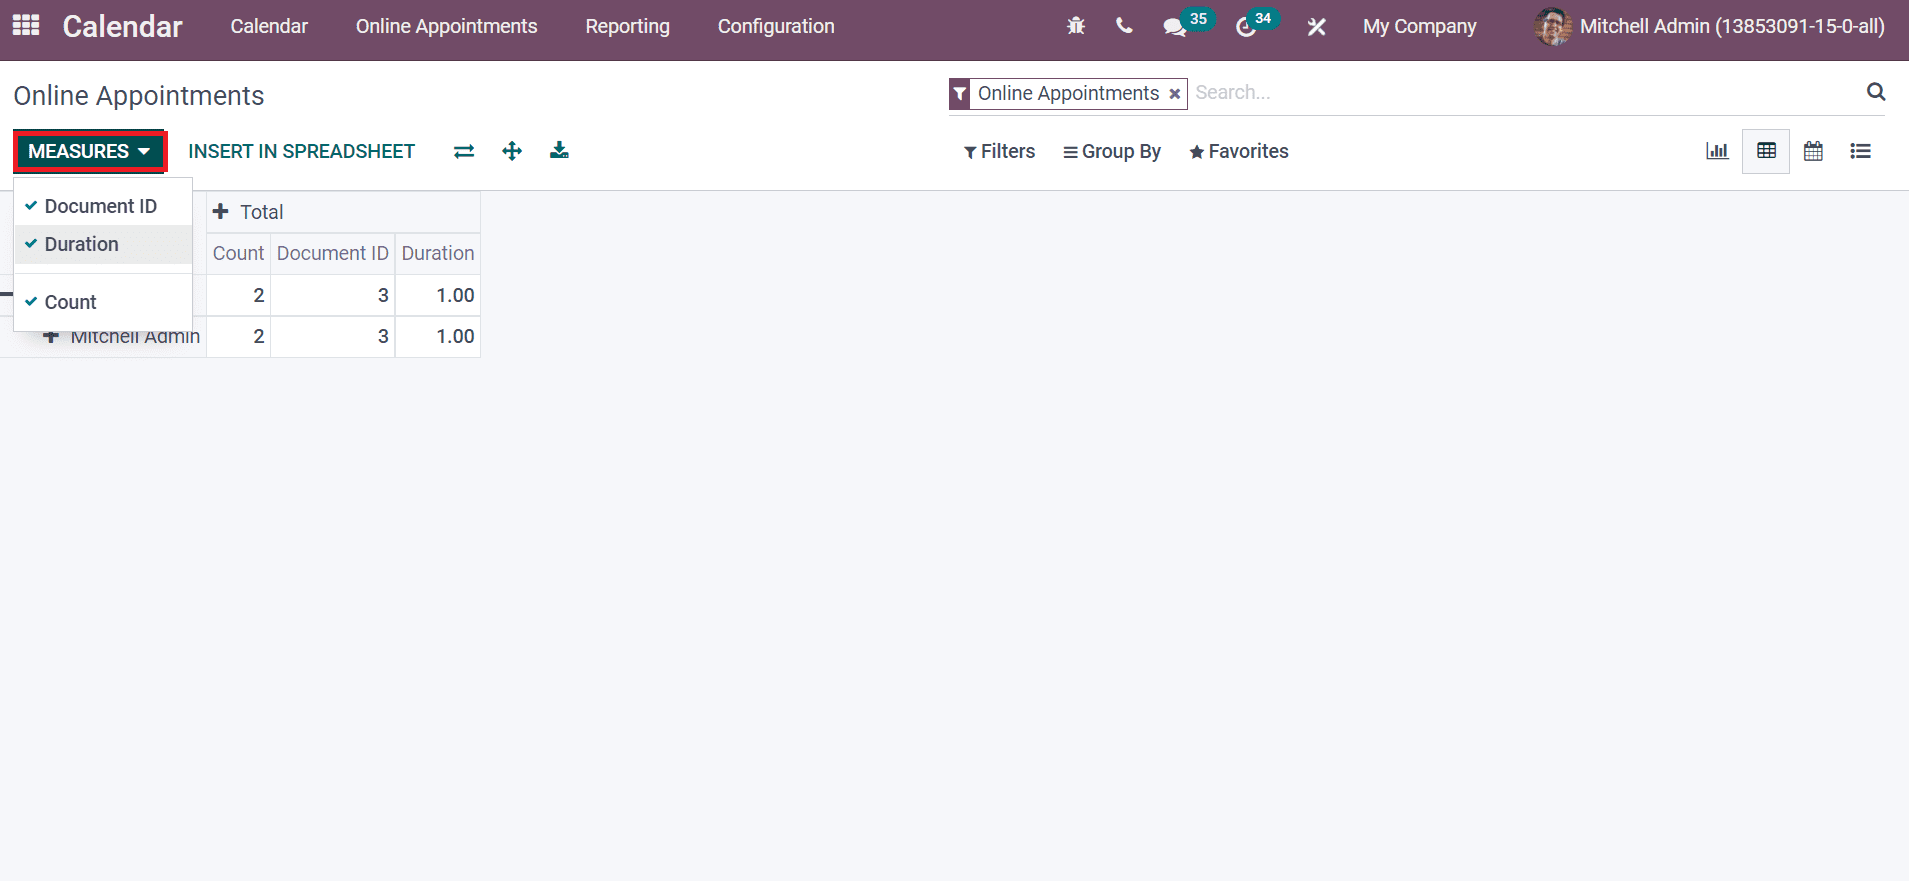
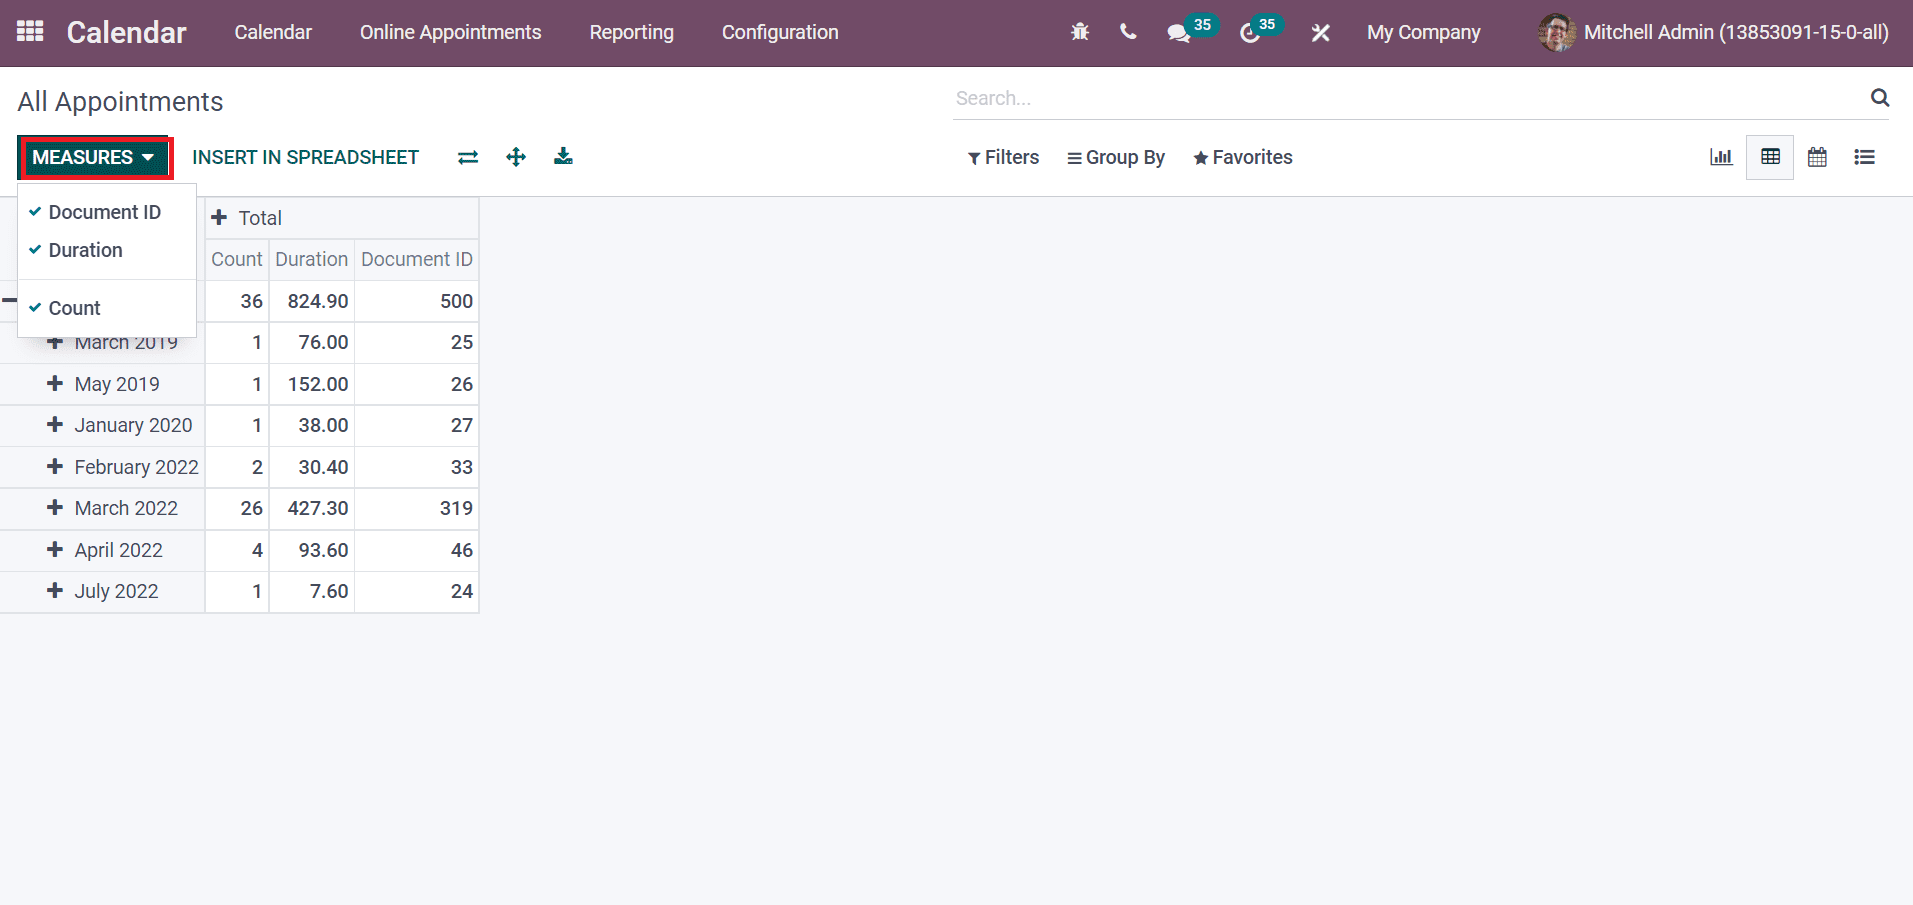
The Pivot view shows the total count of online appointments in a Pivot table. Using the Measures icon, you can add measures such as Document ID, Count and Duration into the pivot table. We can add a new spreadsheet into pivot by clicking on the INSERT IN SPREADSHEET button, as depicted in the screenshot below.
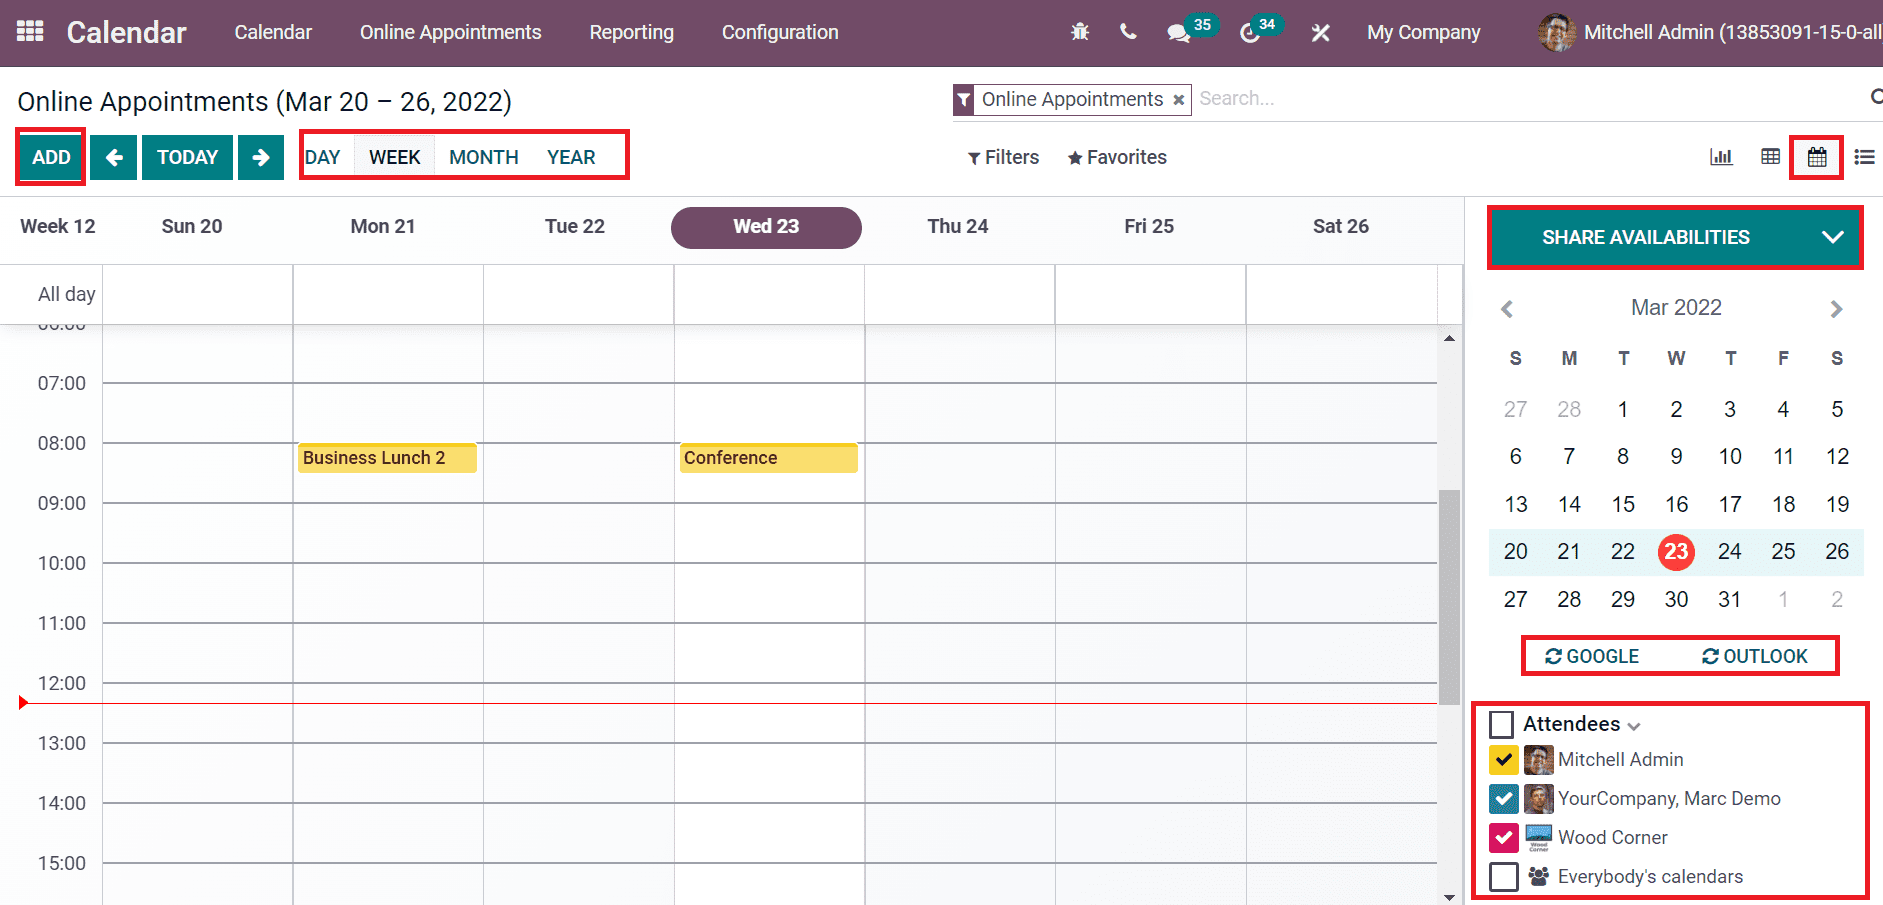
The Calendar view shows all scheduled appointments on a specific date. You can sort out the appointments based on Year, Day, Month and Week. Inside the Share Availability option, we can view created appointments in the Calendar dashboard. Details of attendees participating in events are shown on the right side of the Online Appointments window. Users can develop a new meeting by choosing a particular date from the calendar. Moreover, it is possible to enable Google and Outlook synchronization from the calendar. The Add icon also ensures to generate a new meeting/event for your business deals.
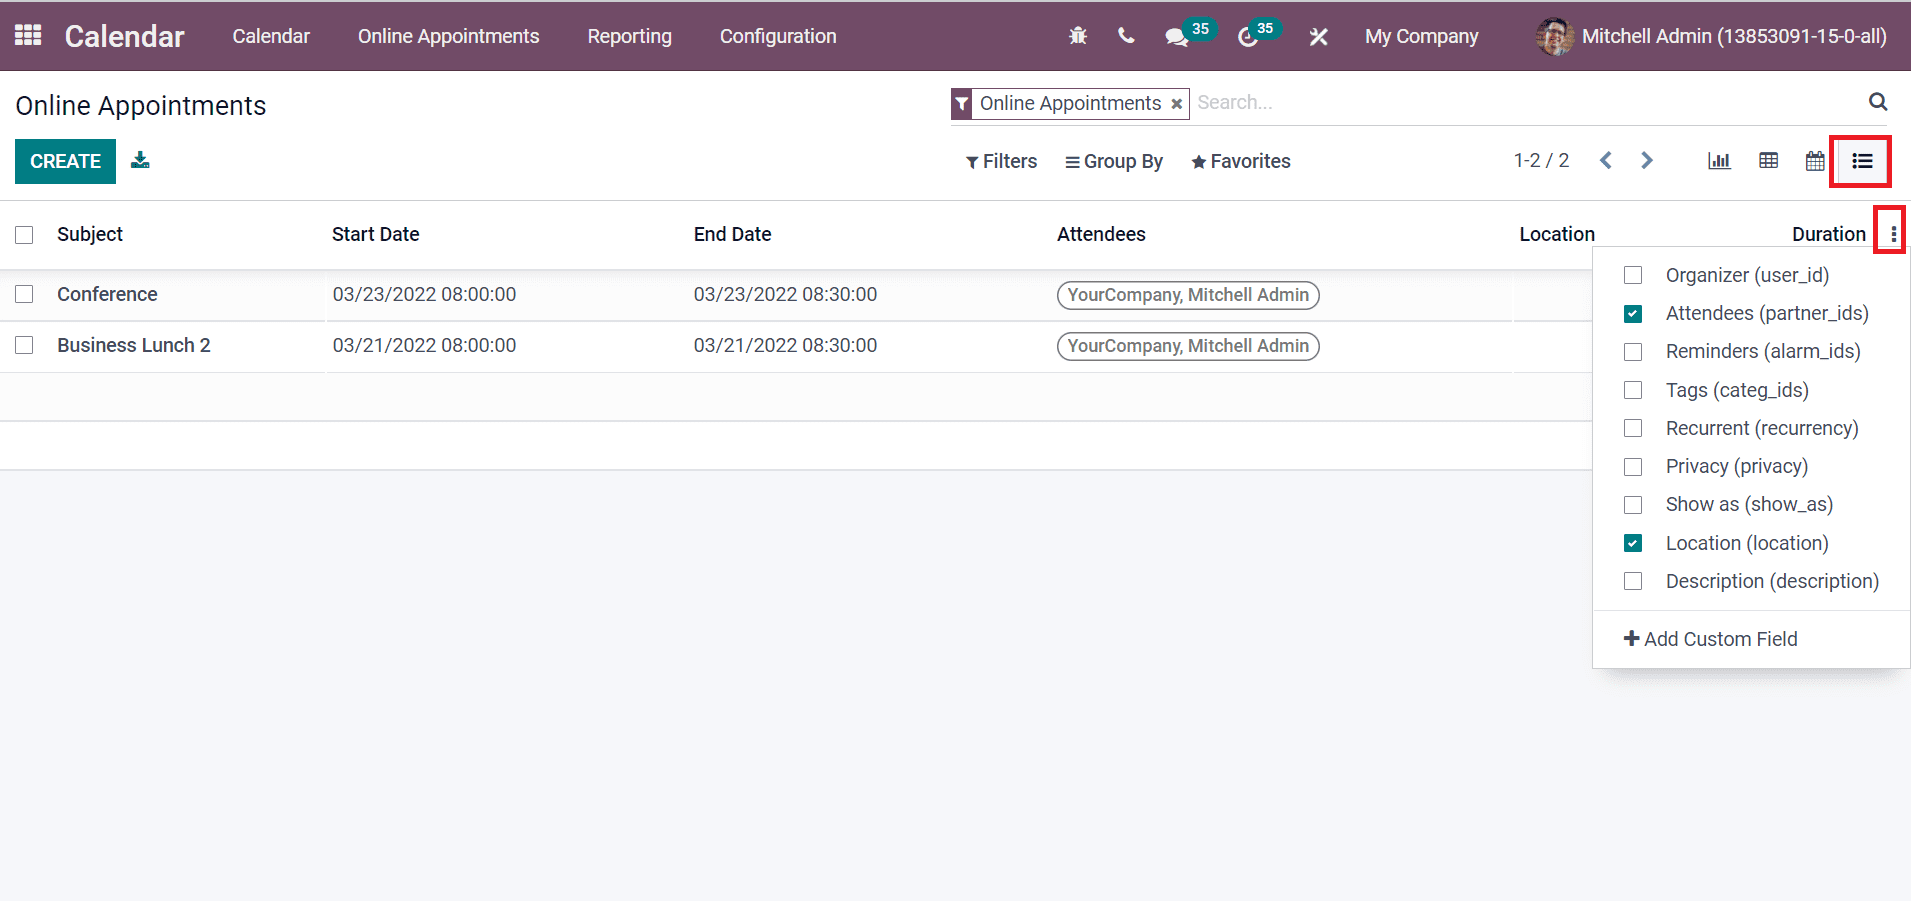
In the List view of the Online Appointments window, you can see the details such as Duration, Subject, End Date, Location, Start Date and more aspects. As portrayed in the screenshot below, we can add more custom fields into the List window by selecting on the three-dot button near the Duration title.
All Appointments
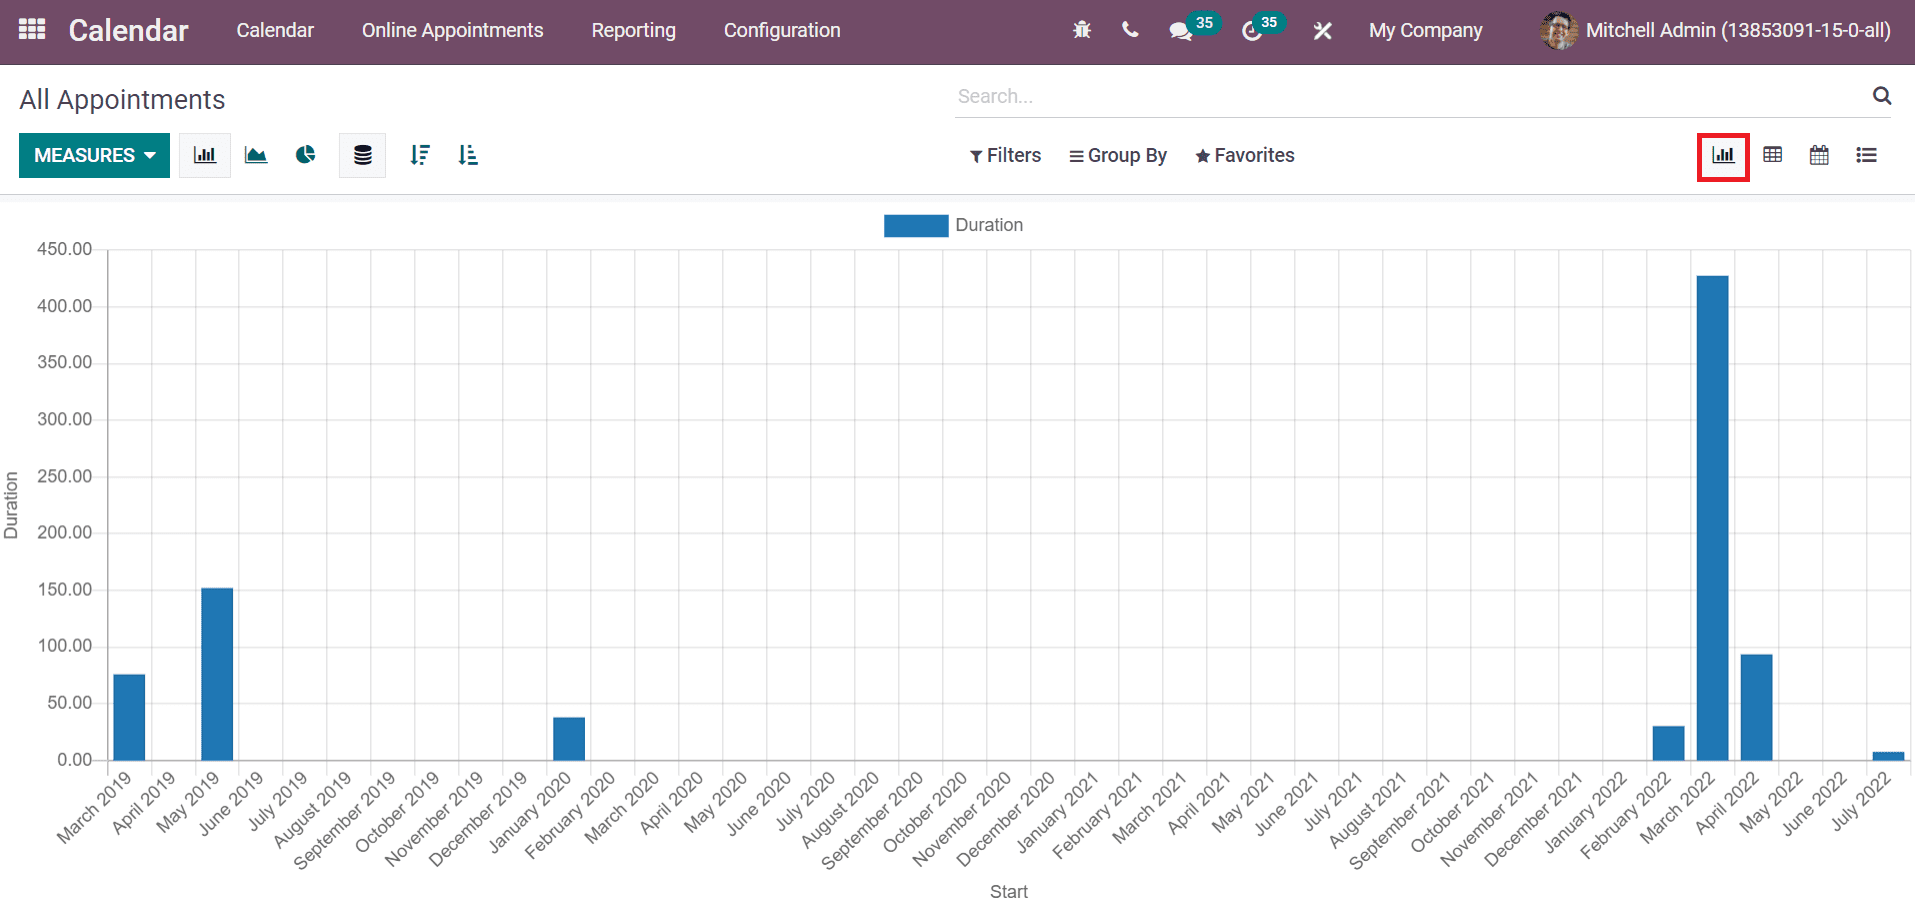
The reports related to each appointment are viewable under the All Appointments window. Select the All Appointments menu from the Reporting tab, and the data displays in a graphical format. All Appointments window is visible in different forms such as Pivot, List, Calendar and Graph. The graphical representation denotes all appointments Date on X-axis and Y-axis consist of Duration as displayed in the screenshot below.
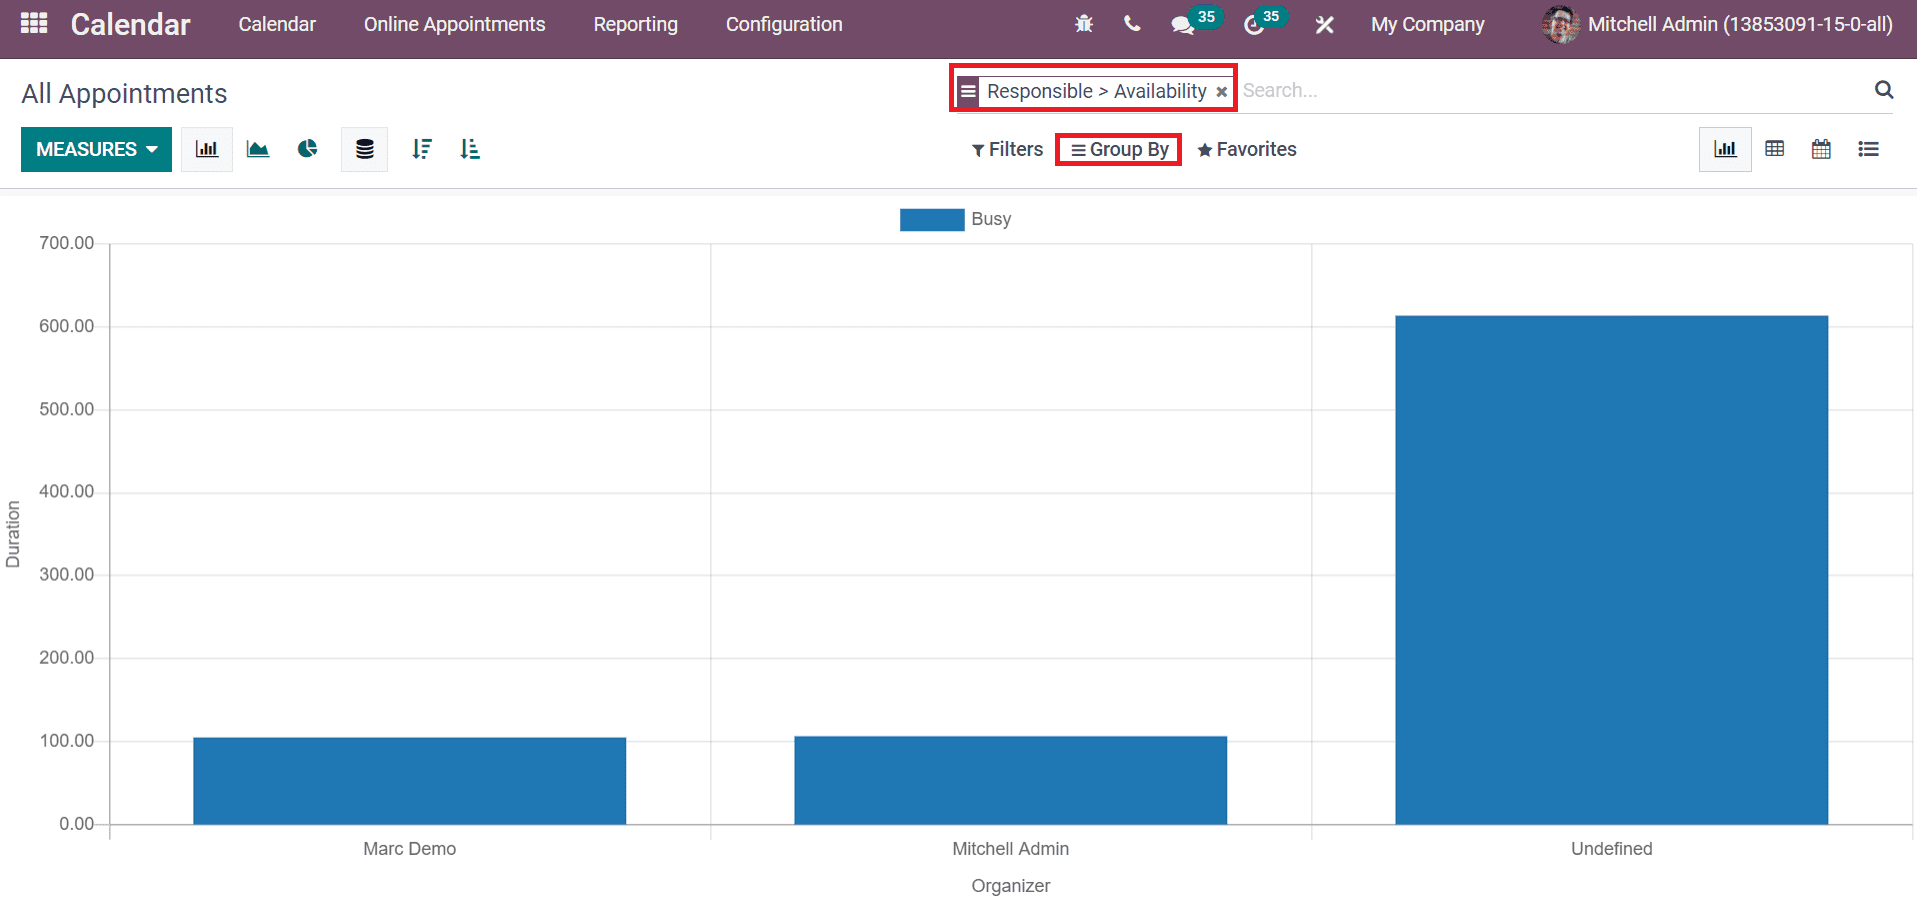
We can see the availability of organizers of an event in the Graph after applying the Group By options such as Responsible and Availability. Here, the Organizer details are shown in the X-axis, and Y-axis depict the Duration in the screenshot below.
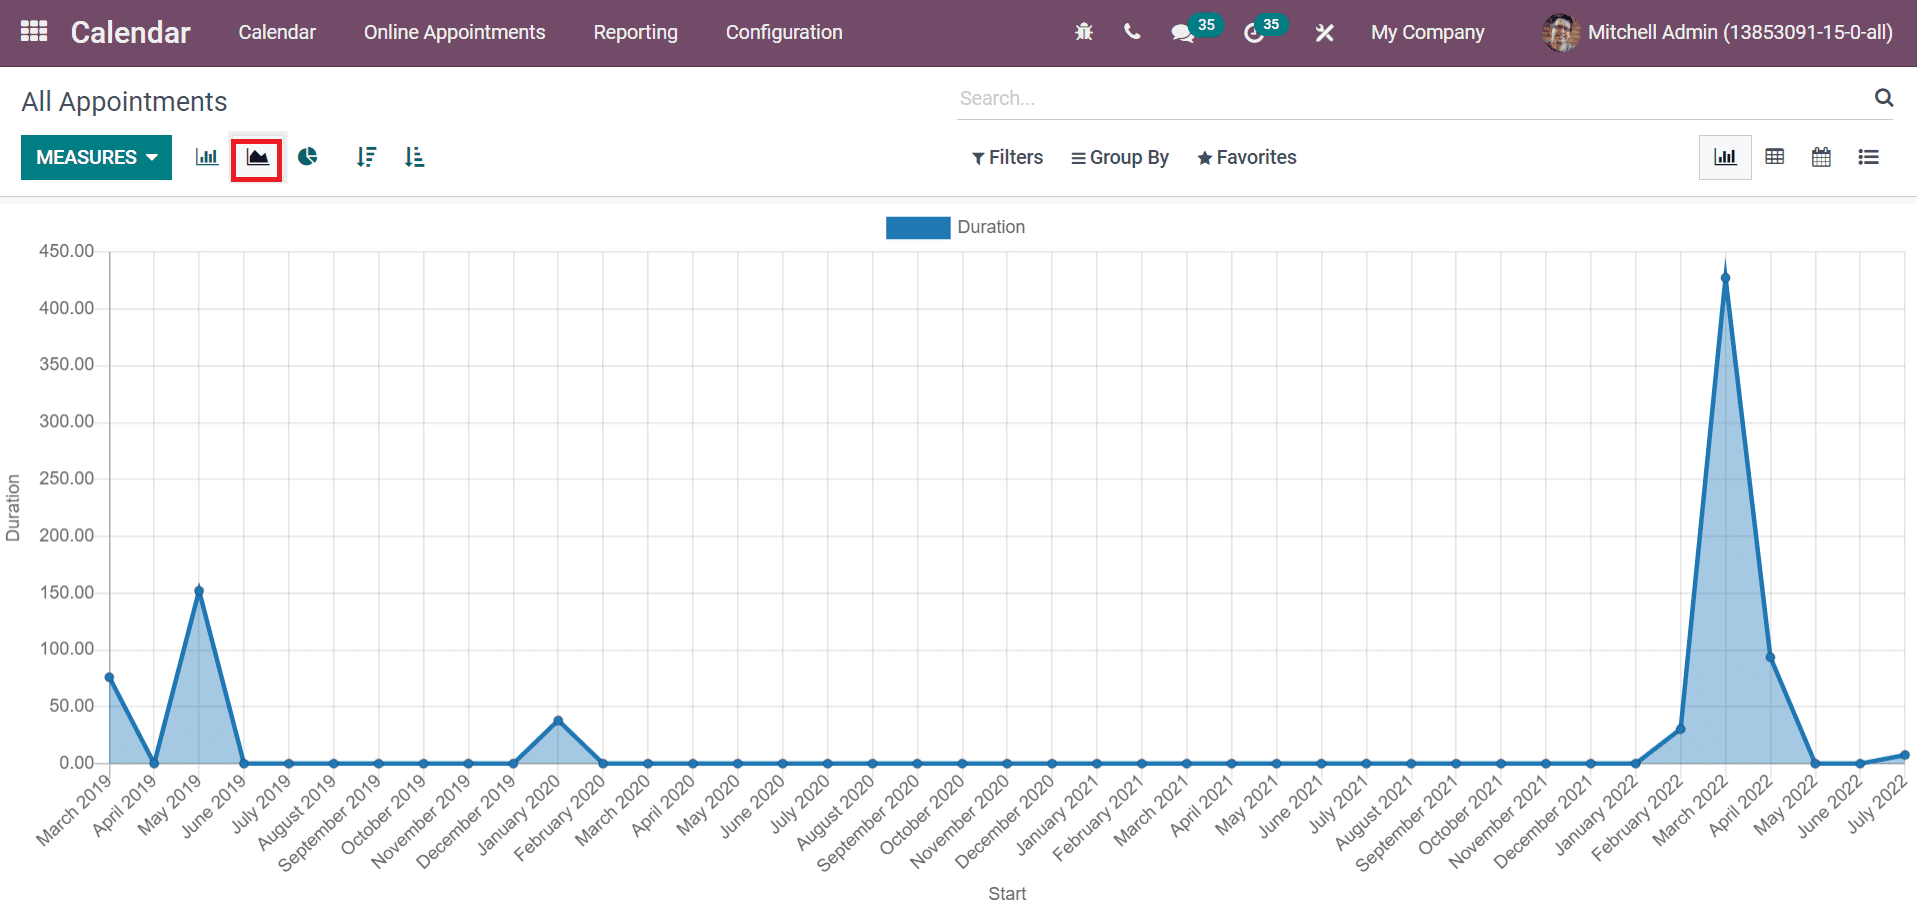
The Line Chart view of the appointments in a graphical format is shown in the screenshot below.
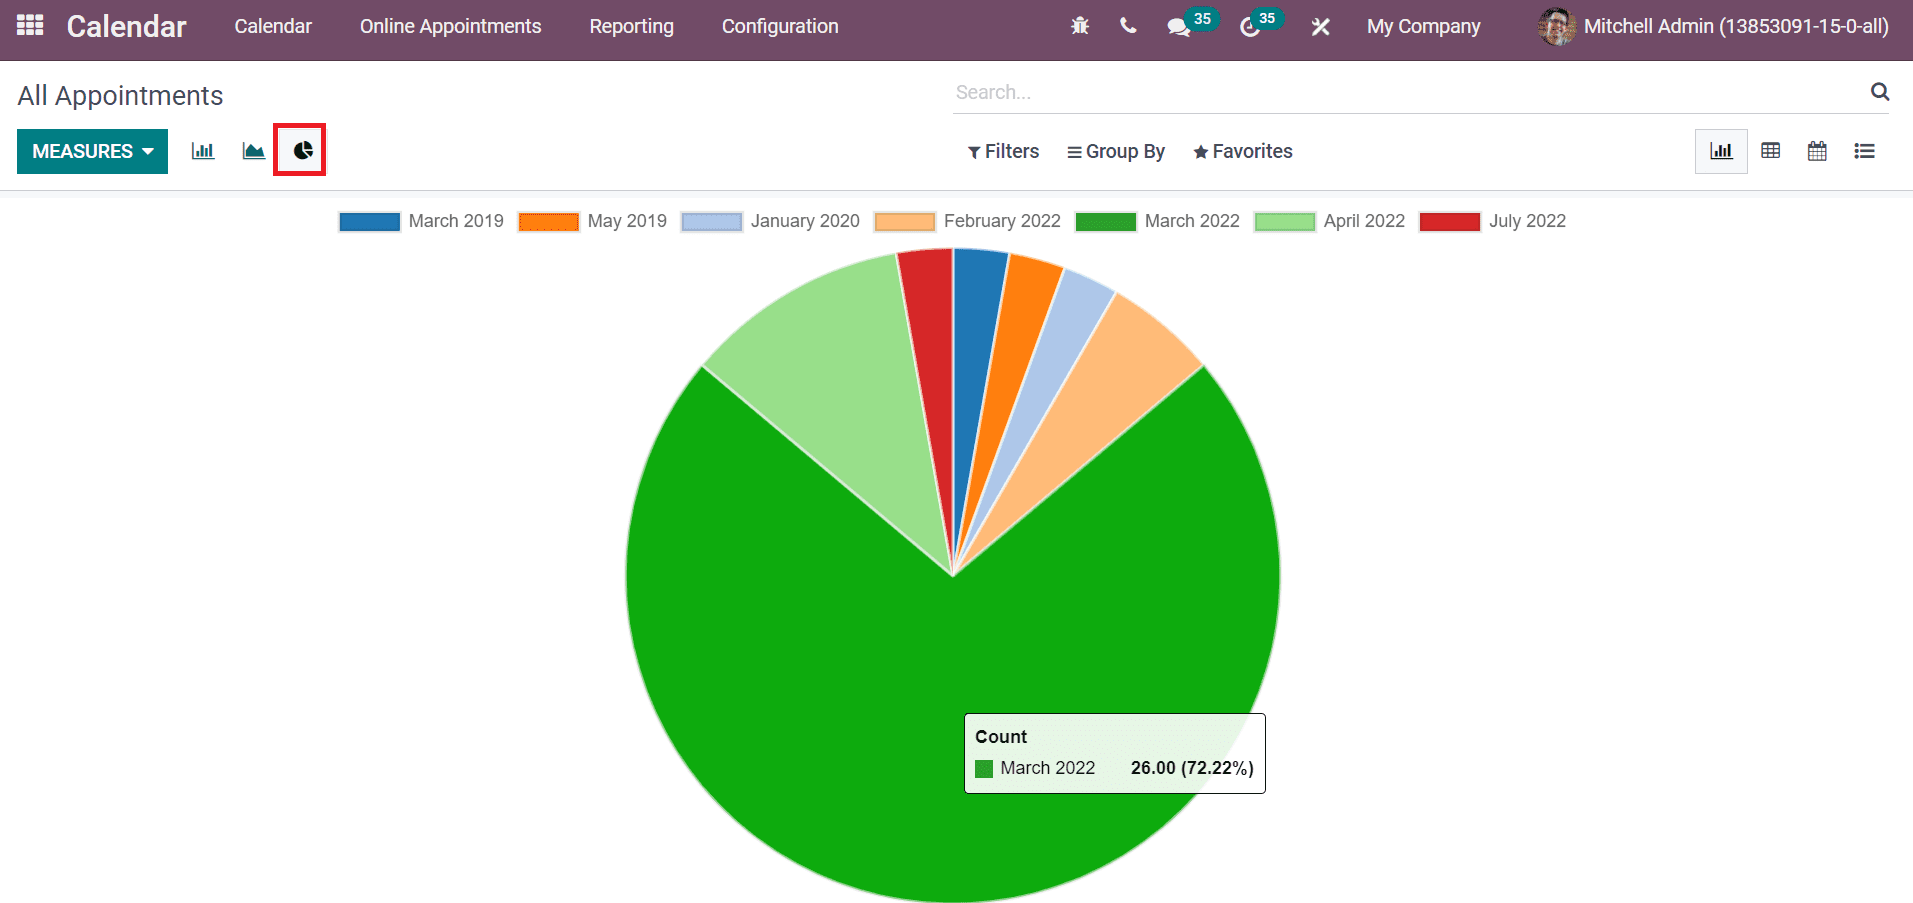
In the Pie chart, you can see the count of all appointments in different colours. The month and year of each appointment depict a different colour at the top of the Pie chart. All Appointments are displayed in a circle with a combination of colours and a percentage rate.
You can see the total appointments count in a pivot table in the Pivot view. Moreover, you can also track each appointment count separately in the table. It is easy to add Document ID, Count and Duration aspects to the pivot table using the Measure icon.
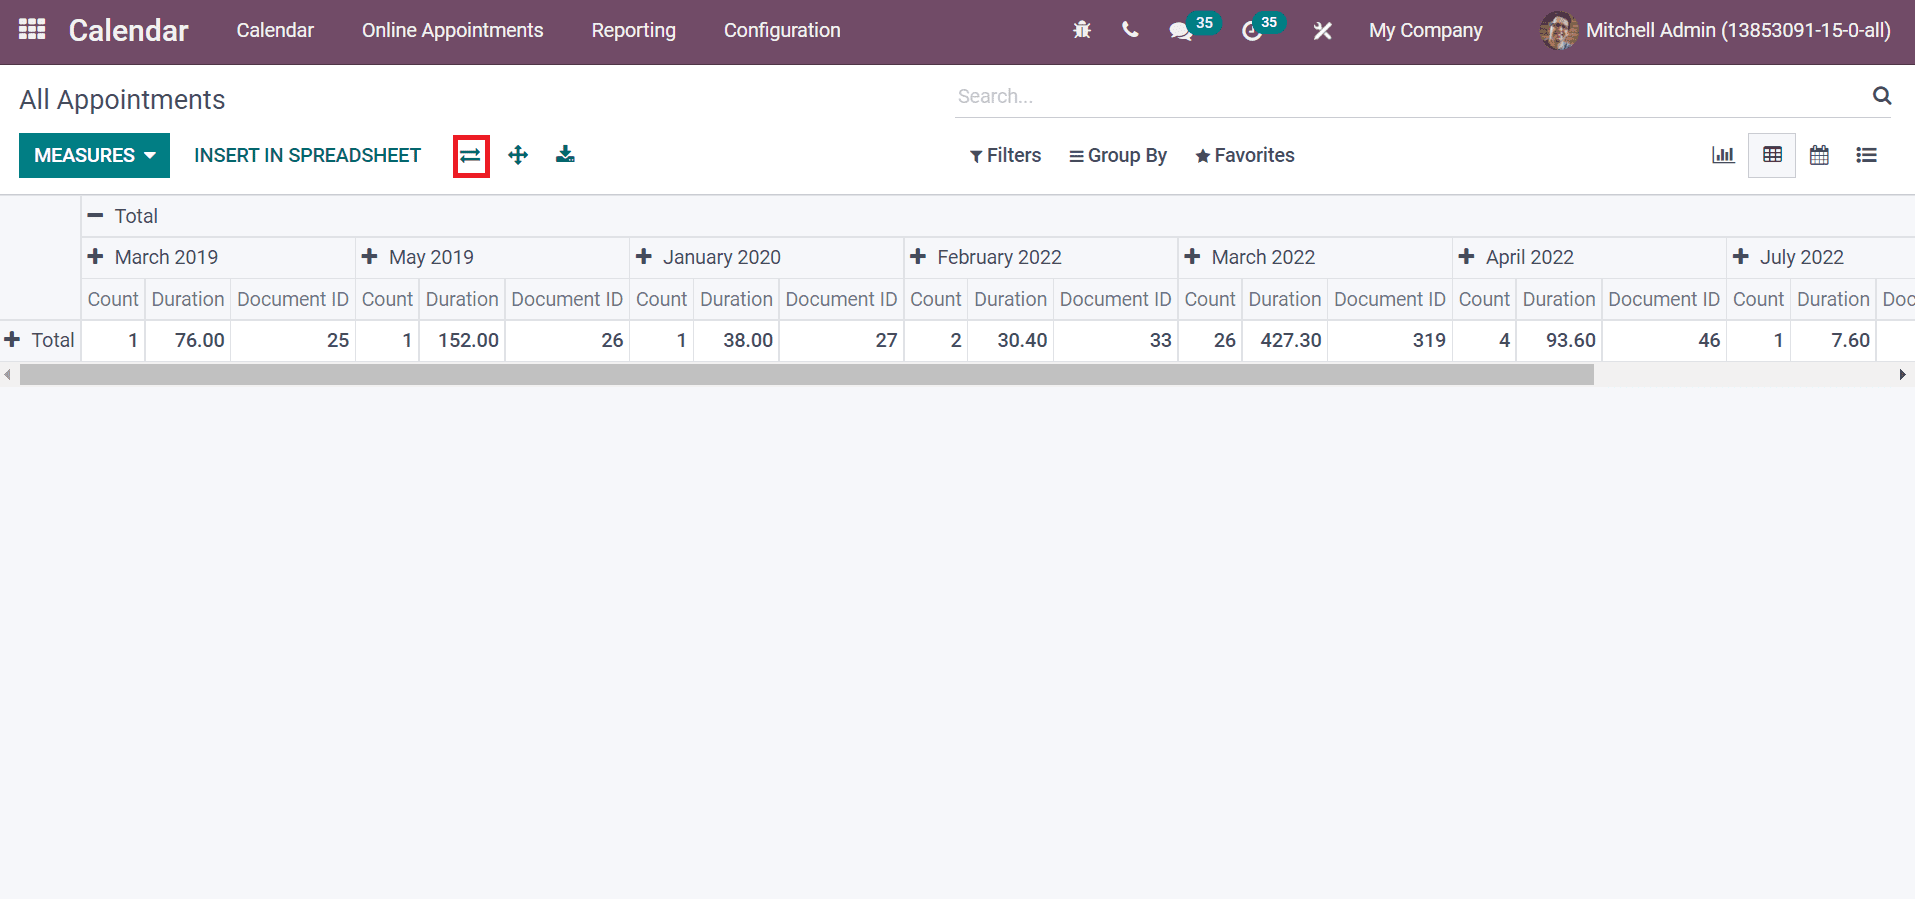
We can see the pivot table in flip format by clicking on the Flip axis, and it is displayed as the screenshot below.
The Download xlxs icon ensures the download of the appointments reports into your file. Users can select a spreadsheet for the pivot table by clicking on the INSERT IN SPREADSHEET option. You can apply custom or default filters such as private, busy, public and more using the Filters option.
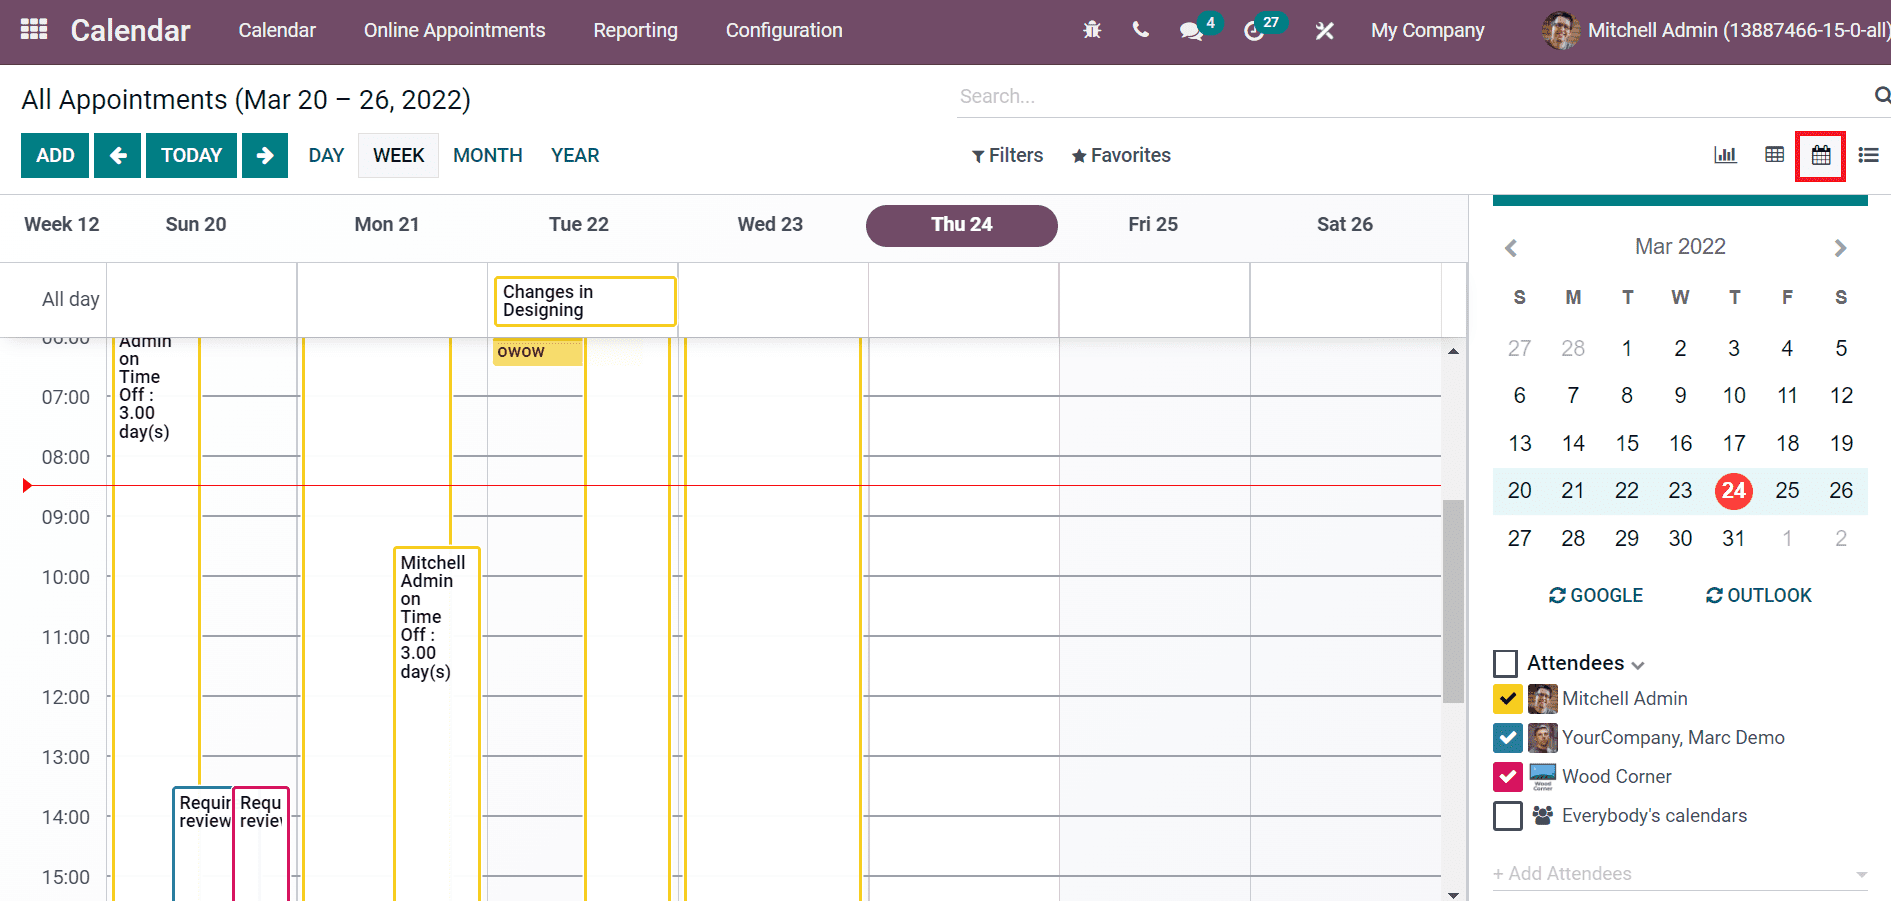
In the Calendar view of the All appointments window, you can see all created appointments on particular dates. We can check out the completed appointments by clicking on a specific date, and all information is visible before you. Users can add attendees for an appointment using the + Add Attendees icon.
In the List view of the All Appointments window, you can get the information about all appointments in the calendar. The details of all appointments such as Subject, End Date, Location, Start Date, Duration, and Attendees as displayed in the screenshot below.
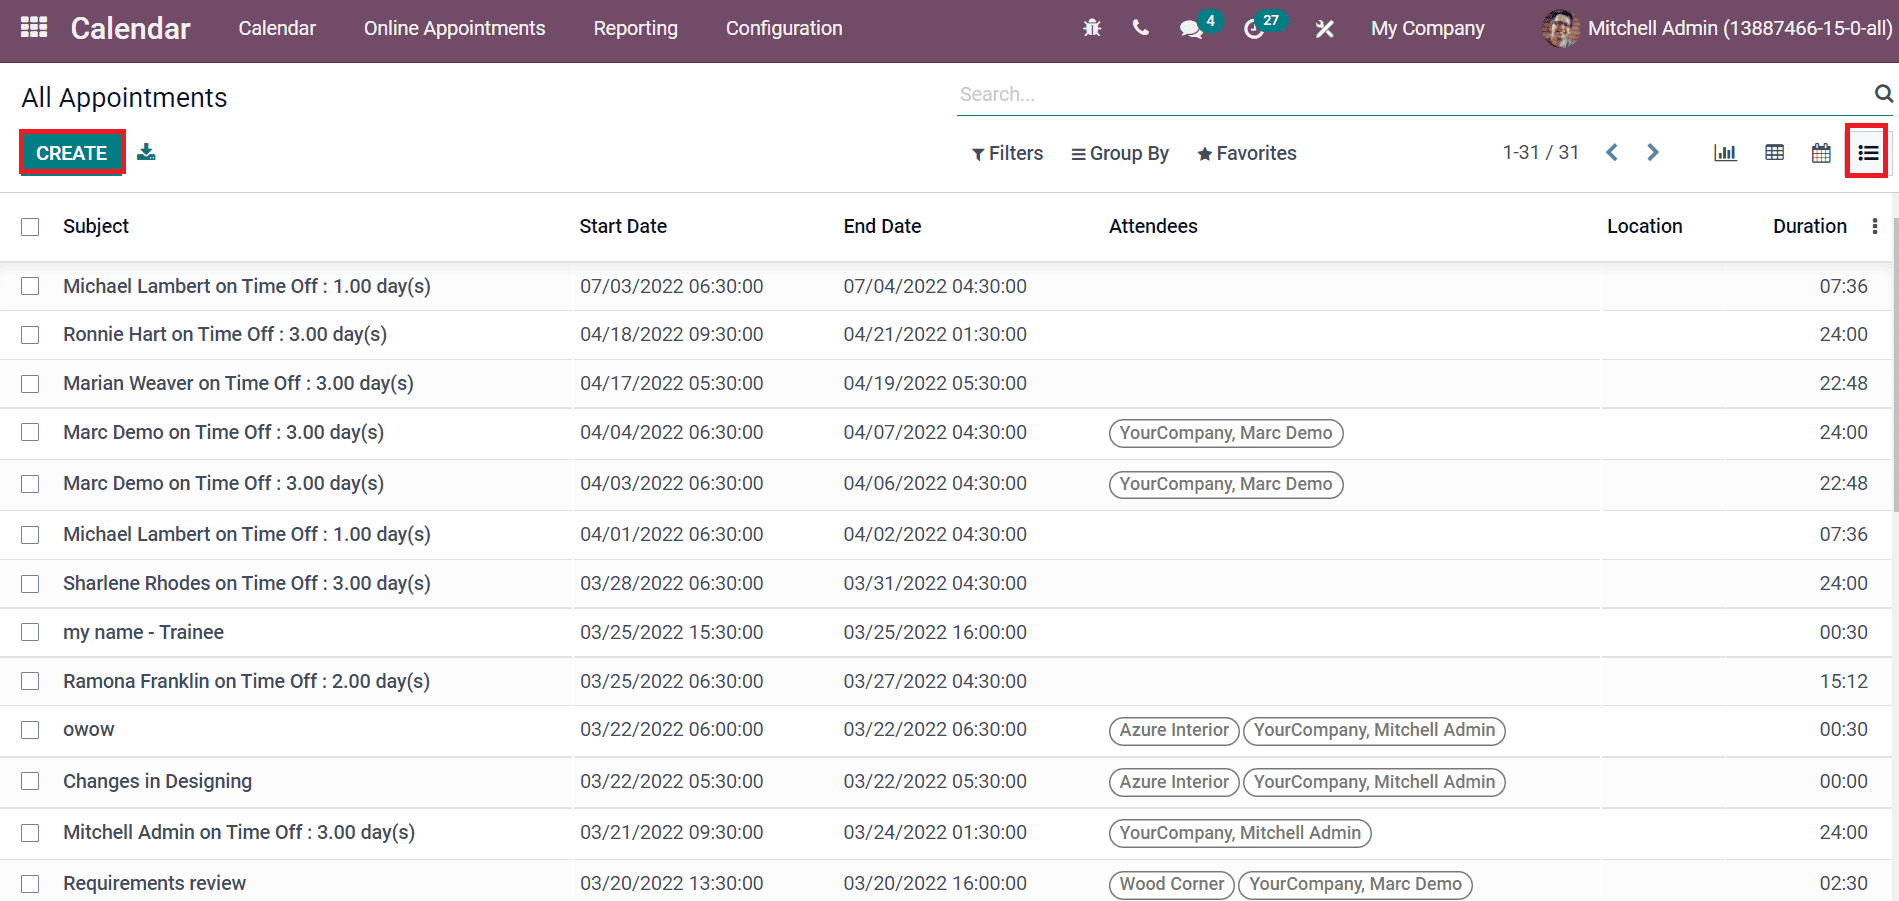
You can develop a new appointment by clicking on the Create icon. It is possible to add more fields into the List window by clicking on the three-dot button at the right end and selecting the fields you want to add. The reports of appointments are generated automatically after the creation of each event.
Here, we discuss the Reporting features in Odoo 15 Calendar module. Users can access the data of Online Appointments and All Appointments through the Reporting tab of the Calendar dashboard. It is easy to keep meeting records in your company with the advanced features of the Odoo 15 Calendar module.