The Odoo ERP software has a powerful and user-friendly reporting feature. All the modules in Odoo include the reporting aspects that will allow you to generate various reports in various measures. This reporting framework will help us to review the performance of our business and allow us to take proper actions to improve our business.
In the previous blog, we discussed the reporting aspects of the Courses and Contents described in the eLearning platform, and in this blog, we can discuss the other menus such as Revenues, Reviews, Quizzes, Forum, and Certifications.
Revenues
The Odoo e-learning platform assists you to generate reports based on the eLearning revenues gained. The report can be generated both in terms of analytical and quantitative measures. The graphical representation of data is available in Bar, Line, and Pie charts. The Bar chart representation of the window is shown below.
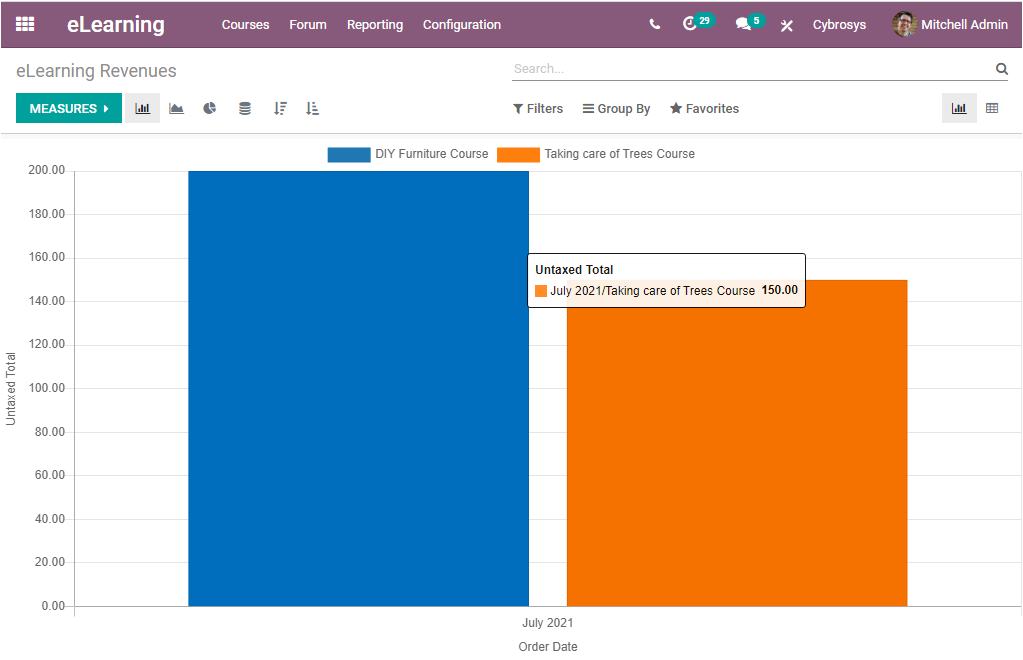
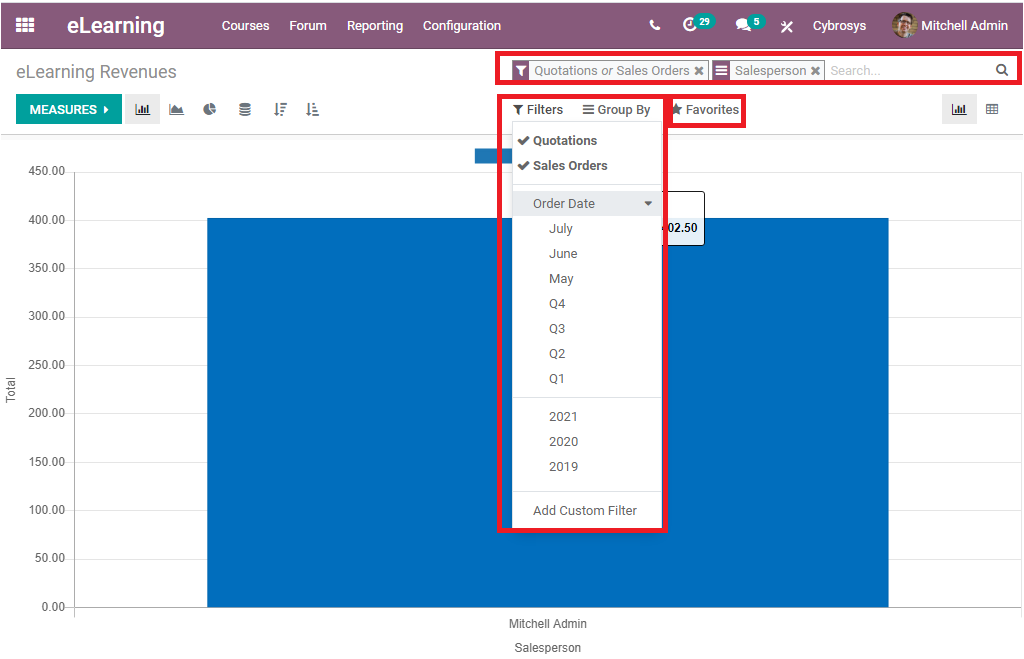
You can make use of the MEASURES tab to view the reports in various measures. As a responsible person or manager of an organization, these types of reporting will help you to examine the revenues and to get a better understanding of your profits at a glance. Moreover, you have all the customizable and default functionalities such as Filters, Group By, and Favourite Search options. You can view these options at the top of the window. The advanced search view option allows you to display only the selected data on your report. This can be done by selecting the magnifying glass icon available at the end of the search bar option available. The Filters and Group By option allow you to sort out the data. You also have the provision to create custom-made filters and these options will help you to reduce the difficulties of searching.
Now we can move to the Pivot table and the window can be accessed by selecting the View Pivot button available on the right top corner of the window.
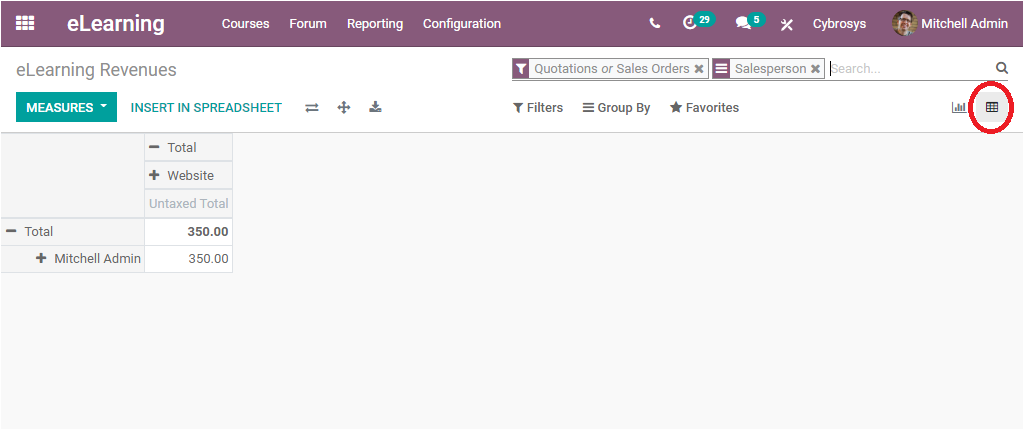
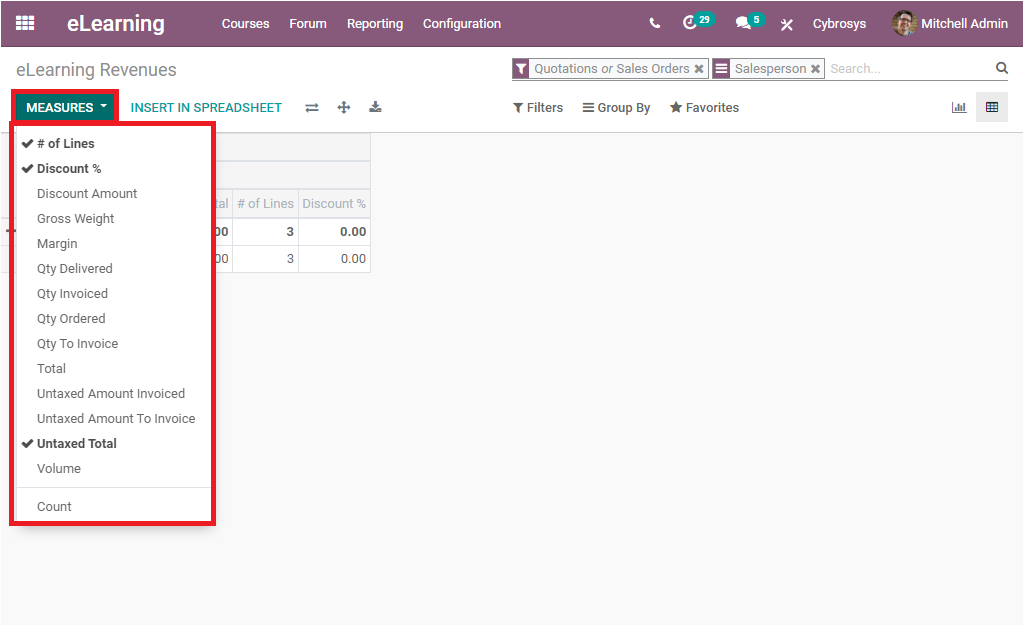
This is the pivot table available and you have the provision to include lots of data in your report by choosing the different measures from the MEASURES button available. If you select the button you will be displayed with so many aspects such as:
> Of Lines
> Discount
> Discount amount
> Gross weight
> Margin
> Quantity Delivered
> Quantity Invoiced
> Quantity Ordered
> Quantity To Invoice
> Total
> Untaxed amount Invoiced
> Untaxed amount to Invoice
> Untaxed Total
> And many more.
Apart from this option, you can also access the smart buttons such as INSERT IN SPREADSHEET, Flip axis, Expand all, Download xlsx which all are available in the same row where we found the button MEASURES.
As we are clear all the options available in the report management of eLearning revenues and now let us move on to the Reviews menu available.
Reviews
The reporting aspect of the Odoo eLearning module also gives prominence to describe the analytical data on the reviews and ratings marked by the candidates on the courses defined in the platform. The platform allows you to display the reports in a more visual format based on the data you want to highlight. In the Graph view, this reporting can be viewed in the form of three smart views as Line, Bar, and Pie Charts. In addition, you can also view reports in Stacked format. The below image depicts the bar chart view of the Rating window.
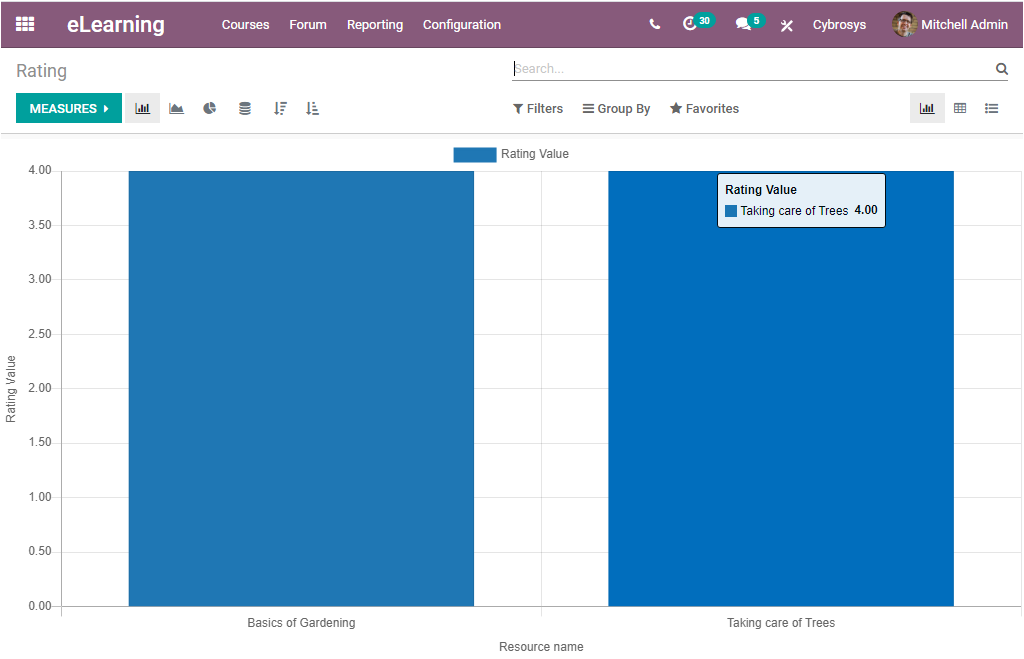
Here also you can add various data to your report by selecting the MEASURES button available. Similarly, various default, as well as customizable sorting functionalities such as Filters, Group By, and Favourite Searches, are available with this window.
The reports can also be viewed in Pivot view. On selecting the View Pivot icon, you can jump into the window. The image of the window is depicted below.
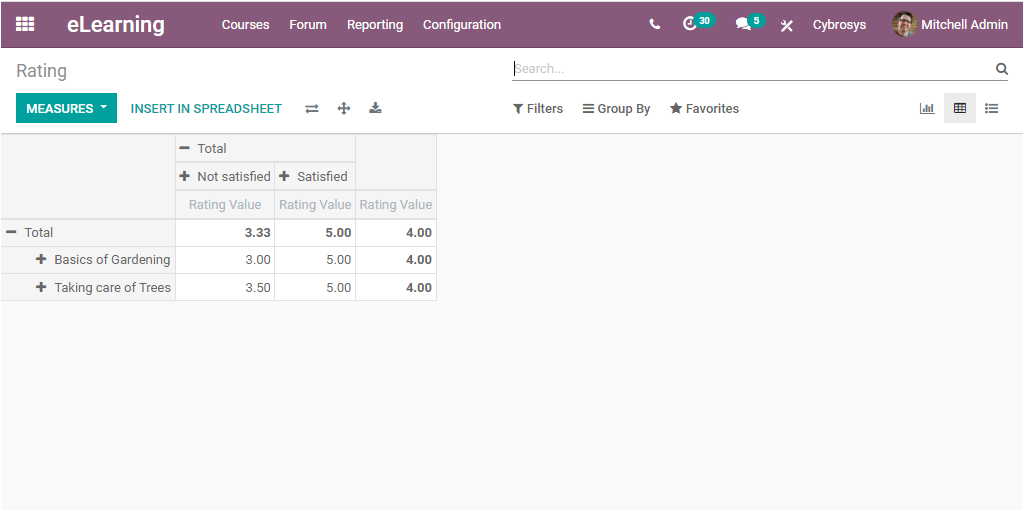
In the Pivot view, the reports are generated in a tabular format. The + and - icons available in the window allow you to drill up and down your reports with the intention of changing the visual format of your data. It is also possible to include more data with different measures using the MEASURES button available. In addition, you can insert the table in a spreadsheet by accessing the INSERT IN SPREADSHEET button.
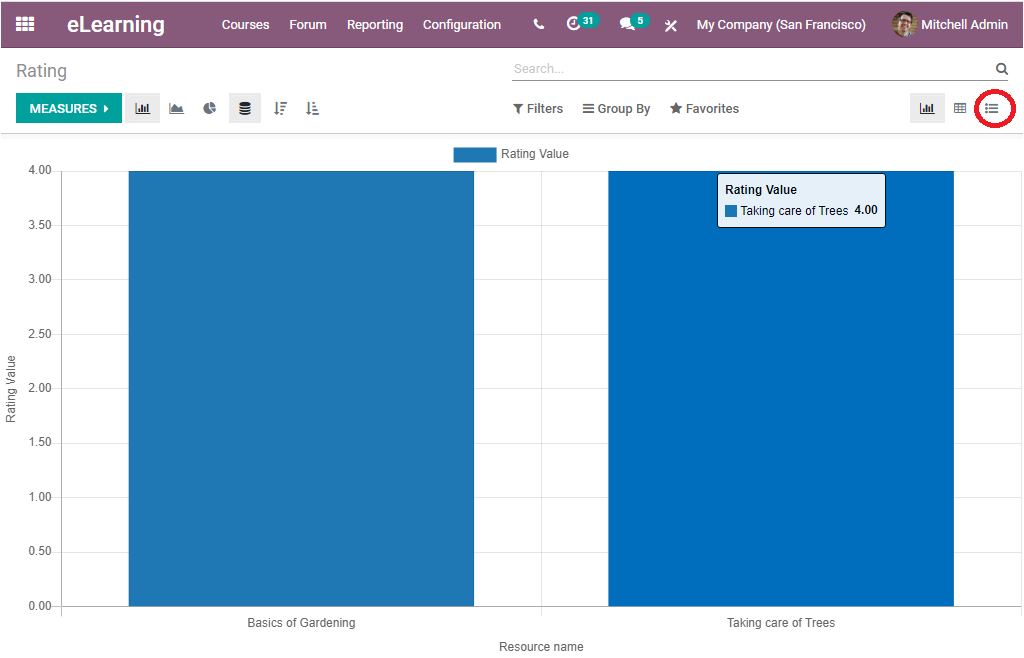
Now let us have a look at the Rating/Review window in List view format. For viewing this window, you can click on the View List button available on the top right corner of the window as highlighted in the below image.
Now the List view of the Rating window will look like the below image.
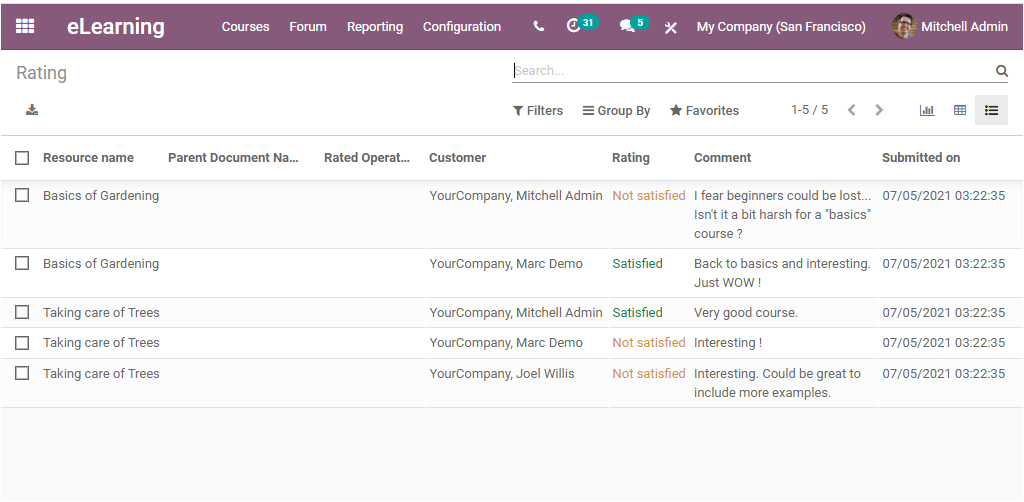
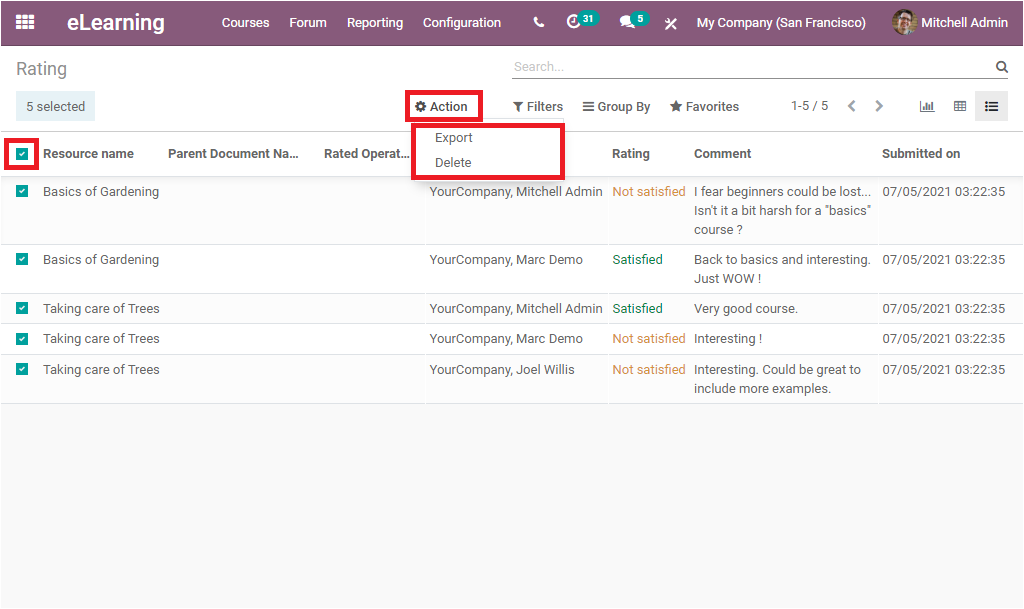
In this list view, you can view various data such as Resource Name, Parent Document Name, Related Operator, Customer, Rating, Comment, and Submitted date. On the left side of the window, you can view a check box. If you are selecting the checkbox, you will be depicted with a smart button called Action where you will get a dropdown menu with Delete and Export buttons. These buttons are highlighted in the below screenshot. This action can be performed for both single records and multiple records. If you want to perform the action for multiple records, you can check the box available on the header of the window as shown in the below screenshot.
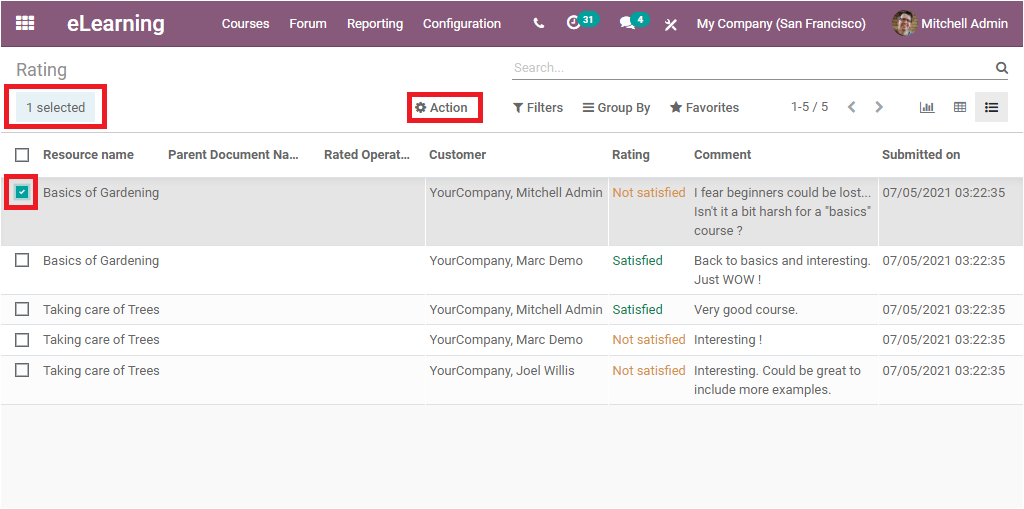
On the other hand, if you want to perform an action for only one record, you can just check the box near the record as depicted in the below image. So the action can be performed for only the selected record.
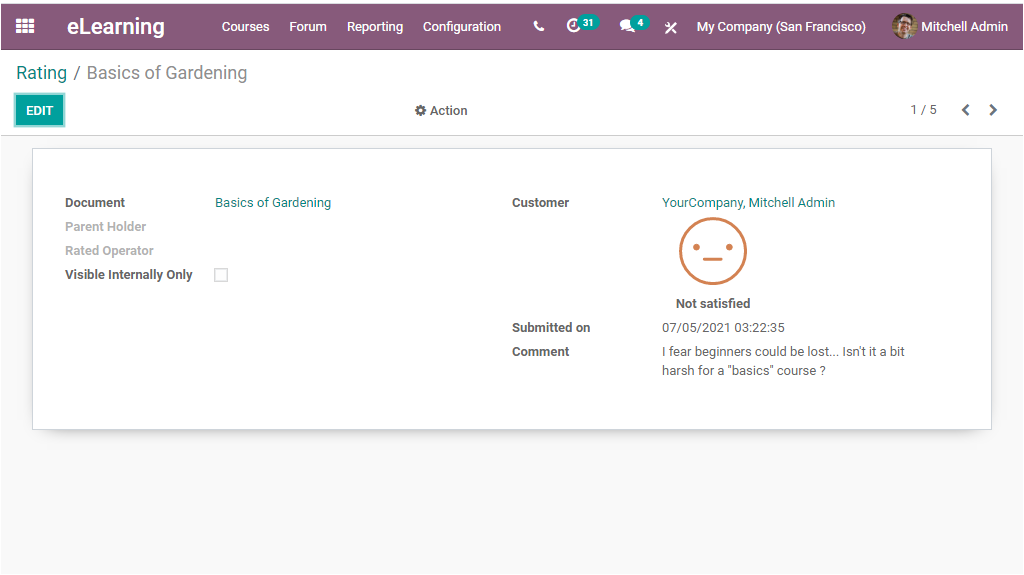
Additionally, you also have sorting options such as Filters, Group By, Favourite search. These options are very helpful for you to manage your bundle of data. Also, you can export the data to an excel sheet by selecting the Export all option available on the left top corner of the window. Apart from these options, you can view each of the reviews separately by selecting them. For example, if we select the first review Basics of Gardening you will be able to view the data in detail in another window as displayed in the below image where you have the Edit option for making desirable changes.
This is all about the Reviews and Ratings reporting aspects of the module. Now let us discuss the Quizzes window available under the reporting section of the Odoo eLearning platform.
Quizzes
The report analysis of the Quizzes performed in the eLearning platform can be accessed from the Reporting tab. On selecting the Quizzes menu, you will be taken to the Quizzes page. The image of the Quizzes window is depicted below.
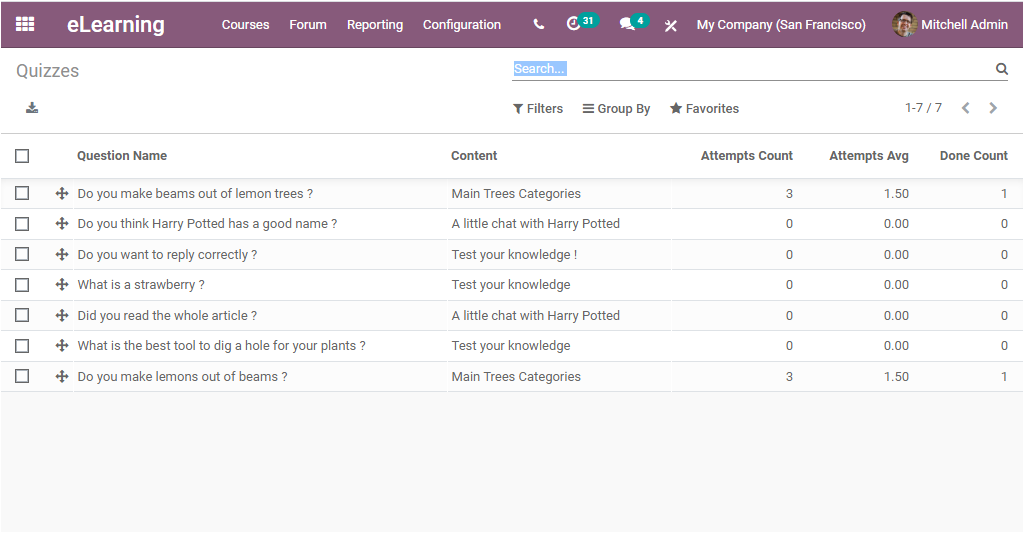
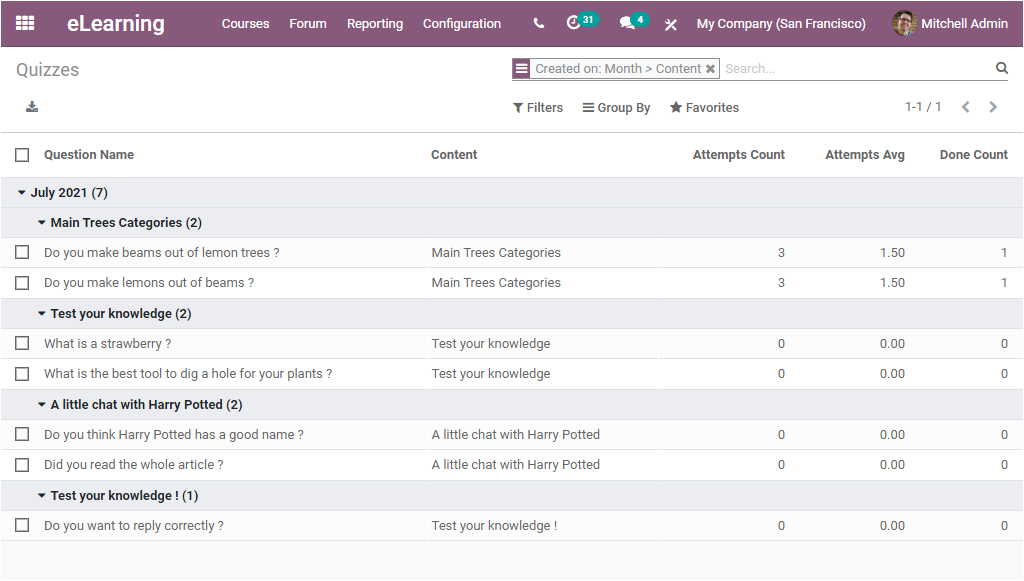
In this Quizzes window, you can view all the configured Question names for the quiz along with the Content, Attempts Count, Attempts Average, and the Done Count. Here also you can check the box available on the left side of the window for performing an action for the selected or for all the questions as we mentioned earlier. You can open each of these questions by clicking on them. For viewing, we can click on the first question: Do you make beams out of lemon trees? Now it will open to the next window as shown in the below image.
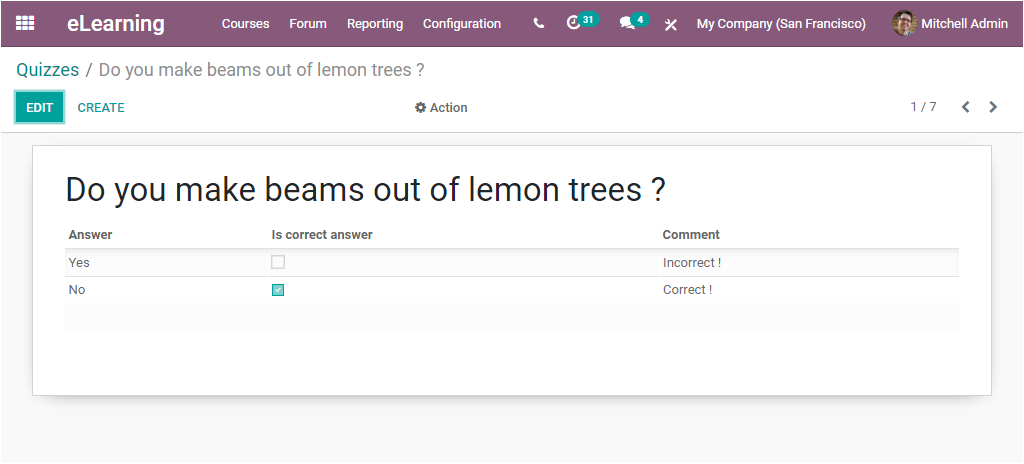
In this window, you can view the question and related details. You can make desired modifications to the question by selecting the Edit option available. You can also create new questions by selecting the Create icon available on the top left corner of the window.
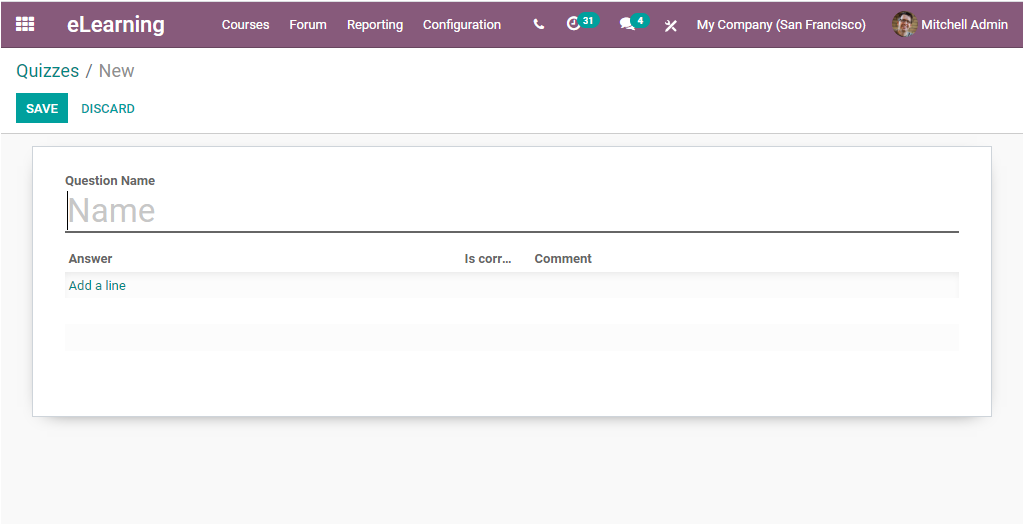
Here in this question creation window, you can provide the Question Name, and you can provide the answer by clicking on the Add a line option available. You can enable or disable the box for marking whether it is the correct answer or not. In addition, you can also include a comment. After providing all the details, you can save the details by selecting the Save button available.
Back to the Quizzes window where you get all the advanced reports about the performances of your quizzes will also allow you to add default or customized filters for showing the selected and required data. You can also group the results using the option Group By. You can add different custom groups by clicking on the Add Custom Group icon available.
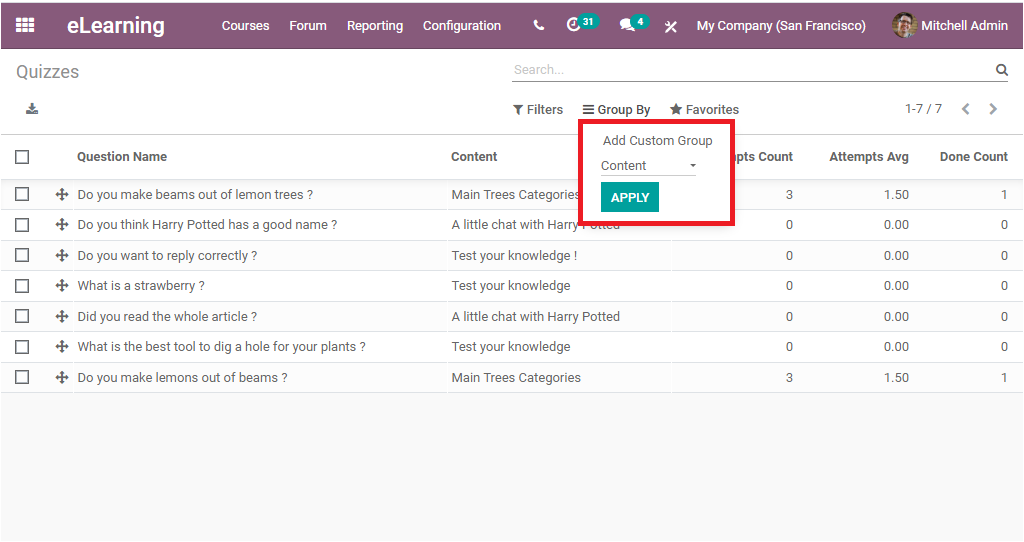
Here you can add custom groups based on the Contents, Created by, Created on, Last updated by, Last updated on, Question name, and Sequence. For example, we can apply groups based on the month created and the content.
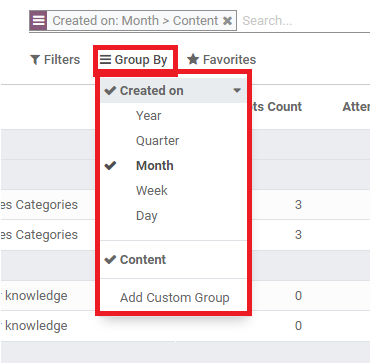
Now the window will display the reports based on the month (July) and the data on the basis of the content. The window will look Like the image below.
So far we were discussing the report analysis of the Quizzes configured in the platform and now let us move to the next menu Forum for getting the useful report analysis of the Forums created.
Forum
In the Odoo platform, the user has the provision to create forums and the forums act as conversational threads that bring questions, responses, and conversations on specific topics. Odoo also gives prominence to generating reports based on these forums. This will allow you to analyze the performance of forums.
Odoo displays the eLearning forum posts analysis in various graphical representations. You can view the reports in Bar Chart, Line Chart, and PieChart. Moreover, you can view the reports in Stacked format also. This can be done by selecting the Stacked menu available in the window. The stacked format of the report can be viewed in the below image where I also have highlighted the Stacked menu.
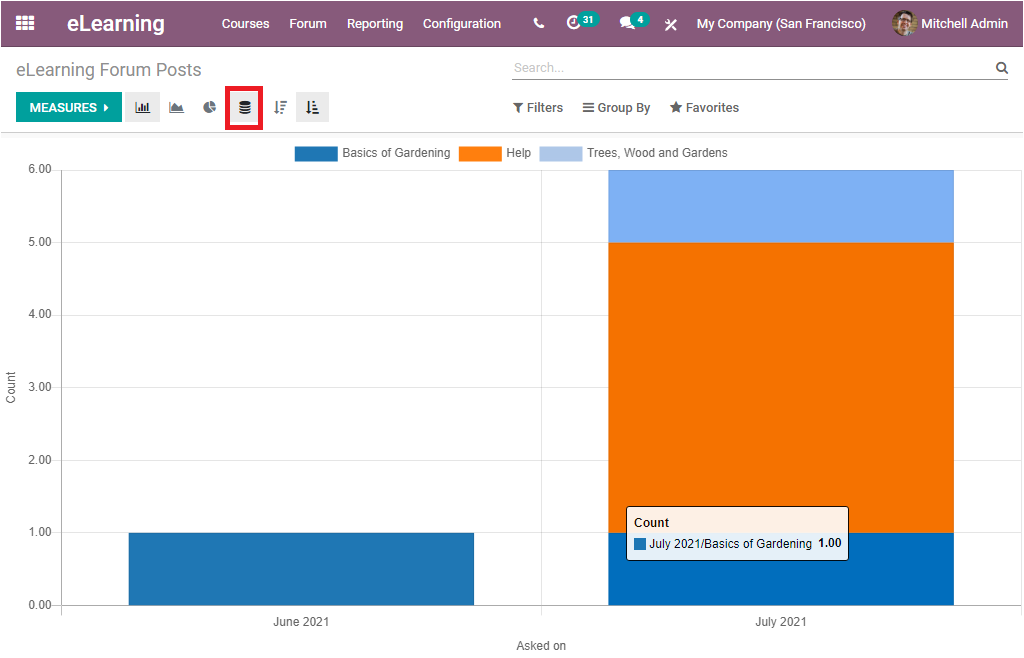
You can also view all the reports in both Ascending and Descending order by selecting the respective menu available. Now let us have a look at the Pie chart representation of the window in terms of the answers.
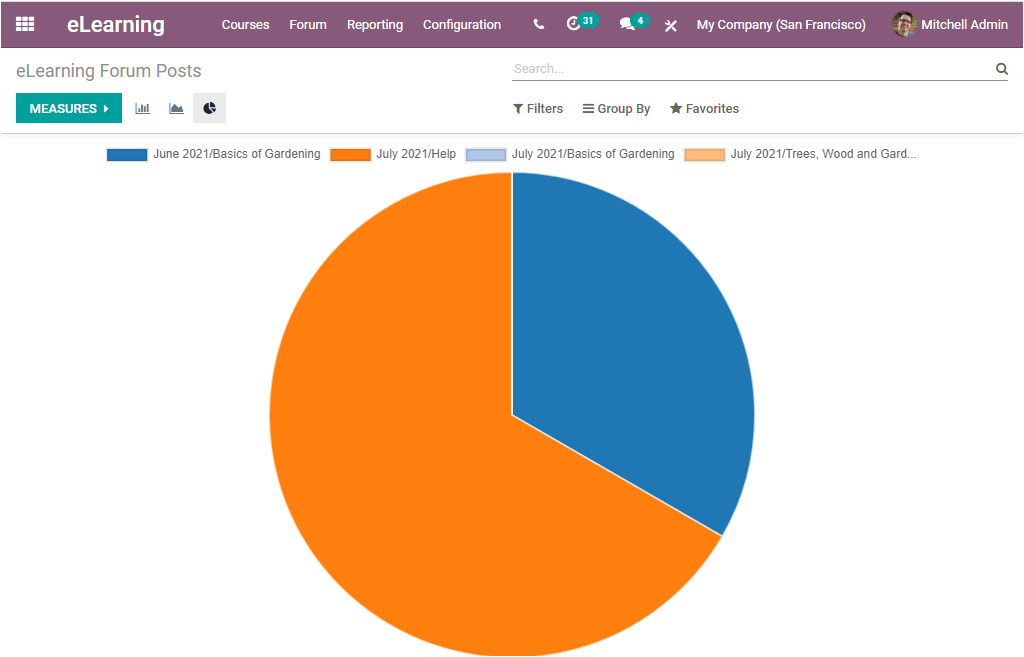
The Odoo platform allows you to generate reports based on various measures such as Answers, Favourite, Relevance, Total Votes, Views, and Count. For viewing these reports, you can select the respective measure from the MEASURES tab available.
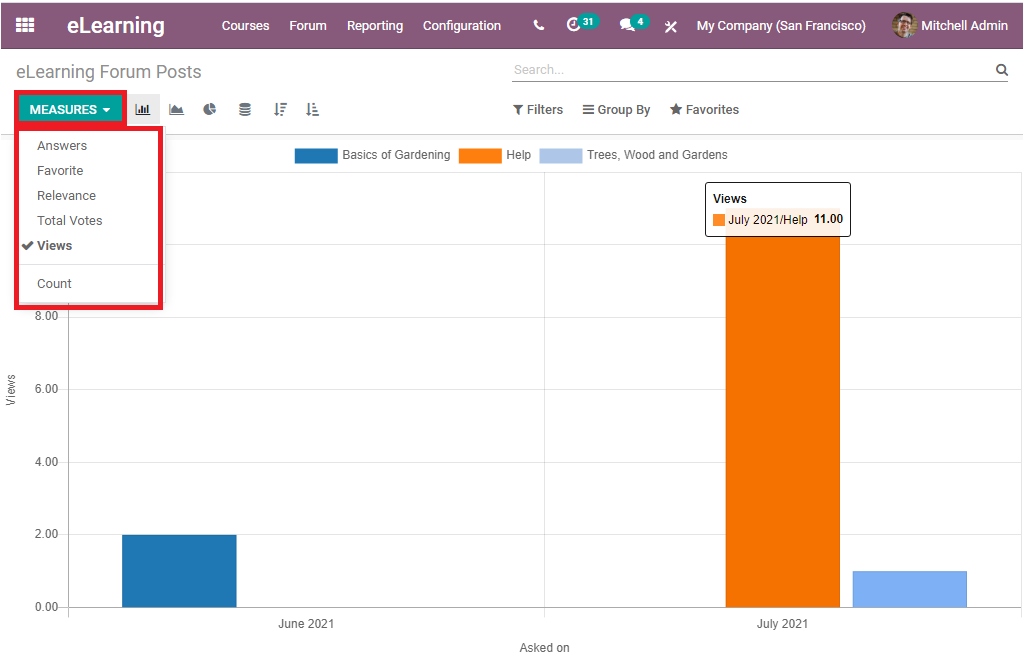
In this image, you can view the MEASURES tab and the various measures described in the platform. And the graph represents the views count with different courses. Similarly, you can view all these measures in graphical representation. Now it is also possible to add predefined or customized filters to display only the data which you want. This can be done by selecting the Filters option available.
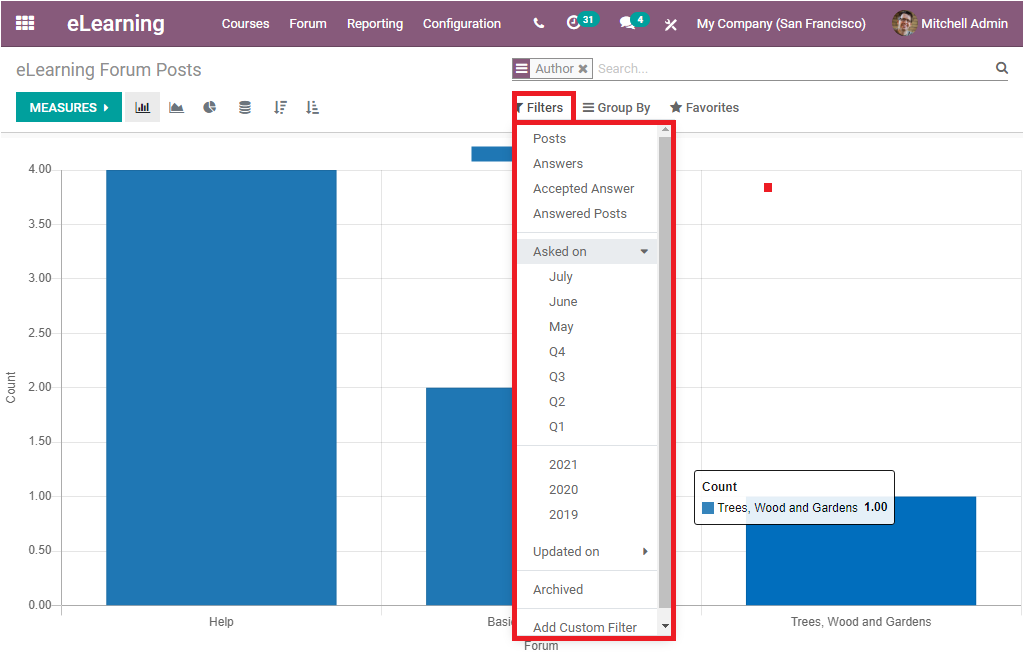
Apart from this Filters option, you can also make use of the Group By and Favourite search option to sort out the data.
As we are clear on the important features available in the Forum menu available under the Reporting tab of the Odoo eLearning platform and now let us have a glance at the report analysis available for the Certifications configured in the platform.
Certifications
The Certifications window available on the platform is depicted below. In this window, you can view all the certifications created on the platform along with the details such as the Survey Title, Survey stage, Number of Registered, Number of Attempts, Number of Success, Success Ratio, and the Average Score.
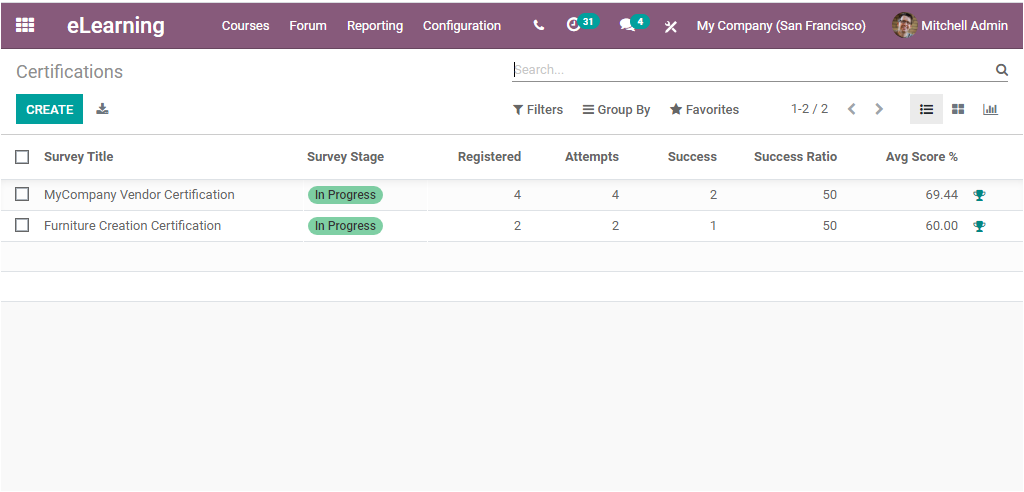
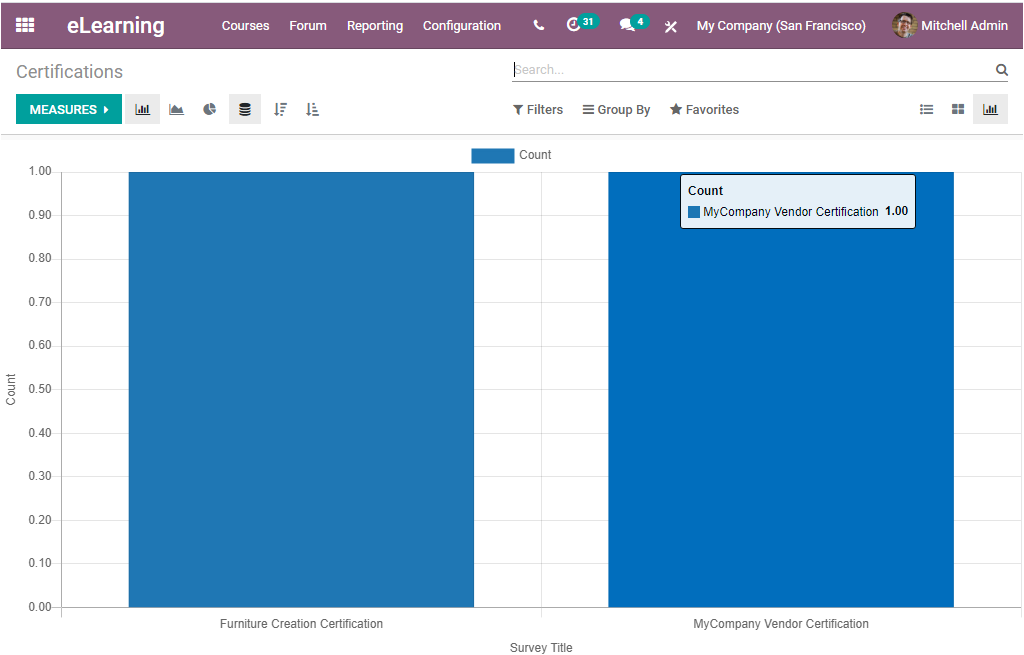
This is the List view of the Certification window. You can also view the window in Kanban and Graph view. The Graphical representation of the window is depicted below.
This is how the Odoo eLearning platform helps us to generate various reports to analyze the various operations and performances of your eLearning platform.