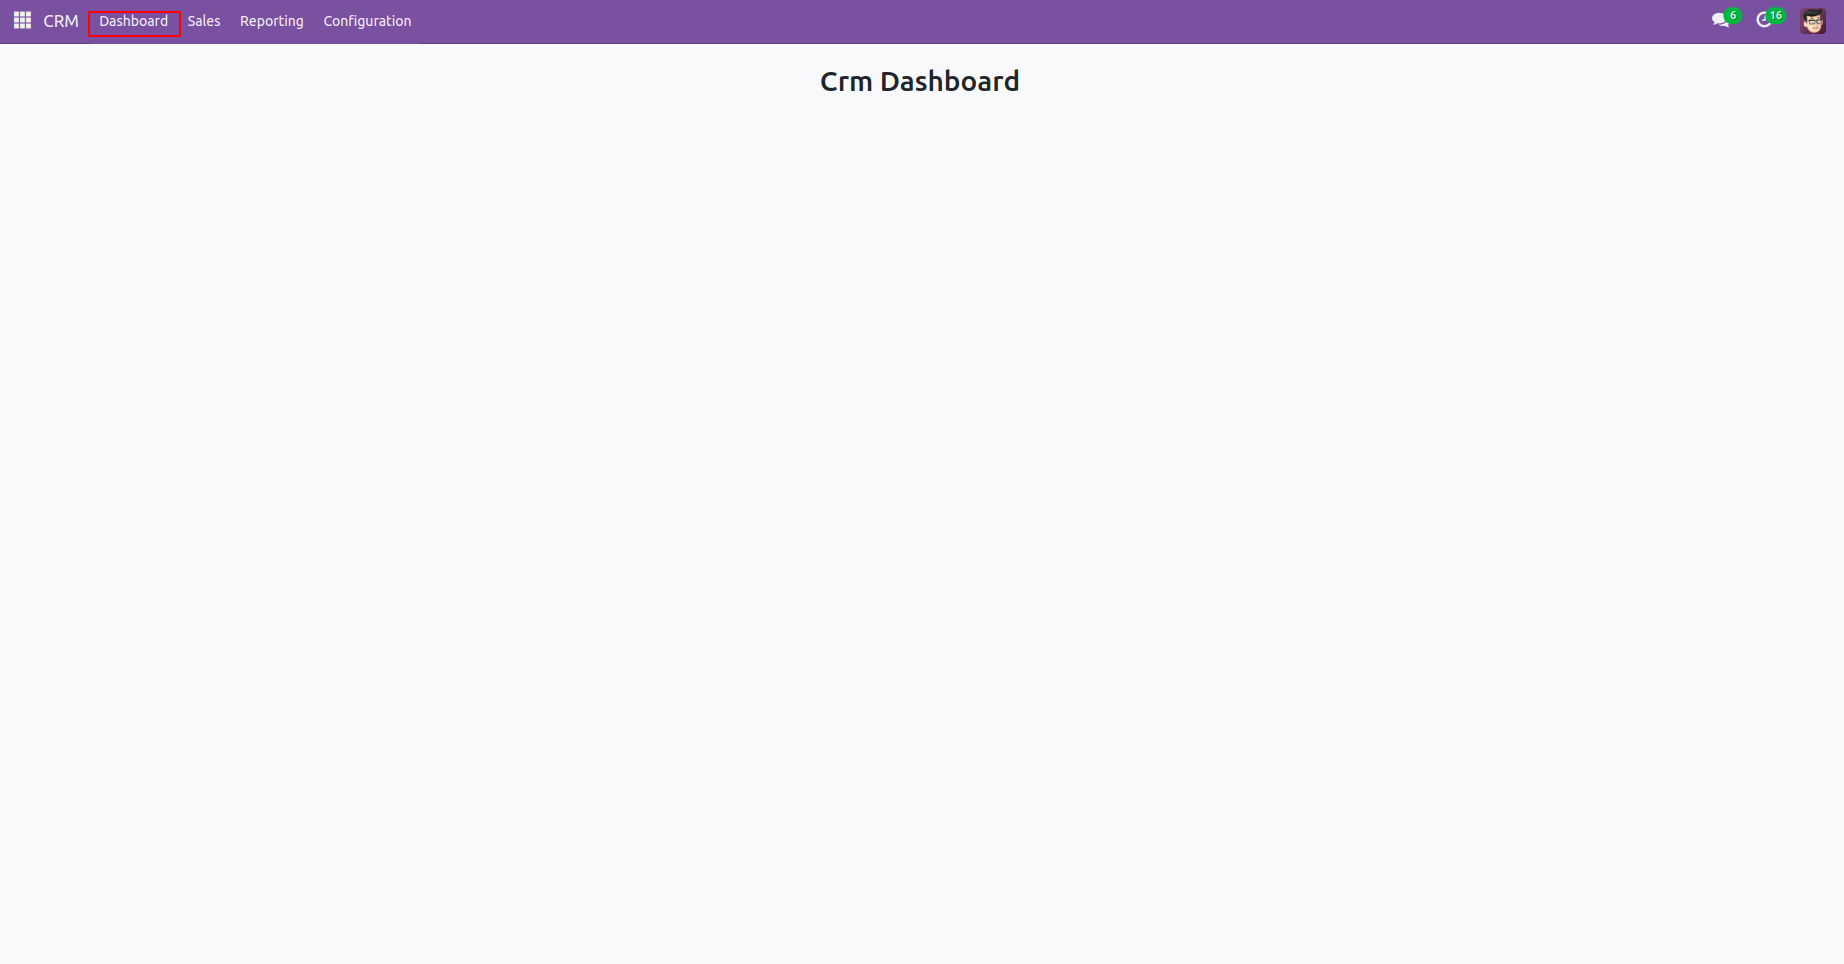
Dashboards are useful for quickly summarising crucial information and centralizing corporate data. This is employed to chart the organization’s overall performance. For this, various visualization techniques, such as diagrams, charts, and other kinds of representation.
In Odoo, dashboards are essential to developing a user-friendly platform for effective data management. Now, let's look at how to set up a dashboard in Odoo17.
Client actions are used in rendering the dashboard, with these actions typically activated through menu items.
The client action that renders the dashboard is defined as follows:
<record id="crm_dashboard_action"      model="ir.actions.client">
   <field name="name">CRM Dashboard</field>
   <field name="tag">crm_dashboard_tag</field>
</record>
<menuitem name="Dashboard" id="crm_dashboard"
sequence="0" action="crm_dashboard_action"
parent="crm.crm_menu_root"/>
name= ”name” is the name of the record that name will show when we open the dashboard.
name= ”tag” is the tag that will connect the js file with our action.
Here, clicking the menu item "Dashboard" crm_dashboard_action will trigger, and the JS file will then be connected to the action by the tag "crm_dashboard_tag."
After that, a component representing the client's action has to be created.
Create a js file on the static > src > js > dashboard.js
/**@odoo-module **/
import { registry } from "@web/core/registry";
import { Component } from  "@odoo/owl";
const actionRegistry = registry.category("actions");
class CrmDashboard extends Component {}
CrmDashboard.template = "my_module.CrmDashboard";
//  Tag name that we entered in the first step.
actionRegistry.add("crm_dashboard_tag", CrmDashboard);
We can get a blank dashboard view on the user interface.
Next, we have to create a template to show the view of the template.
Create an XML file on the static > src > xml > dashboard.xml
<?xml version="1.0" encoding="UTF-8" ?>
<templates>
    <t t-name="my_module.CrmDashboard">
        <div class="">
            <div>
                <center>
                    <h1 style="margin:20px;">
                    Crn Dashboard</h1>
                </center>
            </div>
        </div>
    </t>
</templates>
Don't forget to include all of these files in the manifest when they have been defined;
'assets': {
        'web.assets_backend': [
            'my_module/static/src/js/dashboard.js',
            'my_module/static/src/xml/dashboard.xml',
        ],
    },
Now we can see as follows.

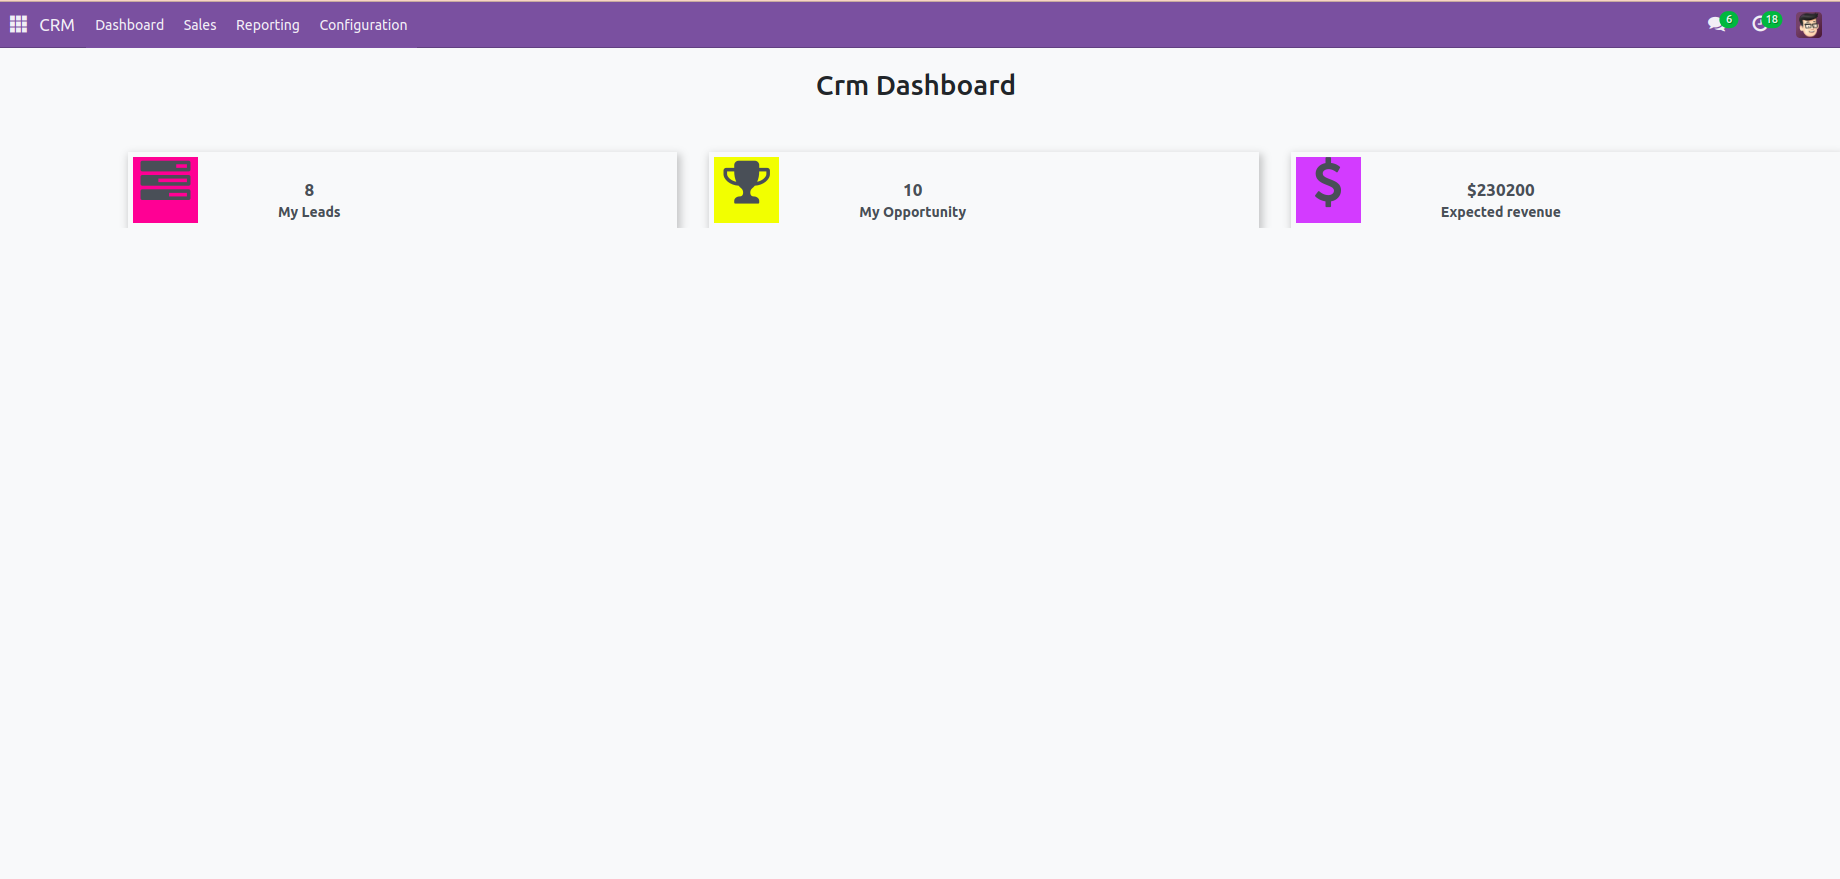
Now, let us see how to add tile to the dashboard.
   <div class="row main-section" style="margin-left: 120px;">
<!--            Lead Tile-->
            <div id="leads" class="col-md-4 col-sm-6 tot_tasks oh-payslip"
                 style=" overflow: hidden; padding-top: 30px;">
                <div class="oh-card" style="box-shadow:2px 4px 8px 2px rgba(0,0,0.3,0.2);
                display: flex; justify-content: center;" role="button">
                    <div class="oh-card-body"
                         style="padding: 5px 5px; float: left; width: 100%;
                          height: auto; box-sizing: border-box; margin: 0;">
                        <div class="stat-widget-one">
                            <div class="stat-icon bg-mauve-light d-flex justify-content-left align-items-left">
                                <div style="background:#ff4d94; width:65px; text-align: center;">
                                    <i class="fa fa-tasks text-mauve"
                                       style="font-size:50px;"/>
                                </div>
                                <div class="stat_content" style="
                                  text-align: center; font-weight: bold;
                                  padding-top: 20px; padding-left: 80px;">
                                    <div class="stat_count_lead"
                                         style="font-size: 17px;">
                                        <span id="templates">
                                             <div id="my_lead"/>
                                        </span>
                                    </div>
                                    <div class="stat-head"
                                         style="font-size: 14px;">My Leads
                                    </div>
                                </div>
                            </div>
                        </div>
                    </div>
                </div>
            </div>
<!--       Opportunity Tile-->
            <div id="opportunity" class="col-md-4 col-sm-6 tot_tasks oh-payslip"
                 style=" overflow: hidden; padding-top: 30px;">
                <div class="oh-card" style="box-shadow:2px 4px 8px 2px rgba(0,0,0.3,0.2);
                display: flex; justify-content: center;" role="button">
                    <div class="oh-card-body"
                         style="padding: 5px 5px; float: left; width: 100%;
                          height: auto; box-sizing: border-box; margin: 0;">
                        <div class="stat-widget-one">
                            <div class="stat-icon bg-mauve-light d-flex justify-content-left align-items-left">
                                <div style="background:yellow; width:65px; text-align: center;">
                                    <i class="fa fa-trophy  text-mauve"
                                       style="font-size:50px;"/>
                                </div>
                                <div class="stat-content" style="
                                  text-align: center; font-weight: bold;
                                  padding-top: 20px; padding-left: 80px;">
                                    <div class="stat_count_opp"
                                         style="font-size: 17px;">
                                        <span id="templates">
                                             <div id="my_opportunity"/>
                                        </span>
                                    </div>
                                    <div class="stat-head"
                                         style="font-size: 14px;">My Opportunity
                                    </div>
                                </div>
                            </div>
                        </div>
                    </div>
                </div>
            </div>
<!--            Expected Revenue -->
            <div id="expected_revenue"
                 class="col-md-4 col-sm-6 tot_tasks oh-payslip"
                 style=" overflow: hidden; padding-top: 30px;">
                <div class="oh-card" style="box-shadow:2px 4px 8px 2px rgba(0,0,0.3,0.2);
                display: flex; justify-content: center;" role="button">
                    <div class="oh-card-body"
                         style="padding: 5px 5px; float: left; width: 100%;
                          height: auto; box-sizing: border-box; margin: 0;">
                        <div class="stat-widget-one">
                            <div class="stat-icon bg-mauve-light d-flex justify-content-left align-items-left">
                                <div style="background:#bf80ff;; width:65px; text-align: center;">
                                    <i class="fa fa-usd  text-mauve"
                                       style="font-size:50px;"/>
                                </div>
                                <div class="stat-content" style="
                                  text-align: center; font-weight: bold;
                                  padding-top: 20px; padding-left: 80px;">
                                    <div class="stat_count_ex_rev"
                                         style="font-size: 17px;">
                                        <span id="templates">
                                             <div id="revenue"/>
                                        </span>
                                    </div>
                                    <div class="stat-head"
                                         style="font-size: 14px;">Expected
                                        revenue
                                    </div>
                                </div>
                            </div>
                        </div>
                    </div>
                </div>
            </div>
        </div>
The data to the dashboard is fetched from the js file using Orm. call method as follows:
/**@odoo-module **/
import { registry } from "@web/core/registry";
import { useService } from "@web/core/utils/hooks";
import { Component } from  "@odoo/owl";
const actionRegistry = registry.category("actions");
class CrmDashboard extends Component {
   setup() {
         super.setup()
         this.orm = useService('orm')
         this._fetch_data()
   }
   _fetch_data(){
   var self = this;
  this.orm.call("crm.lead", "get_tiles_data", [], {}).then(function(result){
           $('#my_lead').append('<span>' + result.total_leads + '</span>');
           $('#my_opportunity').append('<span>' + result.total_opportunity + '</span>');
           $('#revenue').append('<span>' + result.currency + result.expected_revenue + '</span>');
           });
       };
}
CrmDashboard.template = "my_module.CrmDashboard";
//  Tag name that we entered in the first step.
actionRegistry.add("crm_dashboard_tag", CrmDashboard);
As you can see, the function get_tiles_data() is used to get the data from the model ‘crm.lead’.The code will be like this:
class CrmLead(models.Model):
    """crm inherited model"""
    _inherit = 'crm.lead'
    @api.model
    def get_tiles_data(self):
        """ Return the tile data"""
        company_id = self.env.company
        leads = self.search([('company_id', '=', company_id.id),
                             ('user_id', '=', self.env.user.id)])
        my_leads = leads.filtered(lambda r: r.type == 'lead')
        my_opportunity = leads.filtered(lambda r: r.type == 'opportunity')
        currency = company_id.currency_id.symbol
        expected_revenue = sum(my_opportunity.mapped('expected_revenue'))
        return {
            'total_leads': len(my_leads),
            'total_opportunity': len(my_opportunity),
            'expected_revenue': expected_revenue,
            'currency': currency,
        }
The decorator @api.model is used to declare the function. After doing this, the view will display the tiles we created.

You can use personalized designs and styles here if you want to. However, this is a simple dashboard, we can customize it with other graphical displays and additions based on our needs.