One can critically evaluate how the firm is performing in all areas of the organization through business reporting. Thorough reports offer a better understanding that enables top managers and business owners to make knowledgeable decisions based on pertinent facts. Any organization needs business reports, regardless of its size or sector. Legal requirements for some company reporting, such as financial reporting as mandated by the controlling authorities, apply. Systematic business monitoring and reporting, on the other hand, are critical for providing frequent updates to management and interested stakeholders.
Reporting in Odoo 16 Recruitment Module
The process of Reporting includes Assembling accurate information, Examining data from particular fields (such as sales, finance, operations, etc.), Analysis, Making Conclusions, and Recommendations. The report's final outcome can offer a justification for why a problem occurred, point out performance hiccups, and suggest an appropriate course of action to deal with the problems at hand.
The Reporting Facility available in the Odoo 16 Recruitment Module provides the analytical report based on each and every Recruitments, Job Post, Job Application,

The” Recruitment Module” contains four types of Reporting menu Items such as "Recruitment Analysis," "Source Analysis," "Time in Stage Analysis," and "Team Performance." Let us go through them in depth.
Recruitment Analysis
You can evaluate a company's recruiting procedures using the "Recruitment Analysis" Reporting option from the Reporting page. The source data and applicant totals are displayed in the recruiting analysis graph. You are able to independently analyze the recruited and in-progress data in an organization's recruitment report.
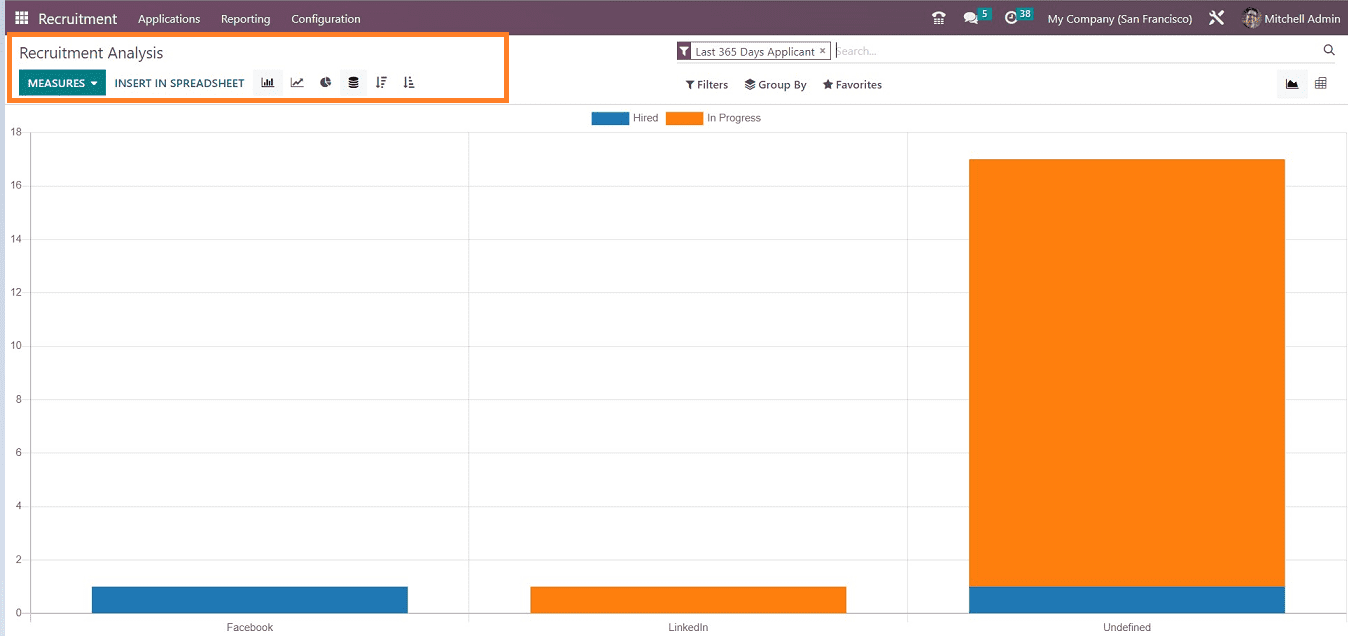
We can change values to the graph, such as “Applicant,” “Has Referrer,” “Refused,” “Count,” and more, by selecting the “MEASURES” button.

Filter and sort relevant data based on the options given in the “Filter,” “Group By,” and “Favorites” options. The "Filter" option also allows you to construct customized filters using the "Add Custom Filter" option, as seen below.

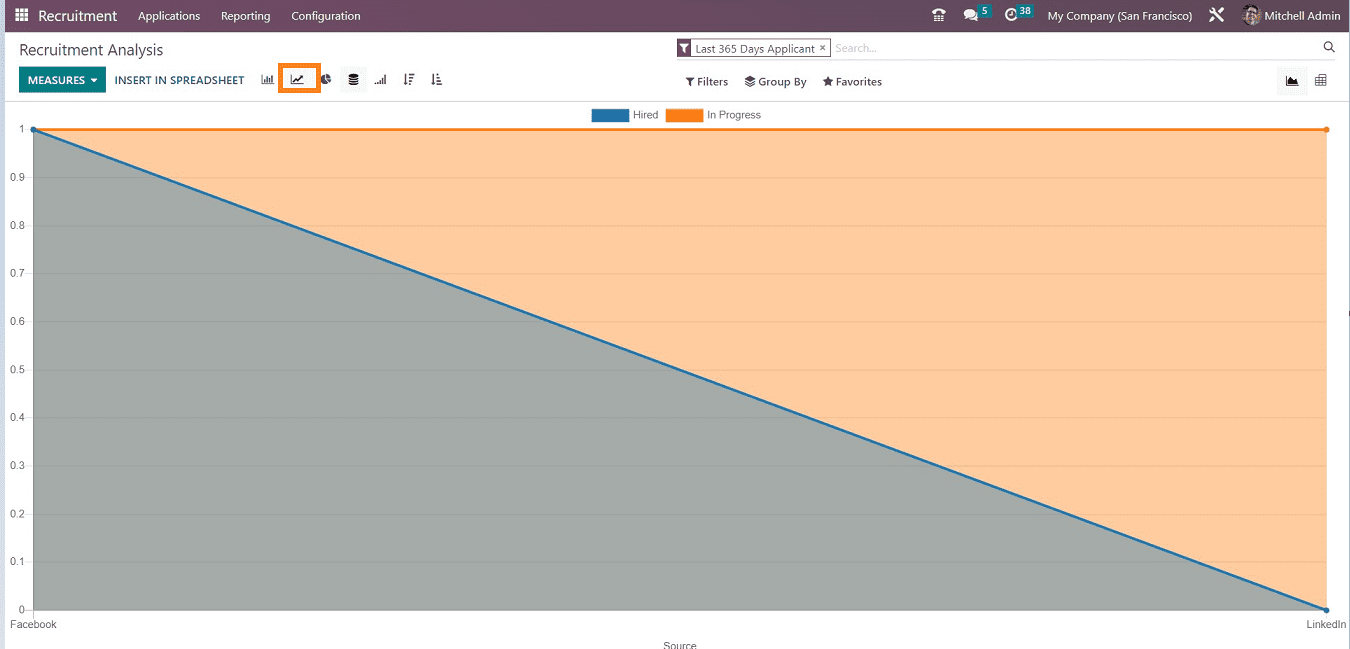
Users can change the Bar Chart view into different visualization modes by clicking on the various icons provided in the upper part of the page, such as Line Chart, Pie Chart, Stacked View, Descending View, Ascending View, and more. For an example, check out the report’s Line Chart view from the screenshot shown below.
Source Analysis
Users can investigate the beginnings of each employment process inside the company using a reporting tool. A graphical representation shows when the user chooses the Source Analysis option on the Reporting tab. On this graphical view, visitors can view the application count and source data.
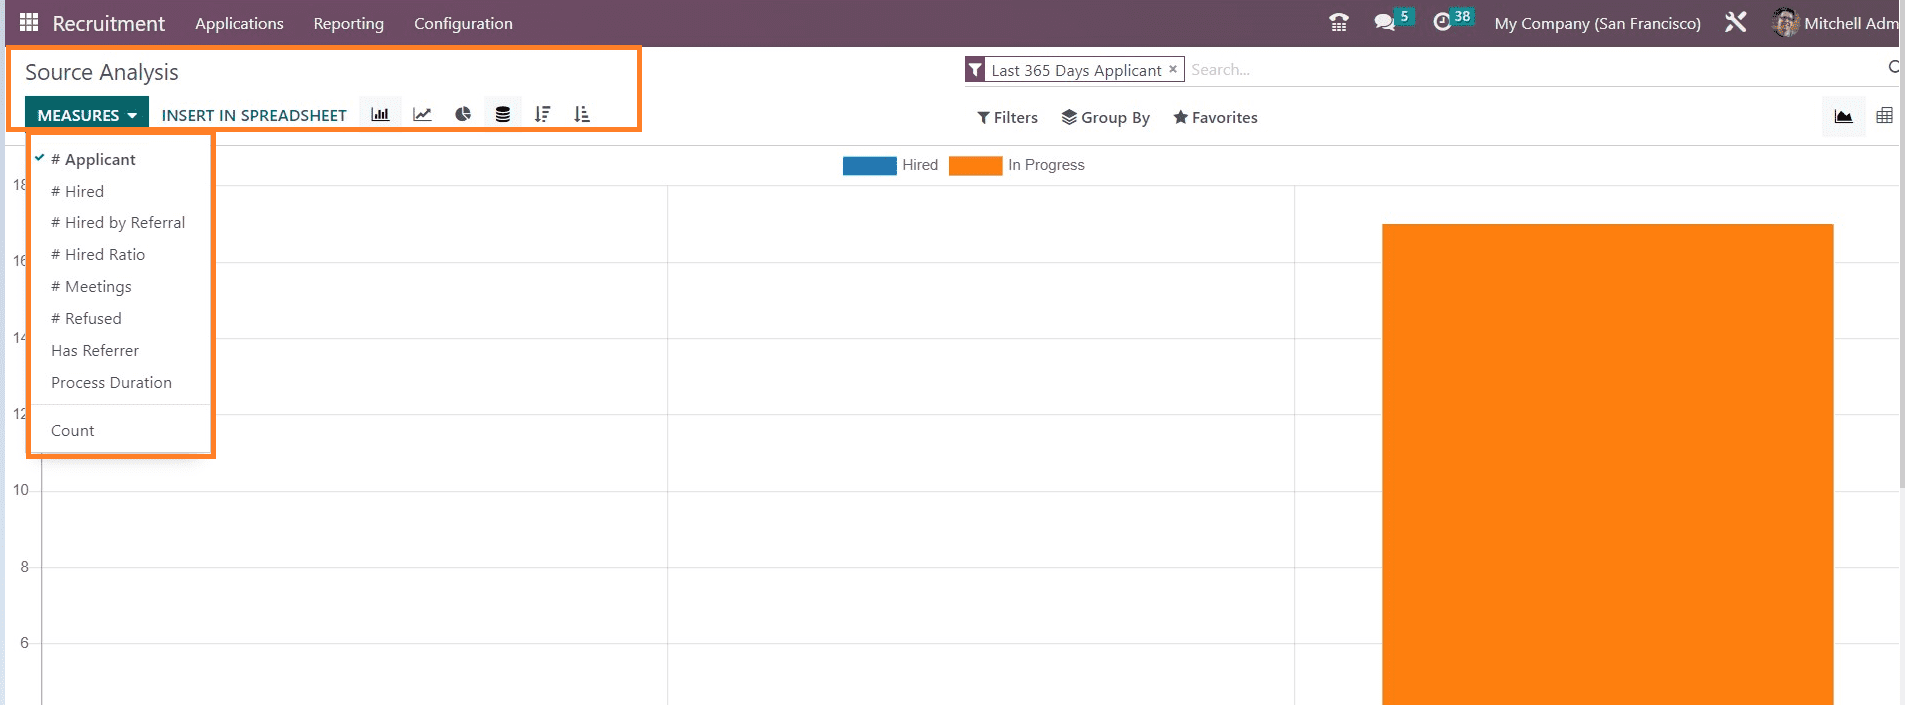
By clicking on the icons in the page's header, users can switch between several visualization modes for the Bar Chart view. Users can also modify the graphical settings to suit their needs by choosing an option from the "MEASURES" dropdown menu. Also, you can avail of the sorting and filtering options from the “Filter,” “Group By,” and “Favorites” options. We can group the report data based on State, Job Position, Applicant’s Name, Source, etc. it is also possible to create a custom “Group By” filter using the “Add a Custom Group” option available, as shown in the screenshot below, under the "Group By" column.

Time in Stage Analysis
Using the "Time in Stage Analysis" option in "Reporting," users may evaluate the stages of each applicant recruitment process. The Pivot view of the Stage Analysis window shows the aggregate count of each stage depending on each job position. users of the pivot table can gain the total number of days invested in each phase of the "Original Qualification,” "First Interview," “Alternate Interview," and "Contract Offer."

The "MEASURES" option allows you to modify the report's Parameters. The "INSERT IN SPREADSHEET" button and the" Flip Axis" icon allow us to input spreadsheets and switch the report display axis independently. Use the "Expand" button to widen the display and the "Download" icon to get the xl file.
Odoo provides “Filter,” “Grop By,” and “Favorites.” options in each reporting section. The ‘Favorite” section options include “Save Current Search,” “Insert View in Article,” etc. You can check the Flipped Axis view and the “Favorites” options of the report from the screenshot below.

Team Performance
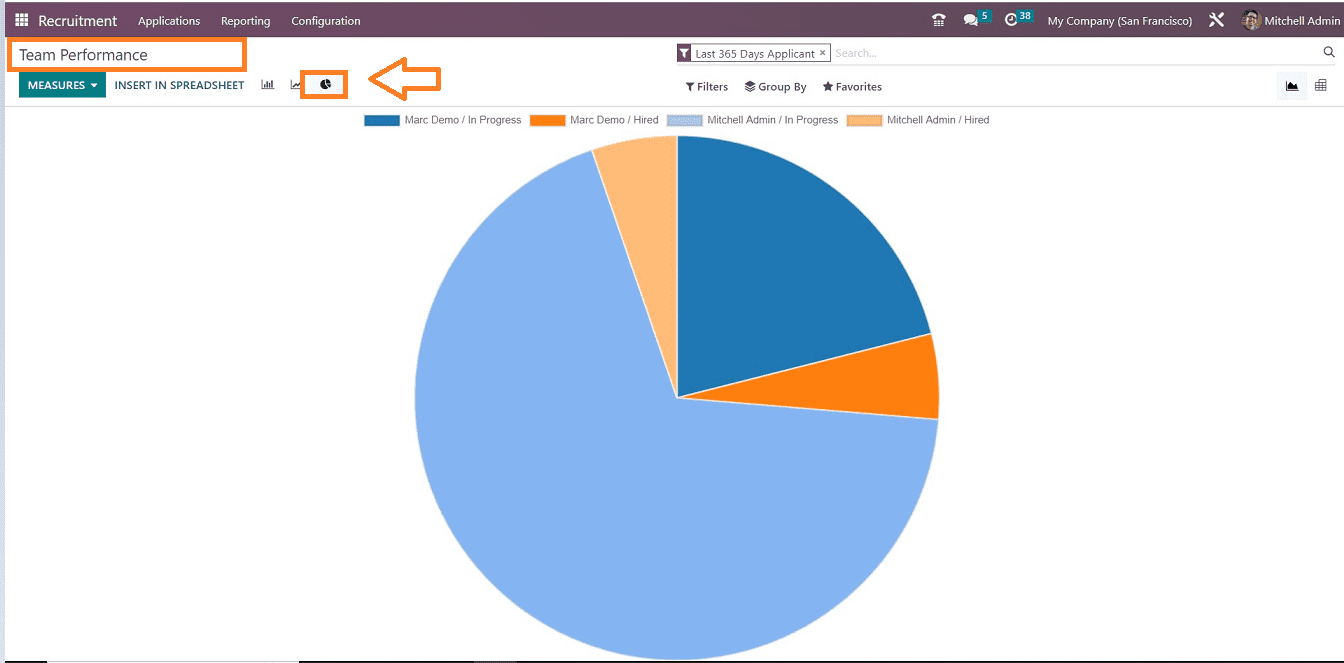
This Reporting tool in Odoo 16 can be used to analyze the performance of each team in an organization. The Recruiter data is shown on the X-axis, and the Count is shown on the Y-axis in the graph view. The "MEASURES" option allows you to categorize the team's performance based on parameters such as "Number of Applicants," "Hired," "Hired By Referral," "Hired Ratio," etc.
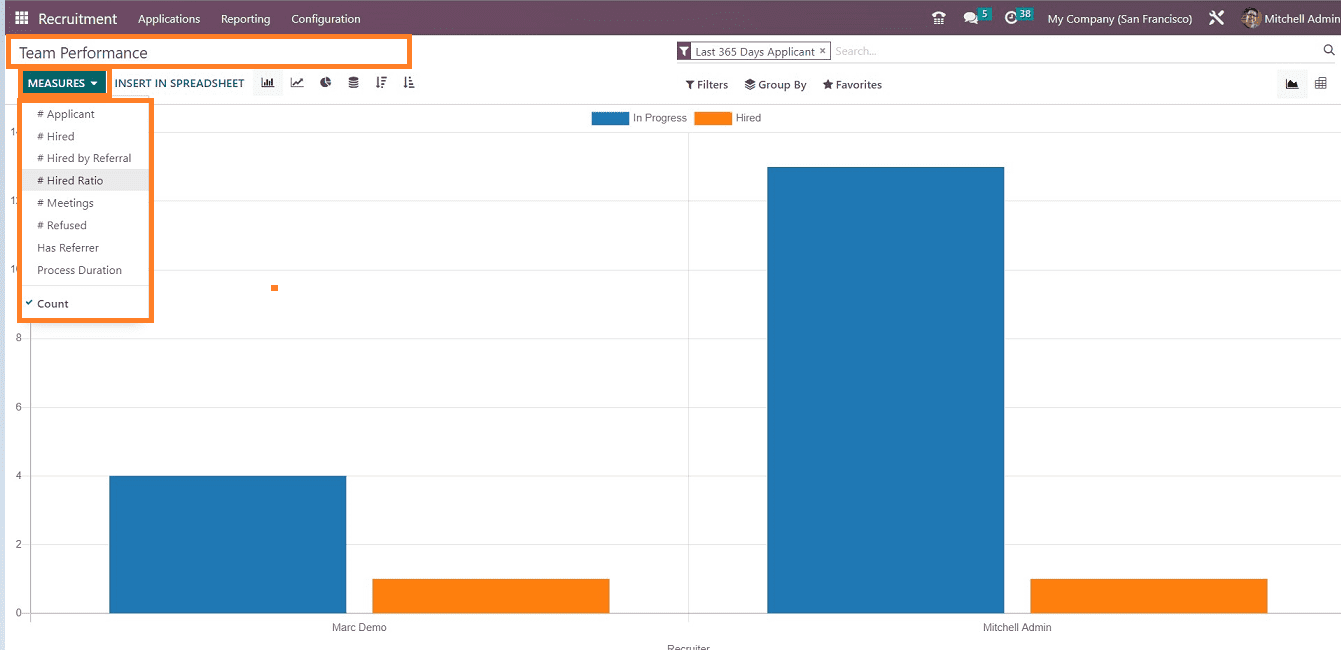
You can use the various sort and filtering options from the “Filter,” “Group By,” and “ Favorites” sections. Odoo also gives access to create customized filters and groups using the “Add Custom Filter” and “Add Custom Group” options available under the respective fields. Check out the options in the "Filters" area, as seen in the screenshot below.

Odoo includes several visual representation methods In all of the Reporting sections that can be used to change the Bar chart view into a Graphical, Line Chart, Stacked View, Pie Chart, Ascending Chart, Descending Chart, and so on. Users can select their report view by clicking on the icons located in the upper left and right corners of each "Reporting" page.
You can check the pie chart view of the “Team Performance” performance Reporting from the screenshot below.
These are the features available in the “Reporting” menu. We have covered the reporting options in the Odoo 16 Recruitment Module Interface in this article. We believe you've got an adequate comprehension of the Reporting section.
Instead of only highlighting the problems, reporting is utilized to assist choices, pinpoint effective tactics, and address weaknesses and possibilities for growth.