In the dynamic world of data analytics, Microsoft's Power BI stands out as a powerful tool for transforming raw data into insightful visualizations. One of the key features that sets Power BI apart is its ability to accommodate custom visualizations, allowing users to go beyond the standard chart types and create tailored displays that suit their specific needs. In this blog, we will explore the realm of Power BI custom visualizations and delve into different types of visualizations that can be employed to extract meaningful insights.
The Power of Custom Visualizations:
Power BI's custom visualizations offer a gateway to a world of creativity and flexibility in data representation. Users can choose from a wide range of visuals created by the Power BI community or build their own using developer tools. Custom visuals enable users to present data in ways that align with their unique business requirements, ensuring a more compelling and personalized data storytelling experience.
Types of Custom Visualizations:
R and Python Visuals:
Power BI seamlessly integrates with R and Python, enabling users to leverage advanced statistical and machine learning models. Custom visuals created using R or Python scripts can provide sophisticated analyses, predictive modeling, and data clustering, enhancing the depth of insights derived from the data.
Table and Matrix Visuals:
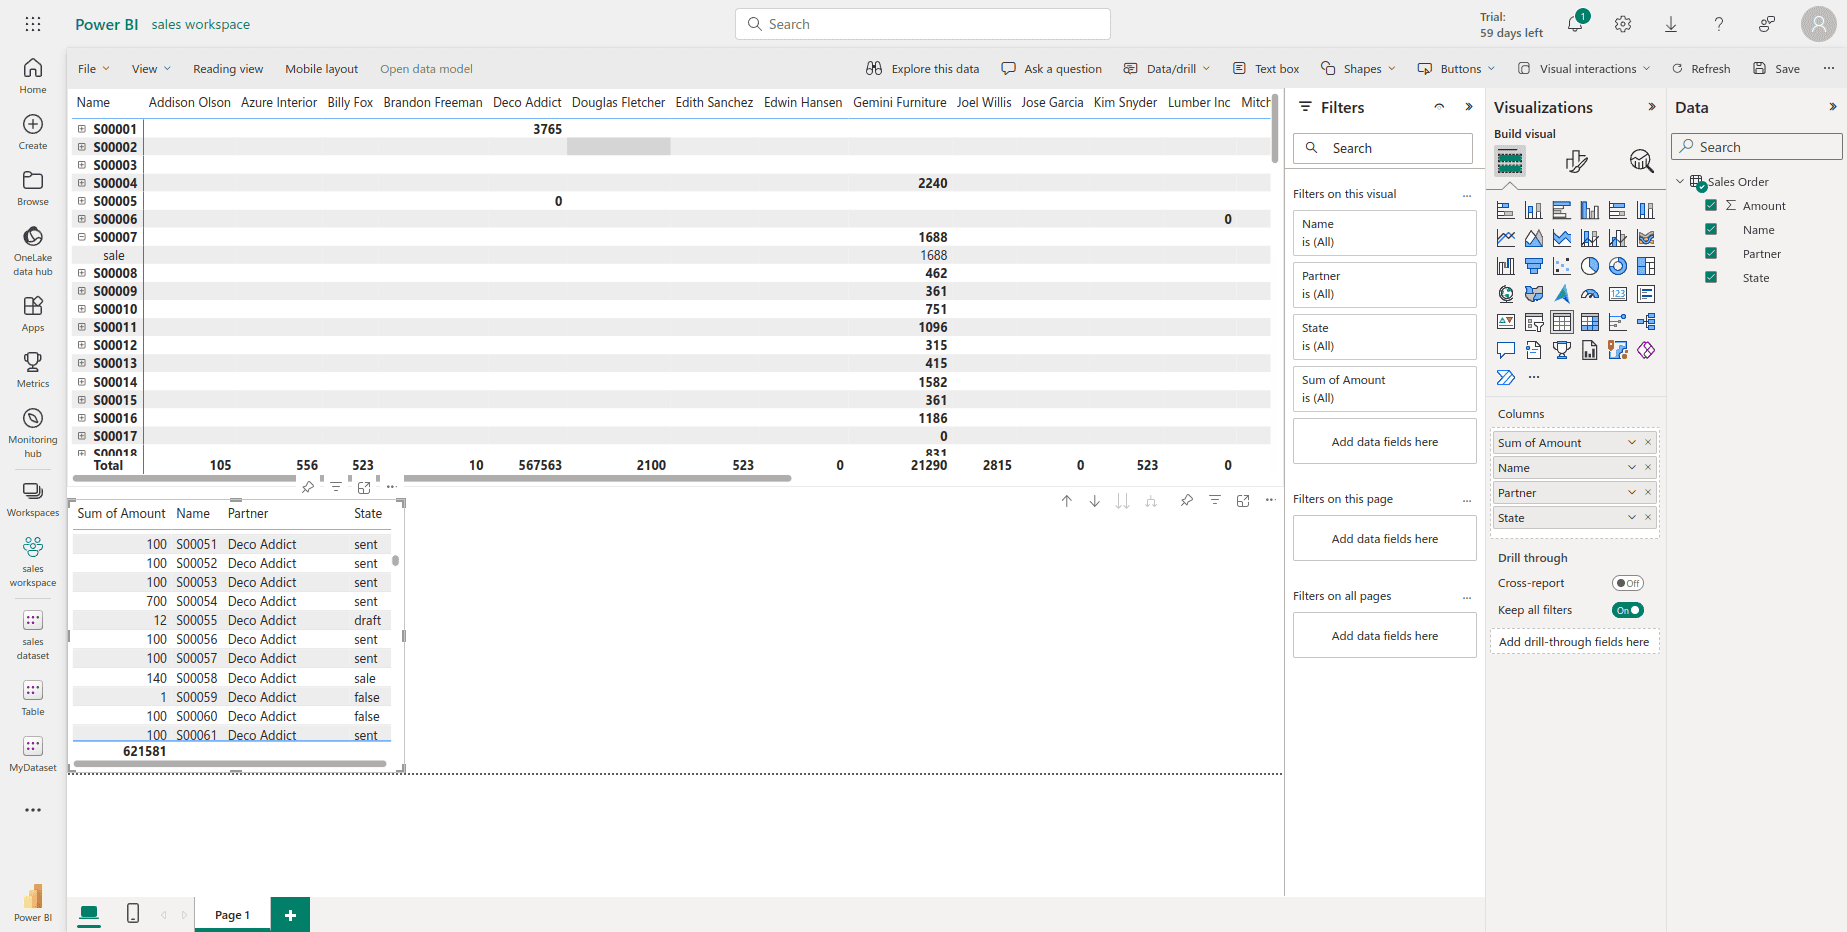
While Power BI offers standard table and matrix visuals, custom visuals in this category can provide additional customization options. Users can design tables and matrices that suit their branding and even embed interactive features for enhanced user engagement.

Map Visualizations:
Custom map visuals go beyond basic geospatial representation. They allow users to integrate location-based data with intricate maps, presenting insights in a visually appealing and informative manner. Users can customize color schemes, and tooltips, and even incorporate 3D map visuals for a more immersive experience.
Timeline Visuals:
Timelines are crucial for tracking and visualizing data trends over time. Custom timeline visuals offer more flexibility in terms of formatting, allowing users to create visually stunning representations of chronological data. This can be particularly useful for showcasing historical trends or project timelines.
Gauge and KPI Visuals:
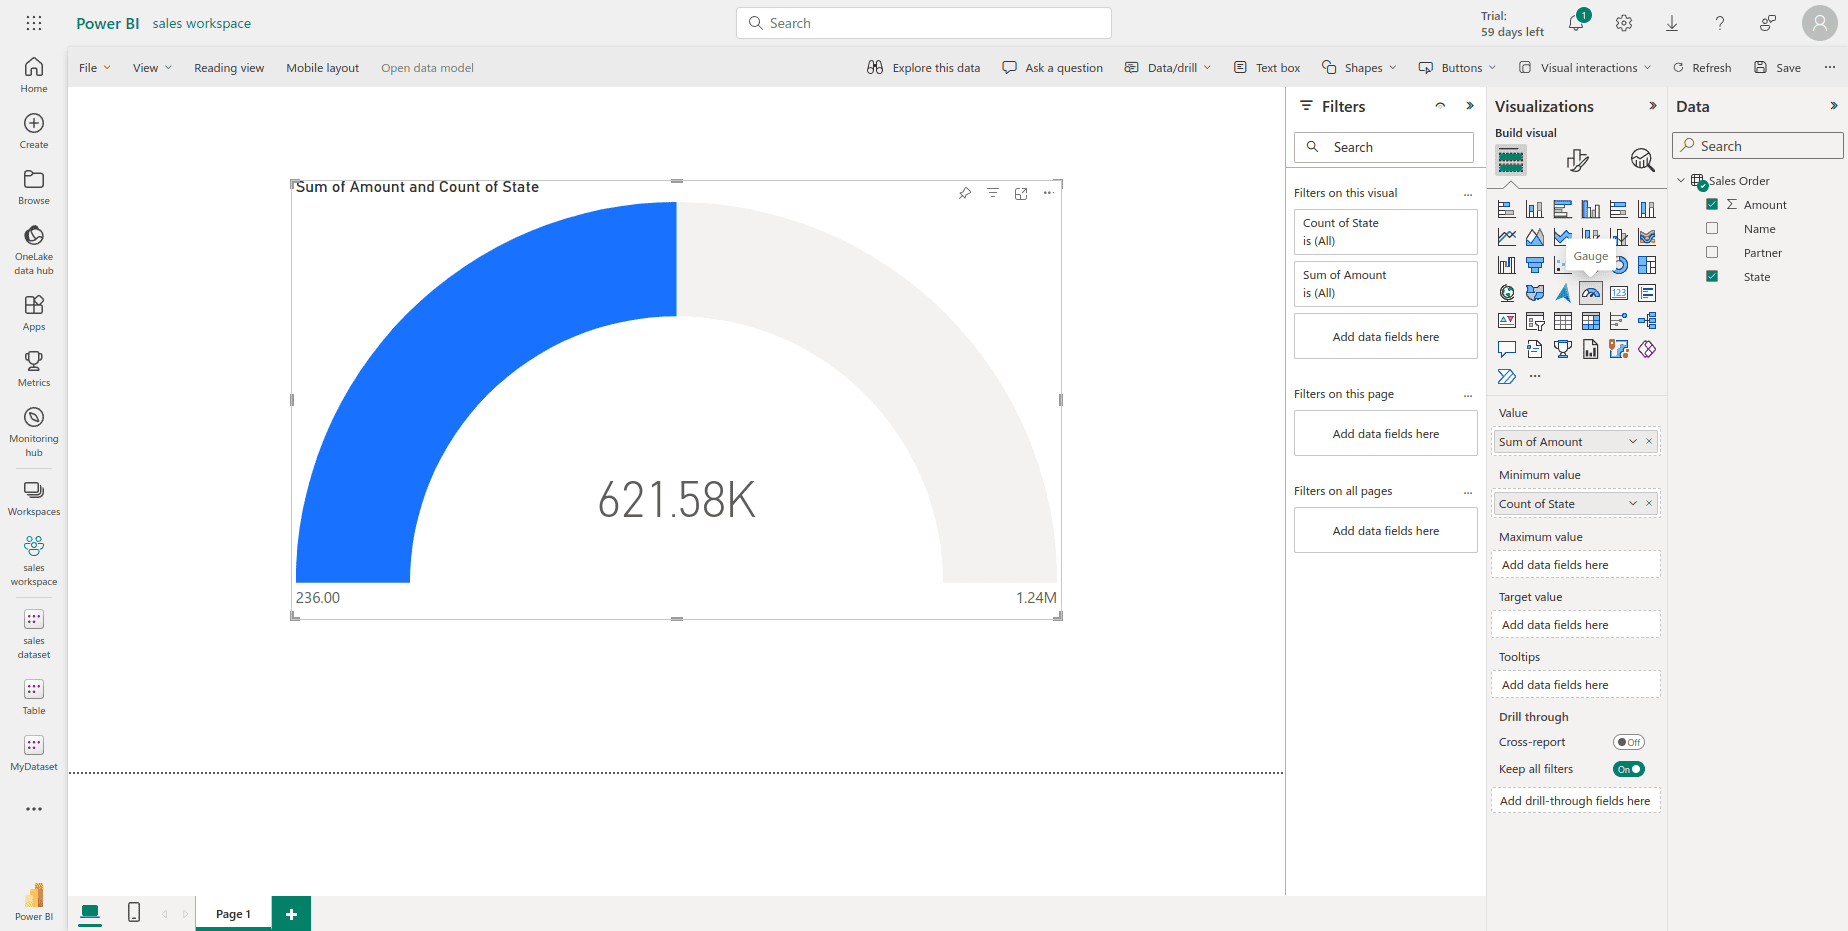
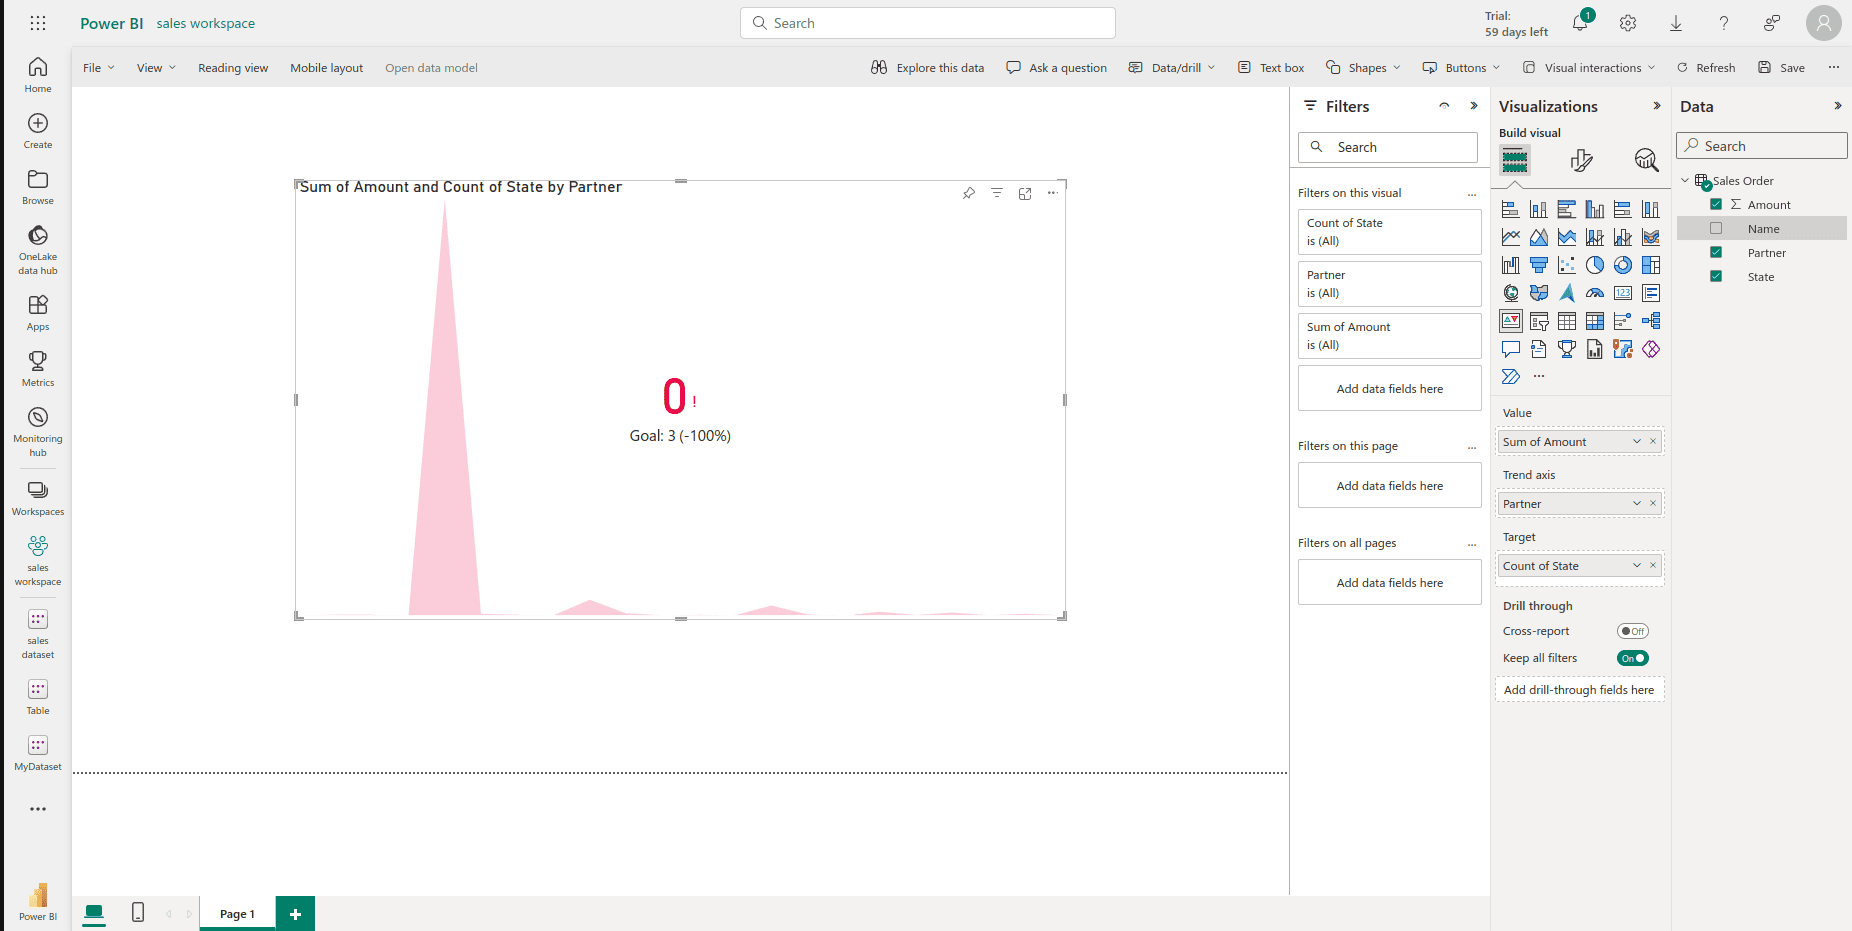
Key Performance Indicators (KPIs) are essential for monitoring business performance. Custom gauge visuals provide a more diverse set of options for representing KPIs, allowing users to create radial gauges, linear gauges, and other visually impactful displays that convey the status of metrics effectively.

Kpi Visuals:-

Hierarchical Visuals:
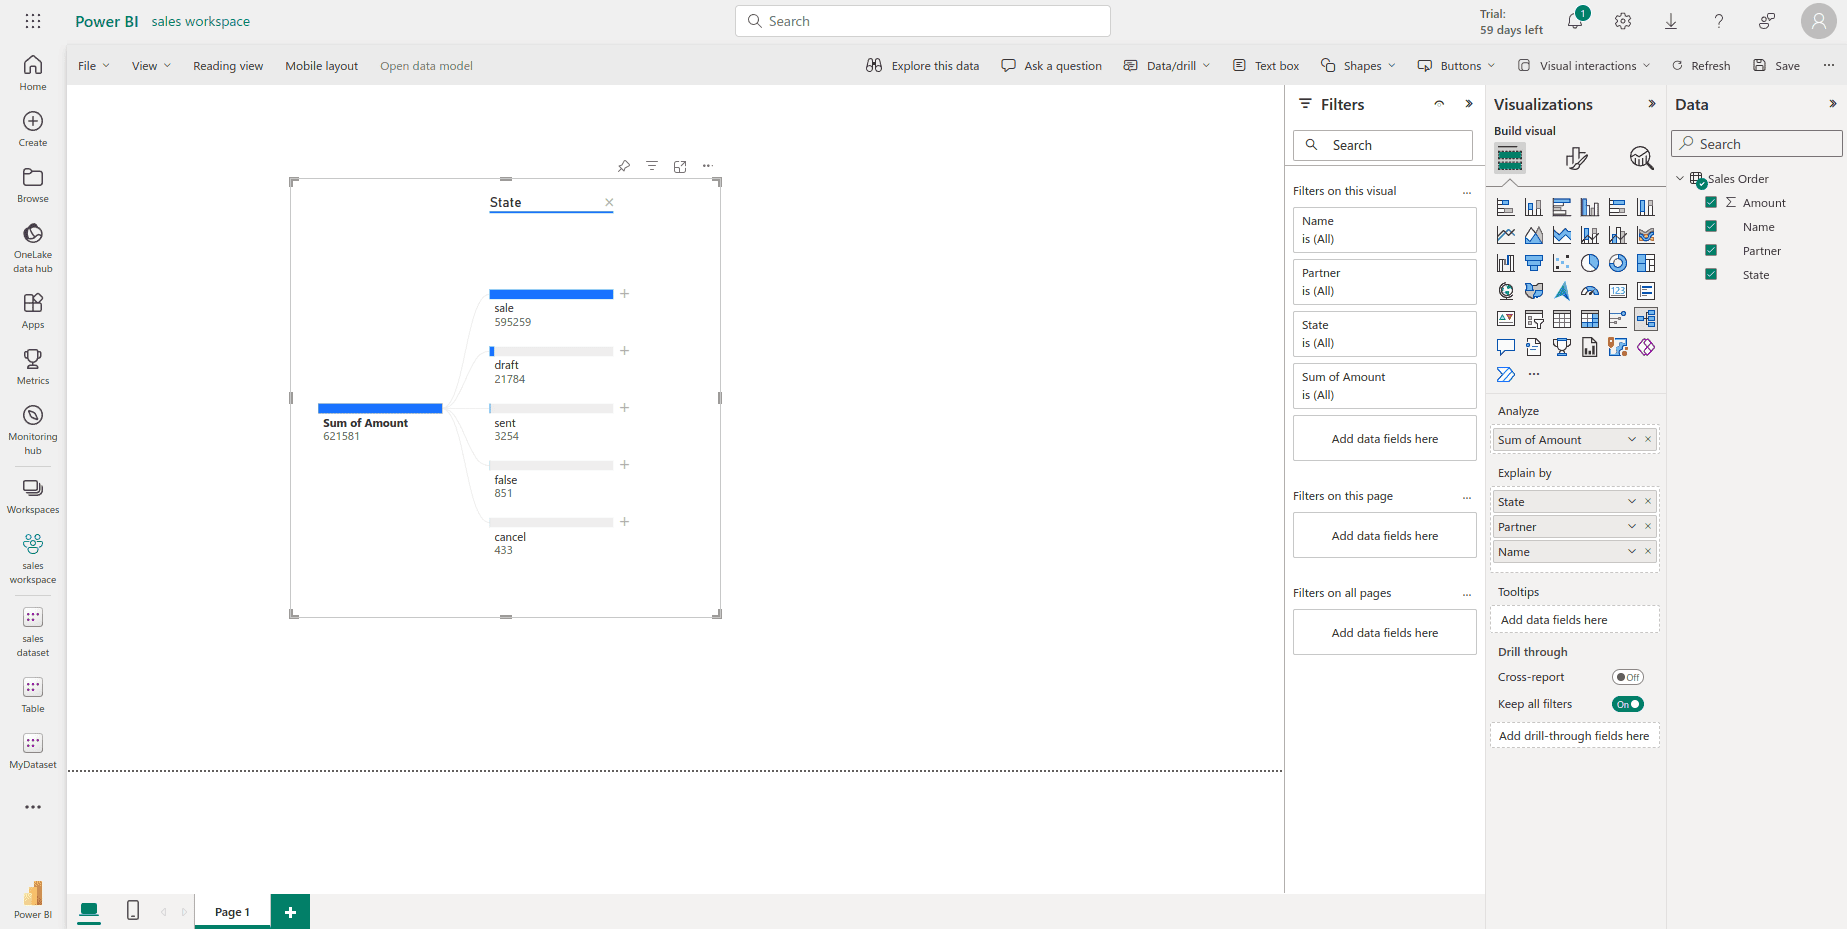
Custom visuals in this category are designed for presenting hierarchical data structures. Users can build visually appealing treemaps, sunbursts, or custom hierarchy visuals that offer a deeper understanding of complex relationships within the data.

Power BI's custom visualizations empower users to transcend the limitations of standard visuals and create a tailored analytics experience. Whether leveraging advanced statistical models, enhancing geographic representations, or presenting hierarchical structures, the diverse range of custom visuals available in Power BI ensures that data is not just analyzed but also communicated in a visually compelling and meaningful way. As organizations continue to explore the vast possibilities within the realm of custom visualizations, Power BI remains at the forefront of empowering data-driven decision-making.
To read more about the top 5 key features of Power BI, refer to our blog Top 5 Key Features of Power BI in 2024