Odoo 18 is a robust and versatile open-source ERP system designed to streamline business operations across various domains, including Accounting, Sales, Inventory, and HR. This latest version enhances user experience with a modern interface, improved performance, and automation, making it an adaptable solution for businesses of all sizes. One of its standout features is its ability to generate real-time reports and analytics, enabling businesses to make well-informed decisions based on accurate data.
Odoo 18 offers an enhanced Pivot View, allowing users to efficiently analyze and summarize large volumes of data. Pivot reports help transform raw information into actionable insights by enabling users to group, filter, and aggregate data in a structured format. While Odoo provides built-in pivot views for many standard modules, advanced users can create custom reports using SQL queries. This approach is particularly beneficial for generating complex reports, such as financial summaries, sales performance tracking, or vendor bill analysis. By integrating Odoo’s ORM with PostgreSQL views, businesses can build powerful, dynamic reports that are easily accessible within the system.
For example, we will create a Vendor Bill Report that will analyze vendor bills based on key financial metrics. The report will include: Invoice Name, Bill Month, Vendor Name, Purchase Order Name, Total Bills, Total Billed Amount, Total Paid Amount, Total Unpaid Amount, Company, Salesperson, Journal, and Invoice Date.
Creating the Model
Since we are using an SQL view instead of a regular Odoo model, we need to define our model in a way that does not create a database table. We do this by setting _auto = False in the model definition.
Python:
from odoo import models, fields
class VendorBillReport(models.Model):
    _name = 'vendor.bill.report'
    _description = 'Vendor Bill Report'
    _auto = False  # No table creation, uses SQL view
    invoice_name = fields.Char(string="Invoice Name")
    bill_month = fields.Char(string="Bill Month")
    vendor_name = fields.Char(string="Vendor Name")
    purchase_order_name = fields.Char(string="Purchase Order")
    total_bills = fields.Integer(string="Total Bills")
    total_billed = fields.Float(string="Total Billed Amount")
    total_paid = fields.Float(string="Total Paid")
    total_unpaid = fields.Float(string="Total Unpaid")
    company_id = fields.Many2one('res.company', string="Company")
    sale_person_id = fields.Many2one('res.users', string="Salesperson")
    journal_id = fields.Many2one('account.journal', string="Journal")
    invoice_date = fields.Date(string="Invoice Date")
Creating the SQL View
Odoo allows us to define an SQL view using the init() method. This method executes raw SQL to create a view that retrieves the required data.
Python:
   def init(self):
        """
        Creates or replaces the SQL view for the Vendor Bill Report Pivot table.
        This view aggregates data from account moves to provide a summary of
        vendor bills based on bill month, vendor, purchase orders, and payment status.
        """
        self.env.cr.execute("""
            CREATE OR REPLACE VIEW vendor_bill_report AS (
                SELECT
                    row_number() OVER() AS id,
                    am.name AS invoice_name,
                    TO_CHAR(am.invoice_date, 'YYYY-MM') AS bill_month,
                    rp.name AS vendor_name,
                    COALESCE(po.name, 'No Purchase Order') AS purchase_order_name,
                    COUNT(DISTINCT am.id) AS total_bills,
                    SUM(am.amount_total) AS total_billed,
                    SUM(CASE WHEN am.payment_state = 'paid' THEN am.amount_total ELSE 0 END) AS total_paid,
                    SUM(CASE WHEN am.payment_state = 'not_paid' THEN am.amount_total ELSE 0 END) AS total_unpaid,
                    am.company_id,
                    am.invoice_user_id AS sale_person_id,
                    am.journal_id,
                    am.invoice_date
                FROM
                    account_move am
                JOIN
                    res_partner rp ON am.partner_id = rp.id
                LEFT JOIN
                    account_move_line aml ON aml.move_id = am.id
                LEFT JOIN
                    purchase_order_line pol ON aml.purchase_line_id = pol.id
                LEFT JOIN
                    purchase_order po ON pol.order_id = po.id
                WHERE
                    am.move_type = 'in_invoice'  -- Only vendor bills
                    AND am.state = 'posted'      -- Only posted invoices
                GROUP BY
                    am.name, bill_month, rp.name, po.name,
                    am.company_id, am.invoice_user_id, am.journal_id, am.invoice_date
                ORDER BY
                    bill_month DESC, total_billed DESC
            );
        """)
Creating the Pivot View XML
Now, we need to define the pivot view in an XML file. The pivot view will structure the report dynamically, allowing users to analyze data in different dimensions.
xml:
<?xml version="1.0" encoding="utf-8"?>
<odoo>

    <record id="vendor_bill_report_pivot_view" model="ir.ui.view">
        <field name="name">vendor.bill.report.pivot</field>
        <field name="model">vendor.bill.report</field>
        <field name="arch" type="xml">
            <pivot string="Vendor Bills Analysis">
                <field name="invoice_name" type="row"/>
                <field name="vendor_name" type="col"/>
                <field name="total_billed" type="measure"/>
                <field name="total_paid" type="measure"/>
                <field name="total_unpaid" type="measure"/>
            </pivot>
        </field>
    </record>

    <record id="vendor_bill_report_action" model="ir.actions.act_window">
        <field name="name">Vendor Bills Report</field>
        <field name="res_model">vendor.bill.report</field>
        <field name="view_mode">pivot</field>
    </record>
    <menuitem id="menu_vendor_bill_report"
              name="Vendor Bills Report"
              parent="account.account_reports_management_menu"
              action="vendor_bill_report_action"/>

</odoo>
* type=”row”
<field name="invoice_name" type="row"/>
This means that each row in the pivot table represents a unique invoice.
* type=”col”
<field name="vendor_name" type="col"/>
This means that each column represents a different vendor.
* type=”measure”
<field name="total_billed" type="measure"/>
<field name="total_paid" type="measure"/>
<field name="total_unpaid" type="measure"/>
These are the values aggregated in the pivot table and that are displayed on the measure.
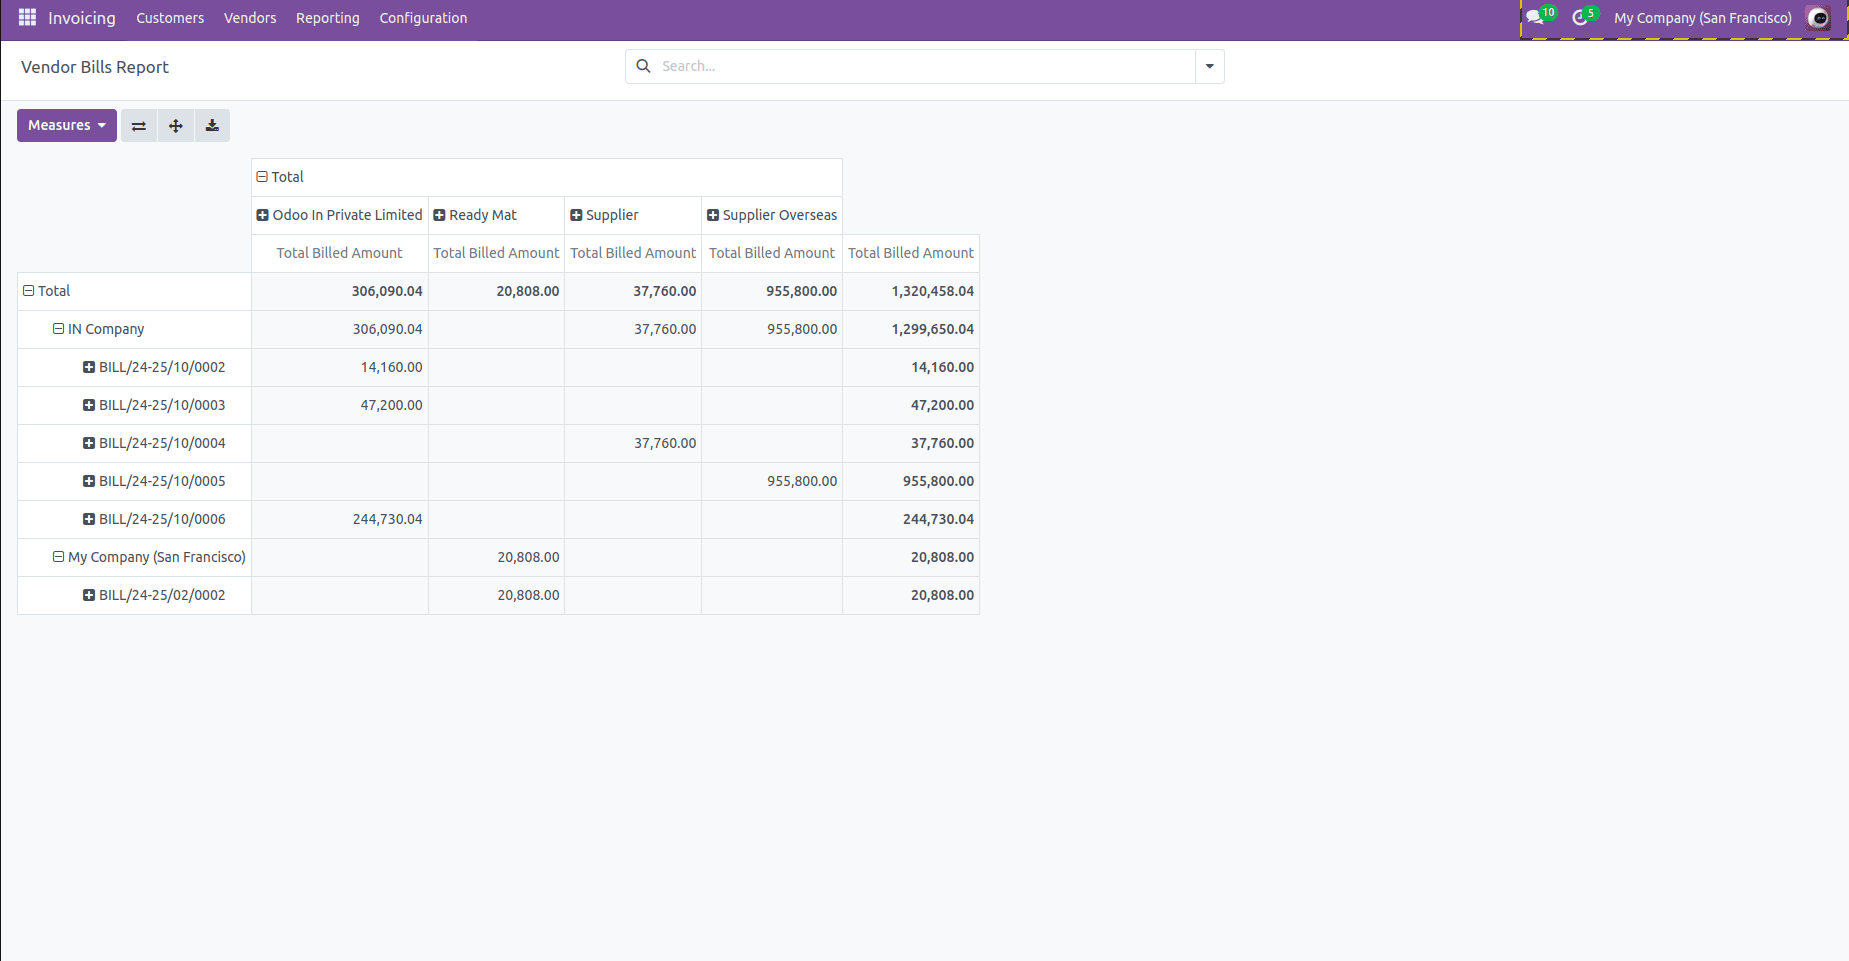
After including these files in the custom module and successfully installing it, a new menu item will appear under Invoicing > Reporting > Vendor Bills Report. Clicking on this menu item will open the pivot report view, where users can analyze vendor bills using dynamic filtering, grouping, and aggregation tools, as shown in the figure.
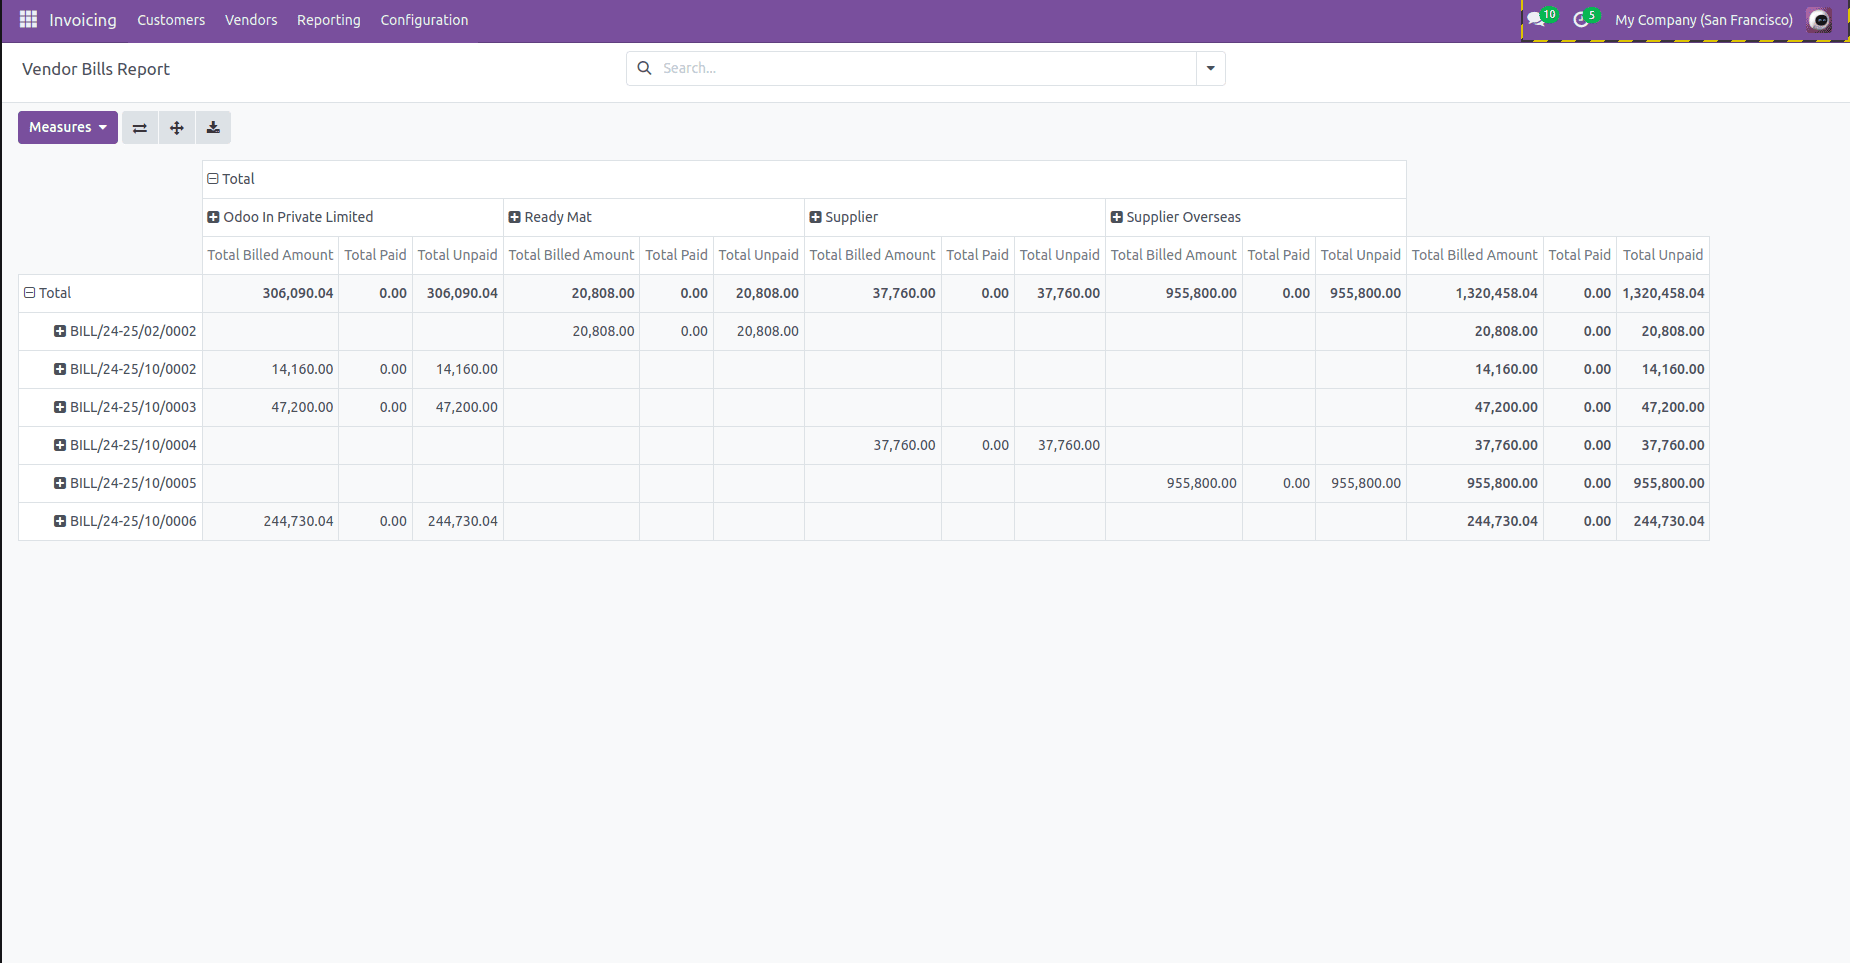
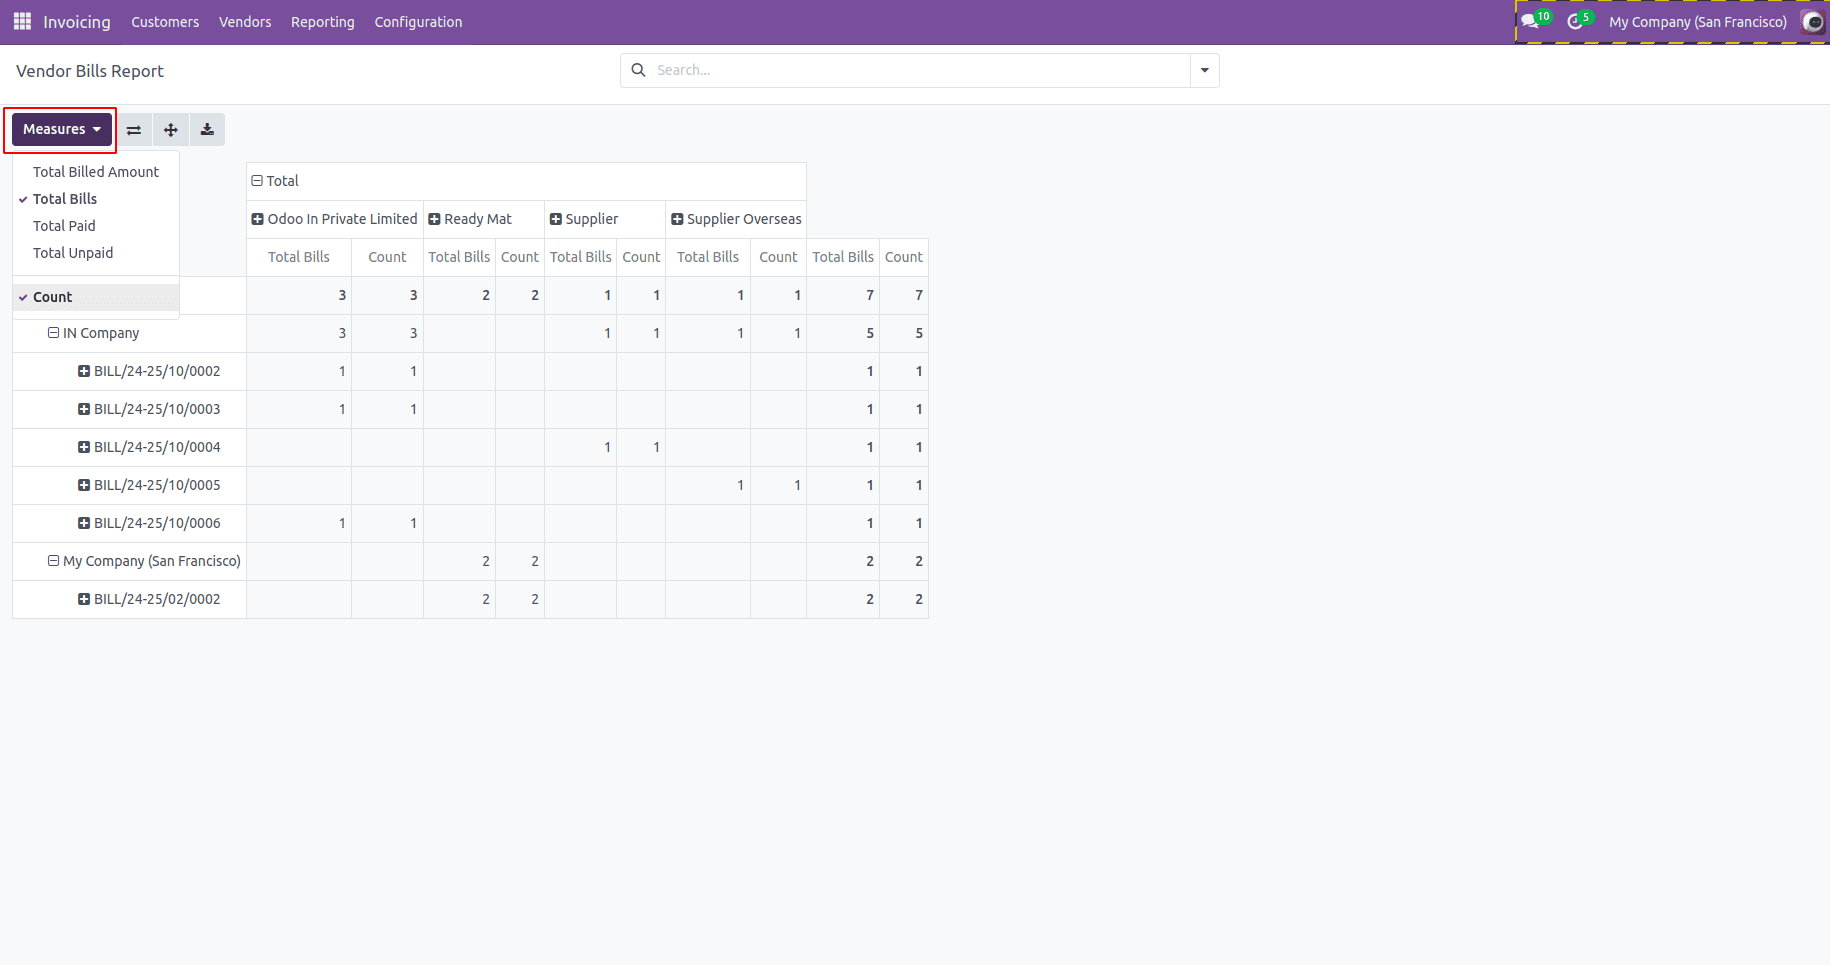
In Odoo's Pivot View, the plus button allows users to dynamically modify and customize the way data is displayed in the pivot table. When users interact with the pivot table, they can add multiple fields as rows or columns, enabling them to perform a more granular analysis of their data as shown below.
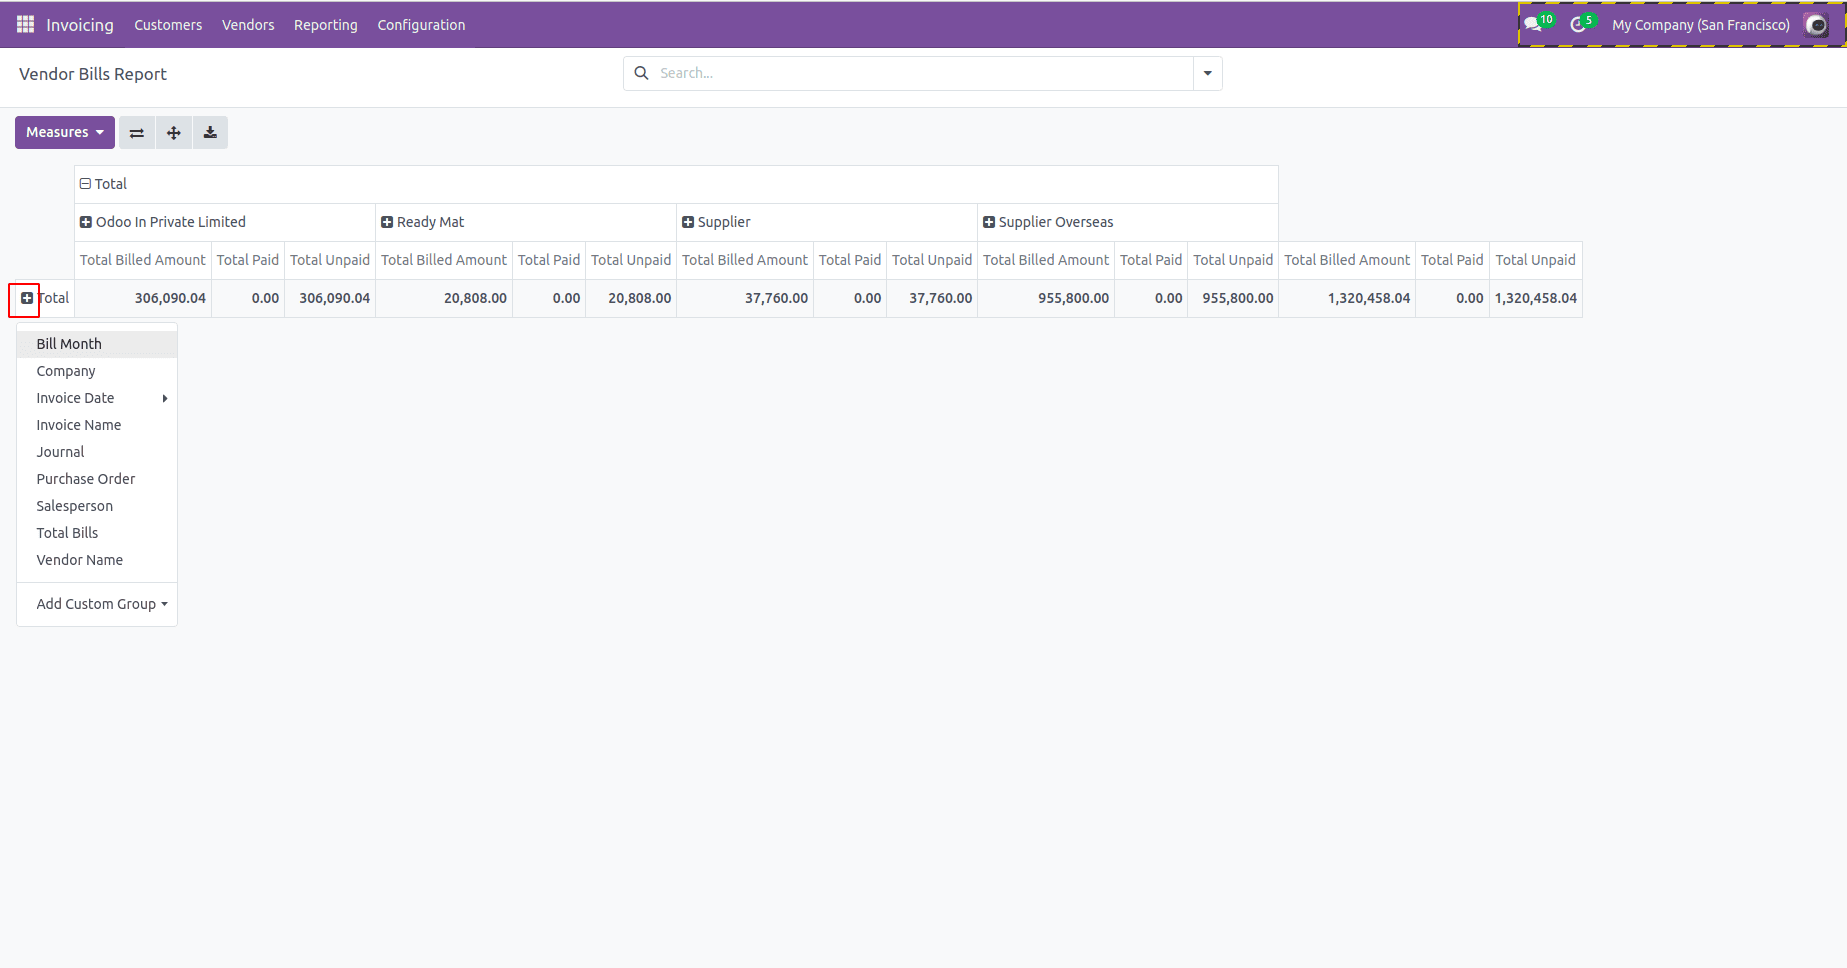
Taking the company as an example, the vendor pivot report based on the company is displayed in the figure.
By clicking the inner plus button on companies, we can select the desired options as shown in the figure below.
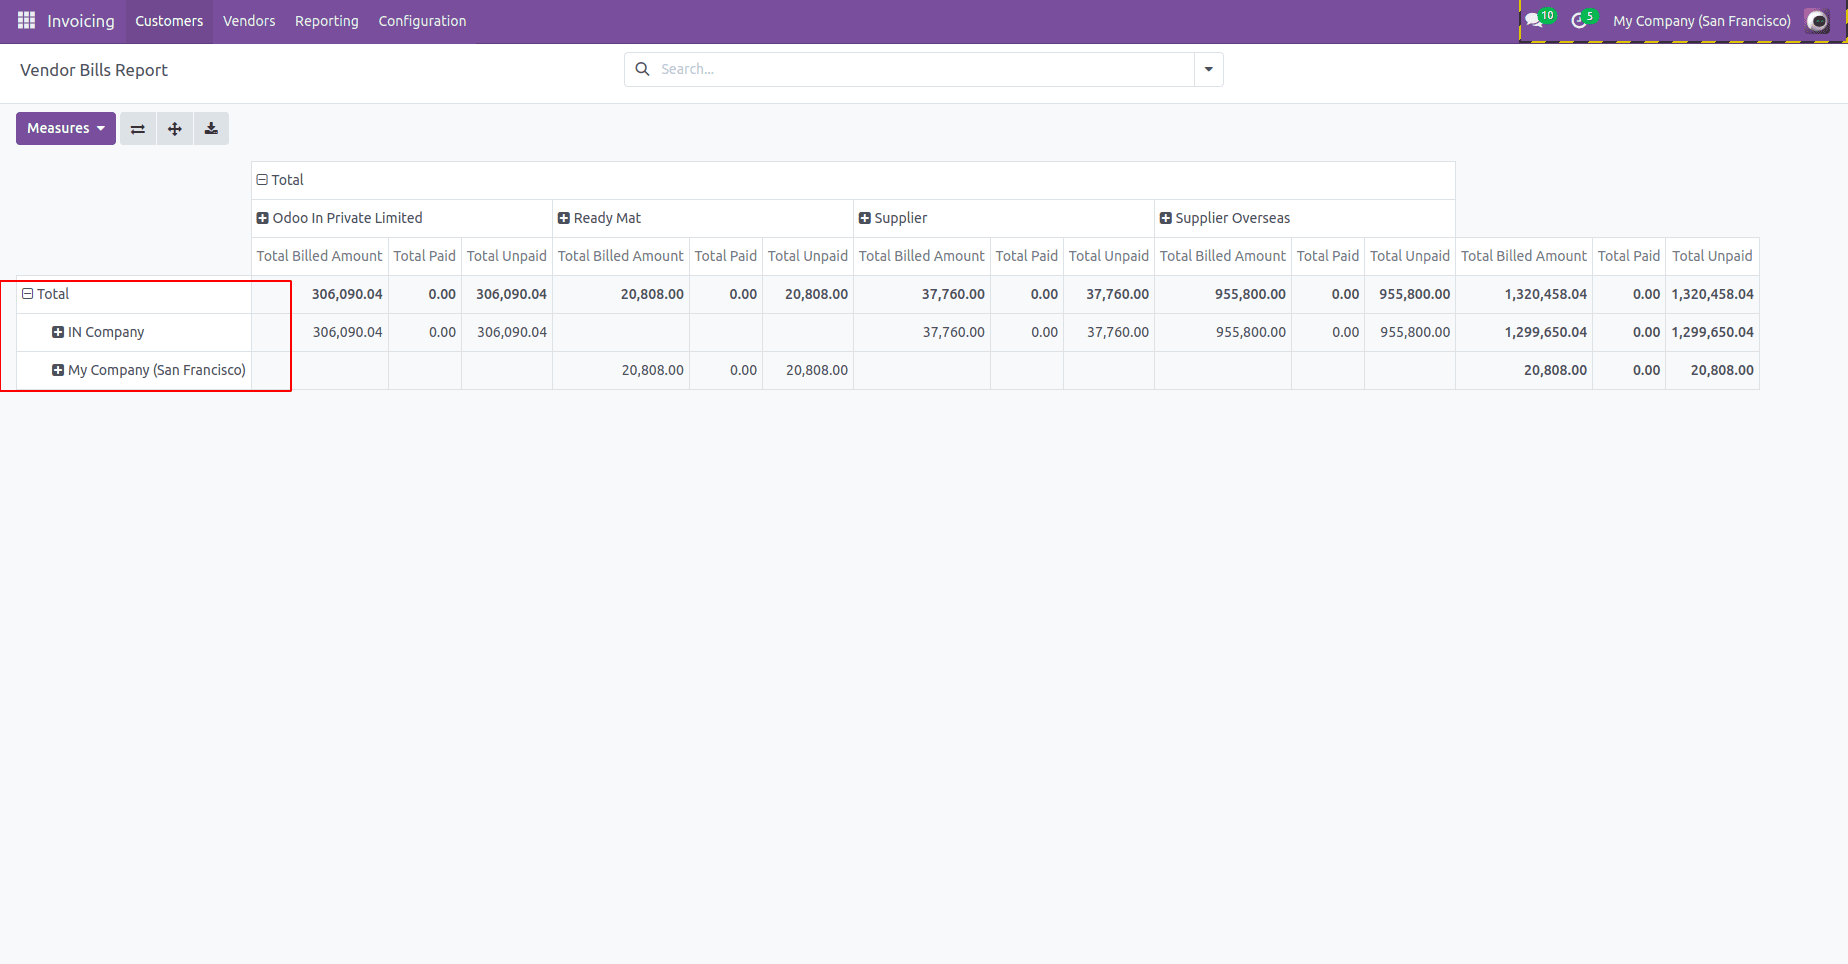
The data will be retrieved by choosing the invoice name, as shown below.
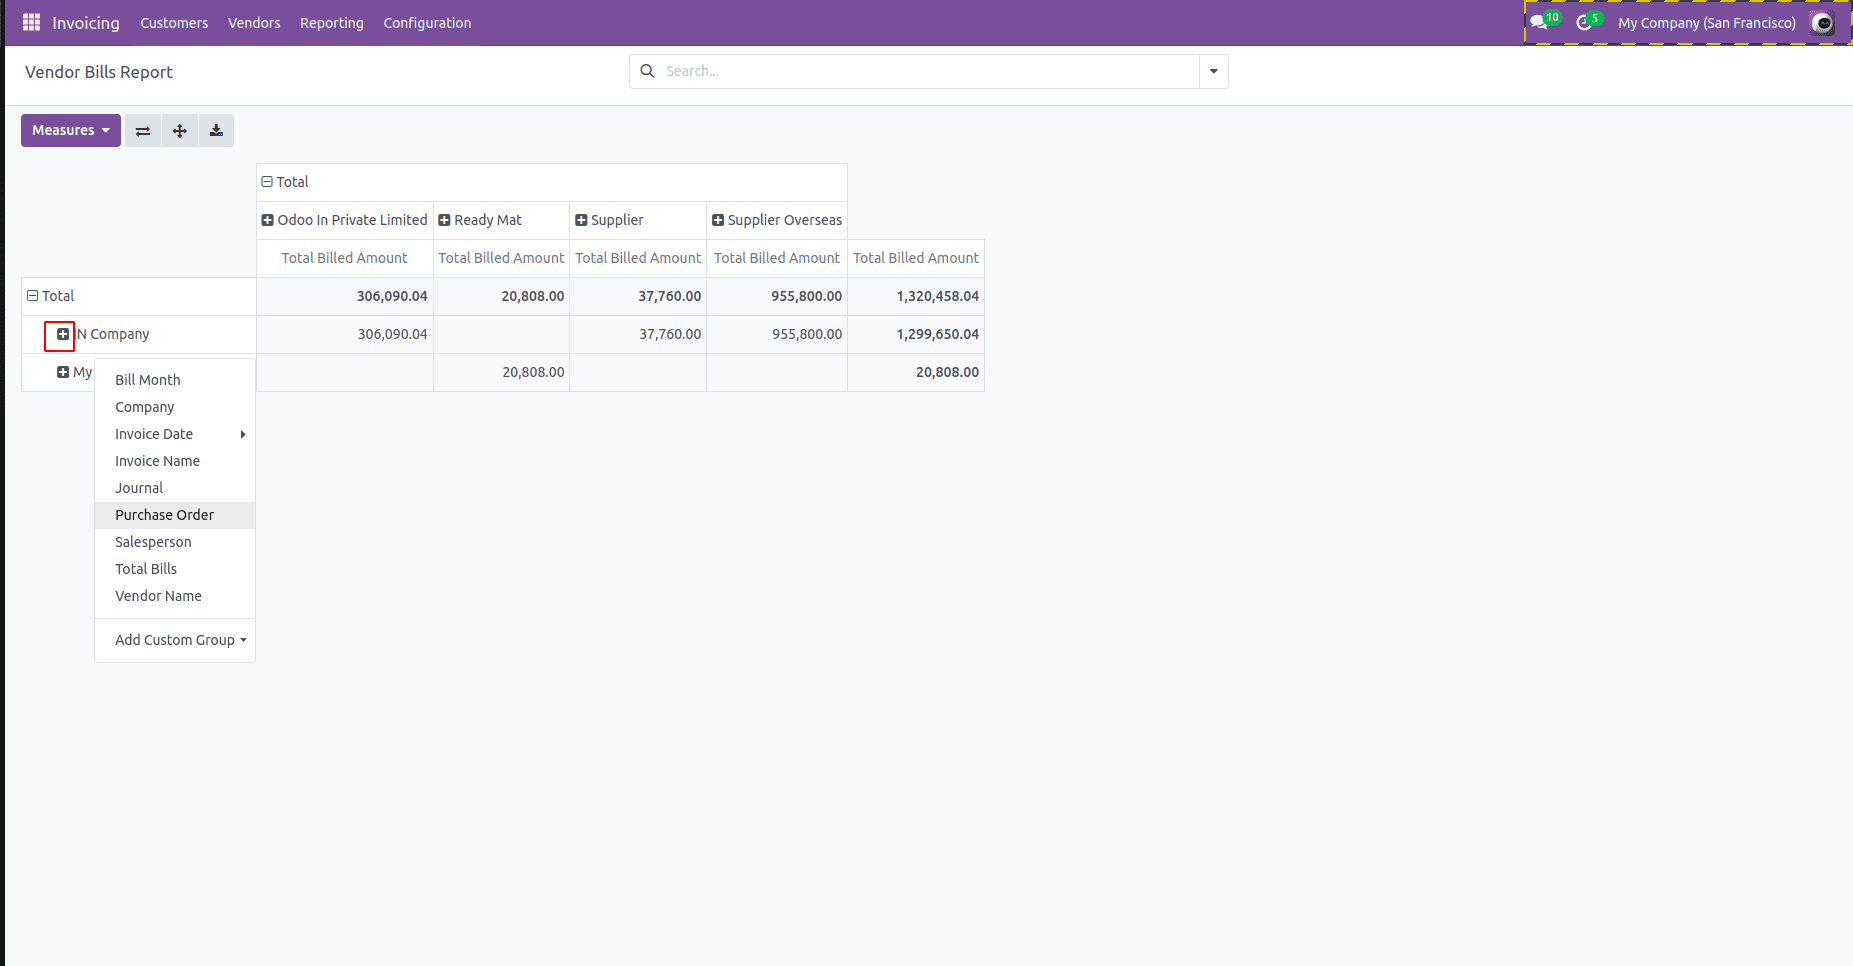
We can also customize the measures by using the "Measure" button and selecting the desired measure according to our requirements, as shown in the figure below.
In conclusion, creating pivot reports using SQL queries in Odoo 18 offers a powerful way to analyze complex data with flexibility. By defining SQL views and integrating them with Odoo's ORM, users can generate reports that provide meaningful insights, tailored to business needs. This approach is particularly beneficial for those needing specific reports, such as financial summaries or vendor performance. Additionally, Odoo’s core functionality enables easy export of these reports to XLSX format, allowing businesses to share and analyze data beyond the system. Combining SQL query power with Odoo’s intuitive pivot interface and export features enables more informed, data-driven decision-making.
To read more about. How to Inherit Existing Pivot View Report in Odoo 17, refer to our blog How to Inherit Existing Pivot View Report in Odoo 17.