Odoo 16's advanced purchase management system makes it easy to track purchase orders, define products, manage suppliers, and prepare products/services. You can manage all functions related to the purchase of products in the Purchase module. This module also allows you to track purchase orders and quote requests. Combining the functionality of the purchasing module with other Odoo 16 modules, such as accounting, inventory, sales, and invoicing ensures an effortless purchasing process.
A well-defined procurement management system like Odoo can make all these risky operations simple and effortless. Odoo's procurement management system can manage and prepare bids, evaluate and approve purchase orders, select and approve products or services, receive and deliver invoices and orders, and finalize payments.
Purchase Dashboard
When you open the Odoo 16 purchasing module above the list view of purchase orders and offers, you will see a dashboard with many details.
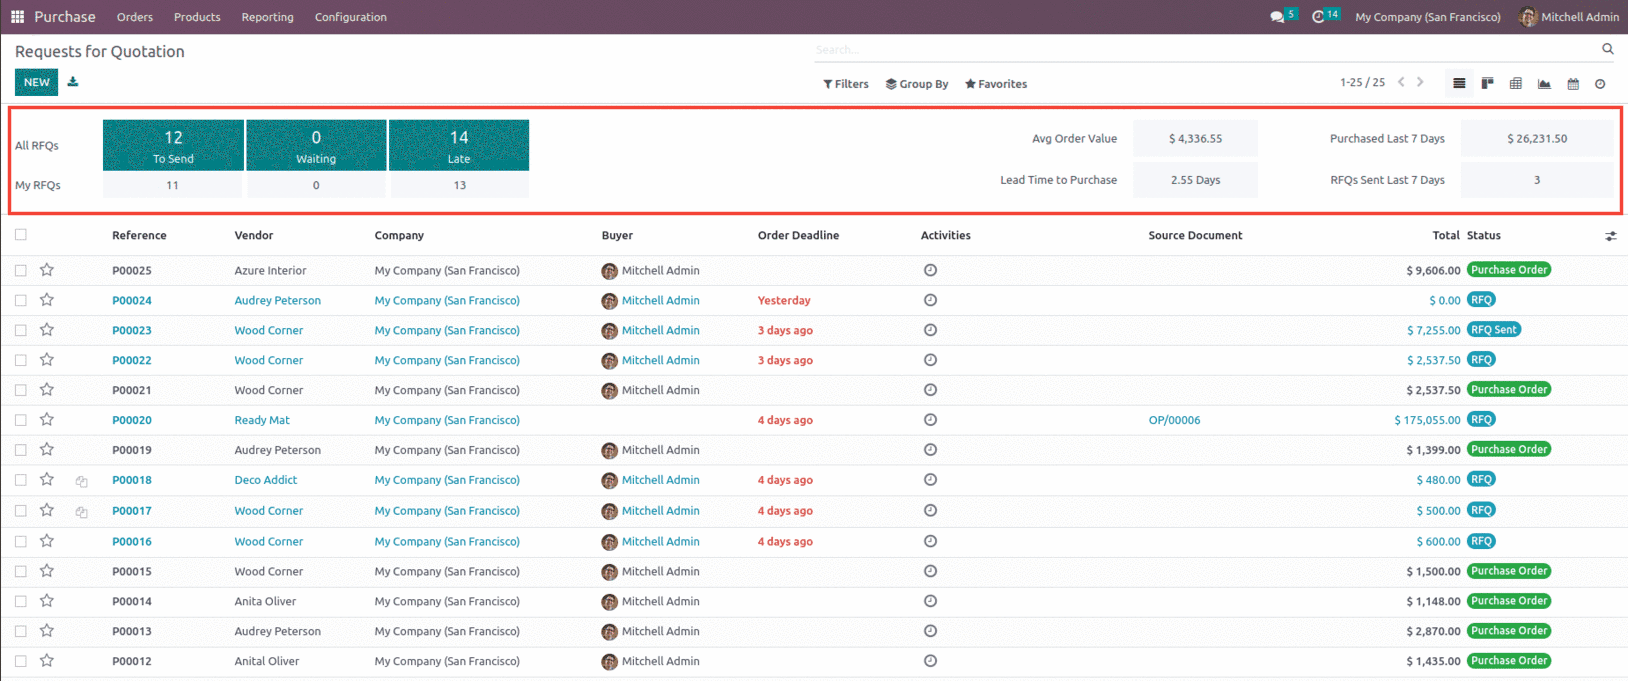
From the dashboard, we can see the status of all RFQs and our own RFQs, as well as the number of RFQs in three states: To Send, Waiting, and Late. All these states include RFQs that are still not processed or are in the waiting state.
From the purchase dashboard, we will get pieces of information like
* Average order value
* Purchased in the last 7 days (total purchased in the last 7 days)
* Lead Time to purchase in days
* Number of RFQs sent in the last 7 days.

The ‘Avg Order Value’ is the sum of the total purchase order amount divided by the total number of orders.
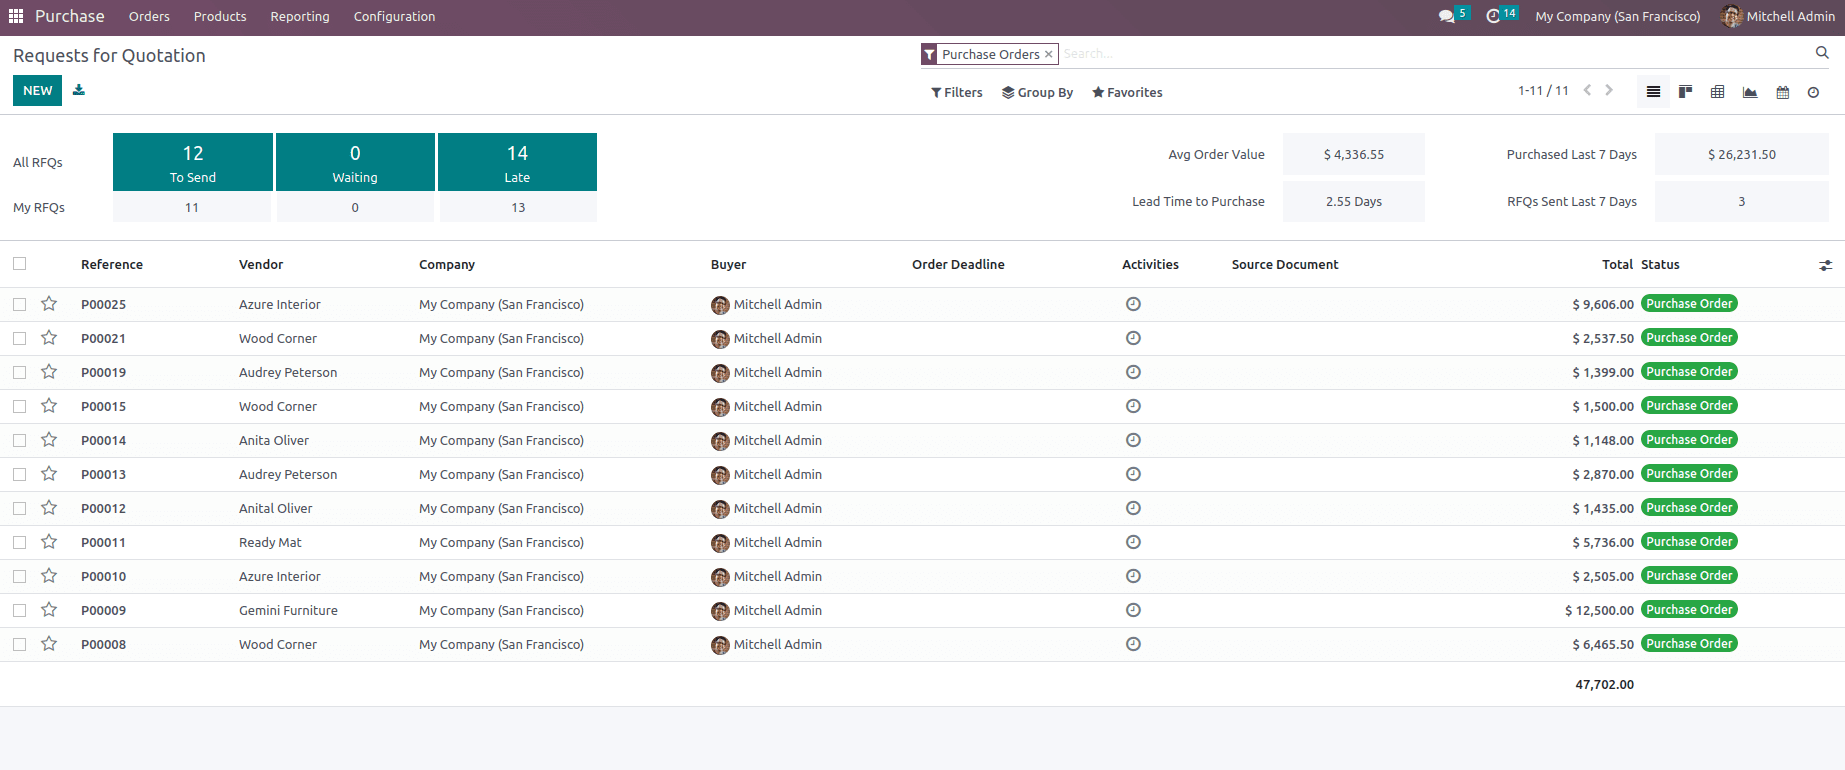
In the above screenshot, we can see that the total number of Purchase orders is 11, and the Total revenue is $47,702.00, so when divided, the value is $ 4,336.55, as shown in the dashboard. If we check the Purchase order for the last 7 Days, we can see that the last purchase order created in the last 7 days is a total of PO $26231.5 as shown in the above screenshot. Along with this, the user can also view the RFQs Sent Last 7 Days and Lead Time to Purchase. These are a few details associated with the purchase module dashboard.
Purchase Analysis
The next is the purchase analysis in the Odoo 16 purchase module. Suppose your business buys products regularly, you have several reasons to monitor and analyze your performance. The insights you gather will help you better anticipate and plan future orders. For example, you can assess whether your company is dependent on certain suppliers, and this information can help you negotiate reduced prices. With Odoo 16, you can easily customize the required Reports from the reporting section in the Purchase module.
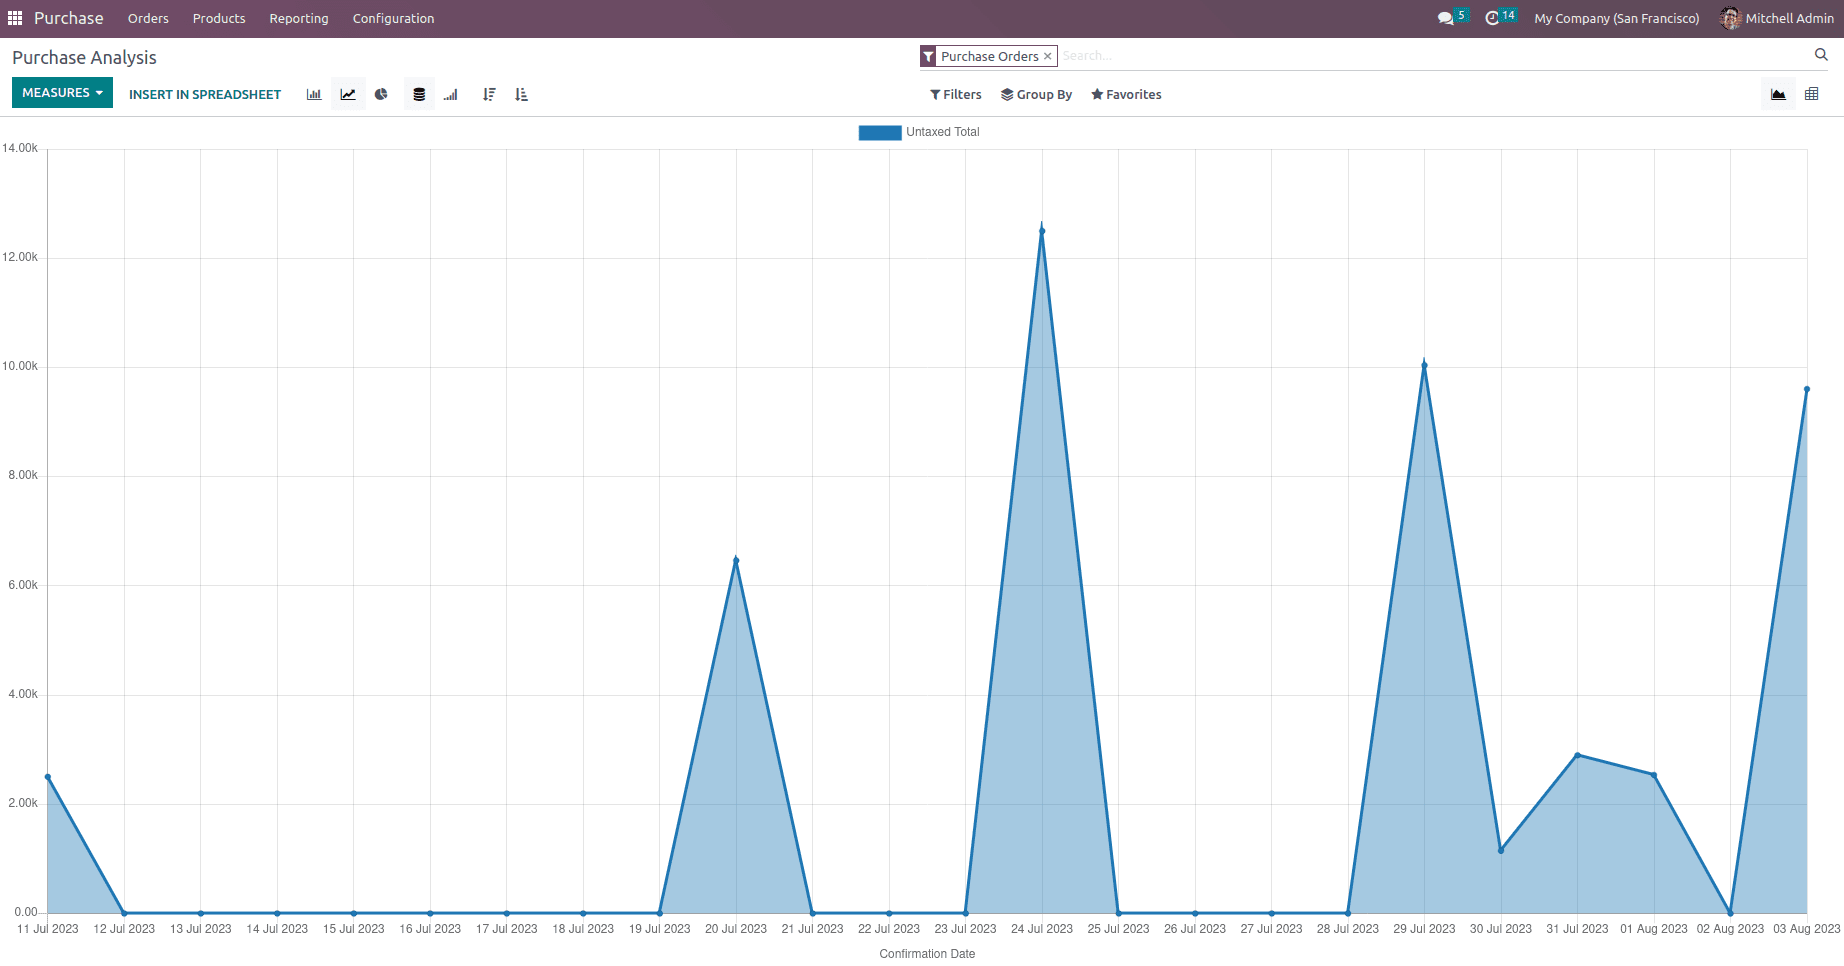
To access the purchase analysis, go to Reporting. You can get a quick overview of your actual performance by simply opening the report panel. By default, the reporting panel displays a line chart showing the untaxed amount of your purchase orders daily, with the most important data and a pivot table below.
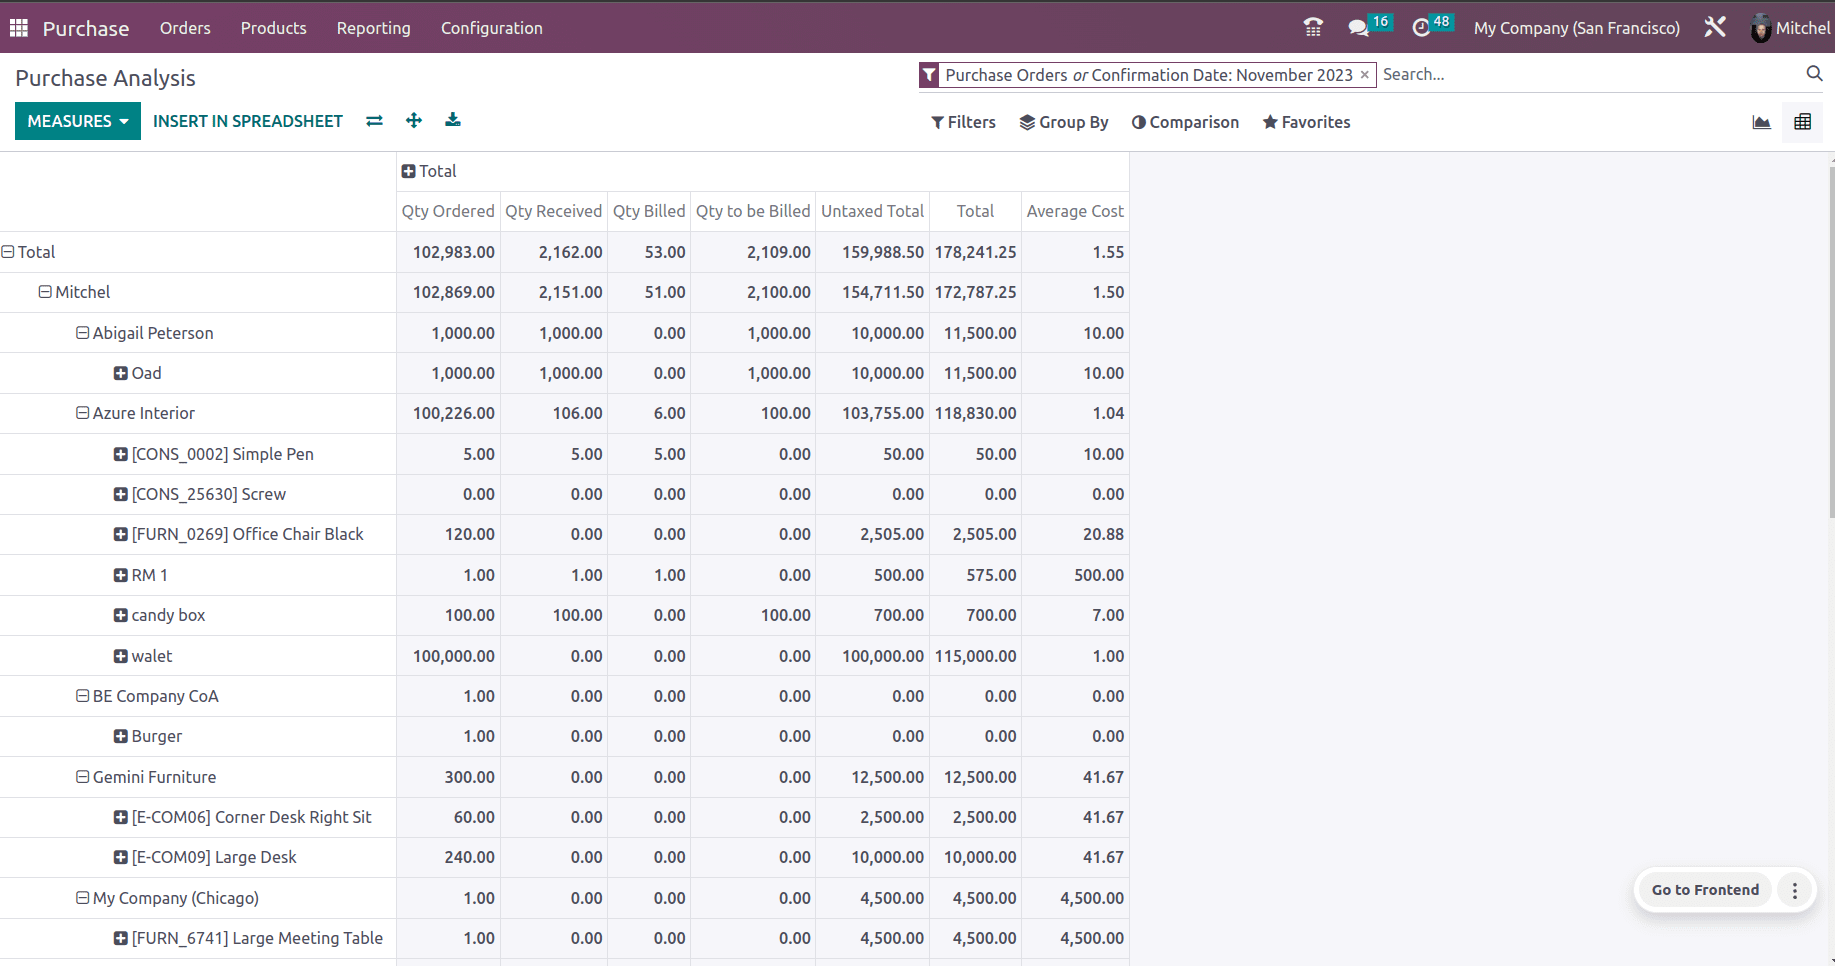
Odoo provides several patterns for generating reports other than pivot and line charts. It includes a bar chart, stacked, cumulative, and can even be ascending or descending. Below is a sample for the bar chart.
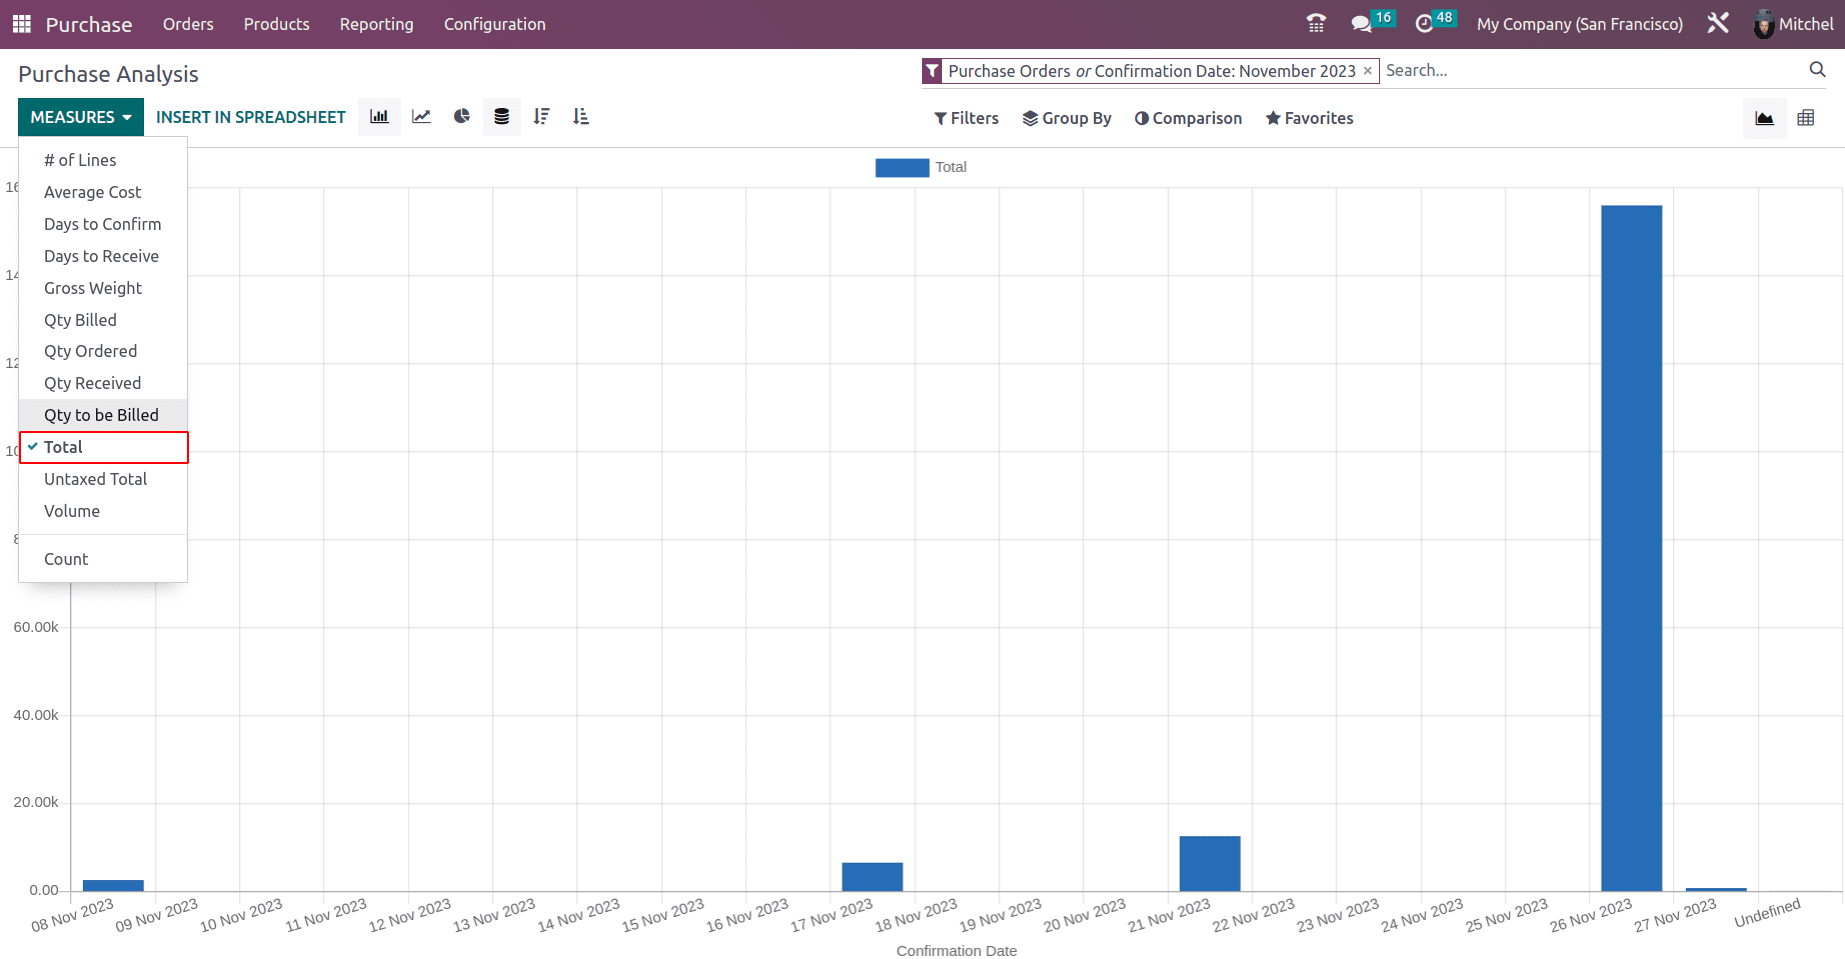
This bar chart is based on the total purchased amount in the month of November.
Odoo provides several default filters that you can use and combine by clicking the Filters button. If you select one or more filters, Odoo will search for all orders that match at least one of the filters you selected and populate a chart and pivot table with the data.
The preconfigured filters are: Request for Quotation, All purchase orders except canceled orders, Last year's confirmation date includes all orders confirmed in the previous year, including canceled purchase orders. The order date includes all orders - quote requests and purchase orders (including cancellations) - by the date they were created and Confirmation date includes all confirmed orders, including canceled orders, depending on their confirmation date.
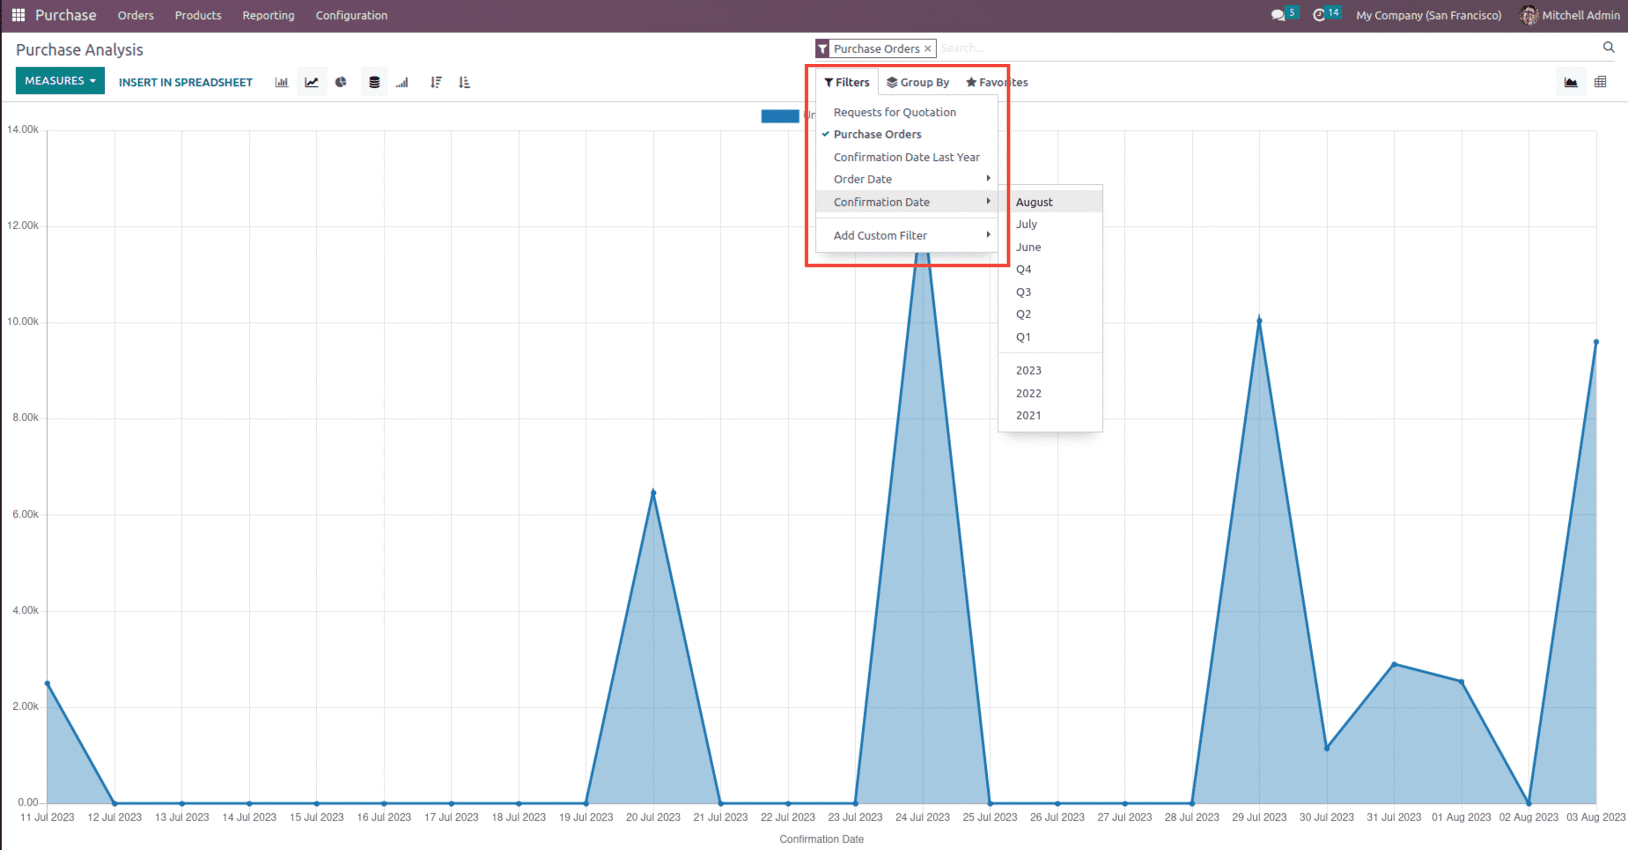
Along with this, Odoo also provides the option to Add a Custom Filter. The possibilities for changing your dataset are almost limitless.
Go to Filters ? Add Custom Filter, specify the condition the filter selection must meet (eg equals, contains, etc.), and click Apply.
If you want to select orders that meet multiple criteria (and operators) at once, repeat the process to add another custom filter.
If you want to use the or operator, don't click Apply, but click Add Condition. After adding all the filters you want, click Apply.
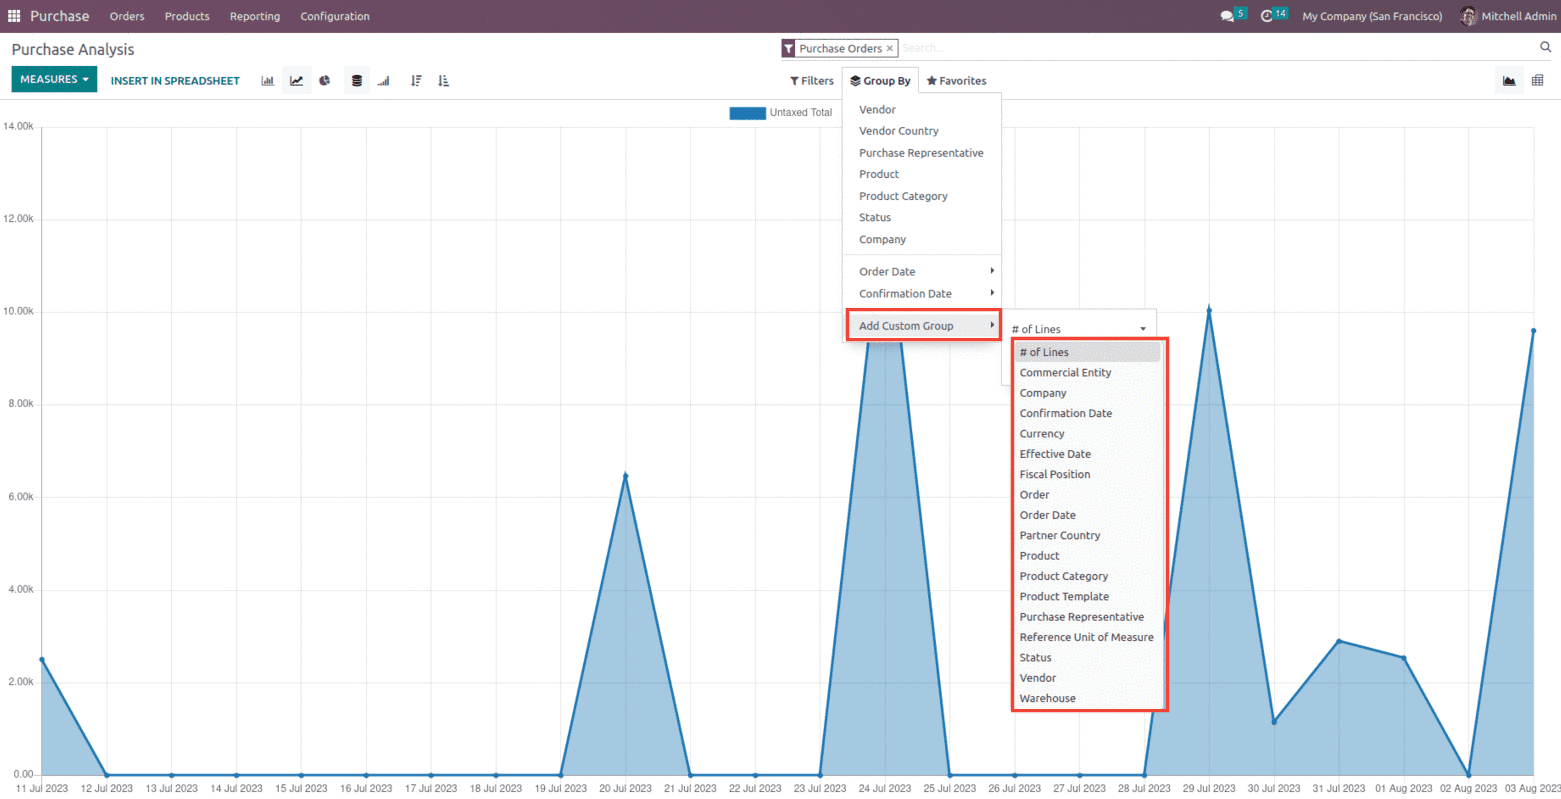
You can change the main chart with one click by choosing one of three charts: bar, line, or pie. For bar and line charts, the selected measure is your y-axis, and the first group selected is used to create the x-axis. Adding a group adds lines (line chart) or changes a bar chart to a stacked bar chart. In pie charts, the more groups you select, the more parts are displayed.
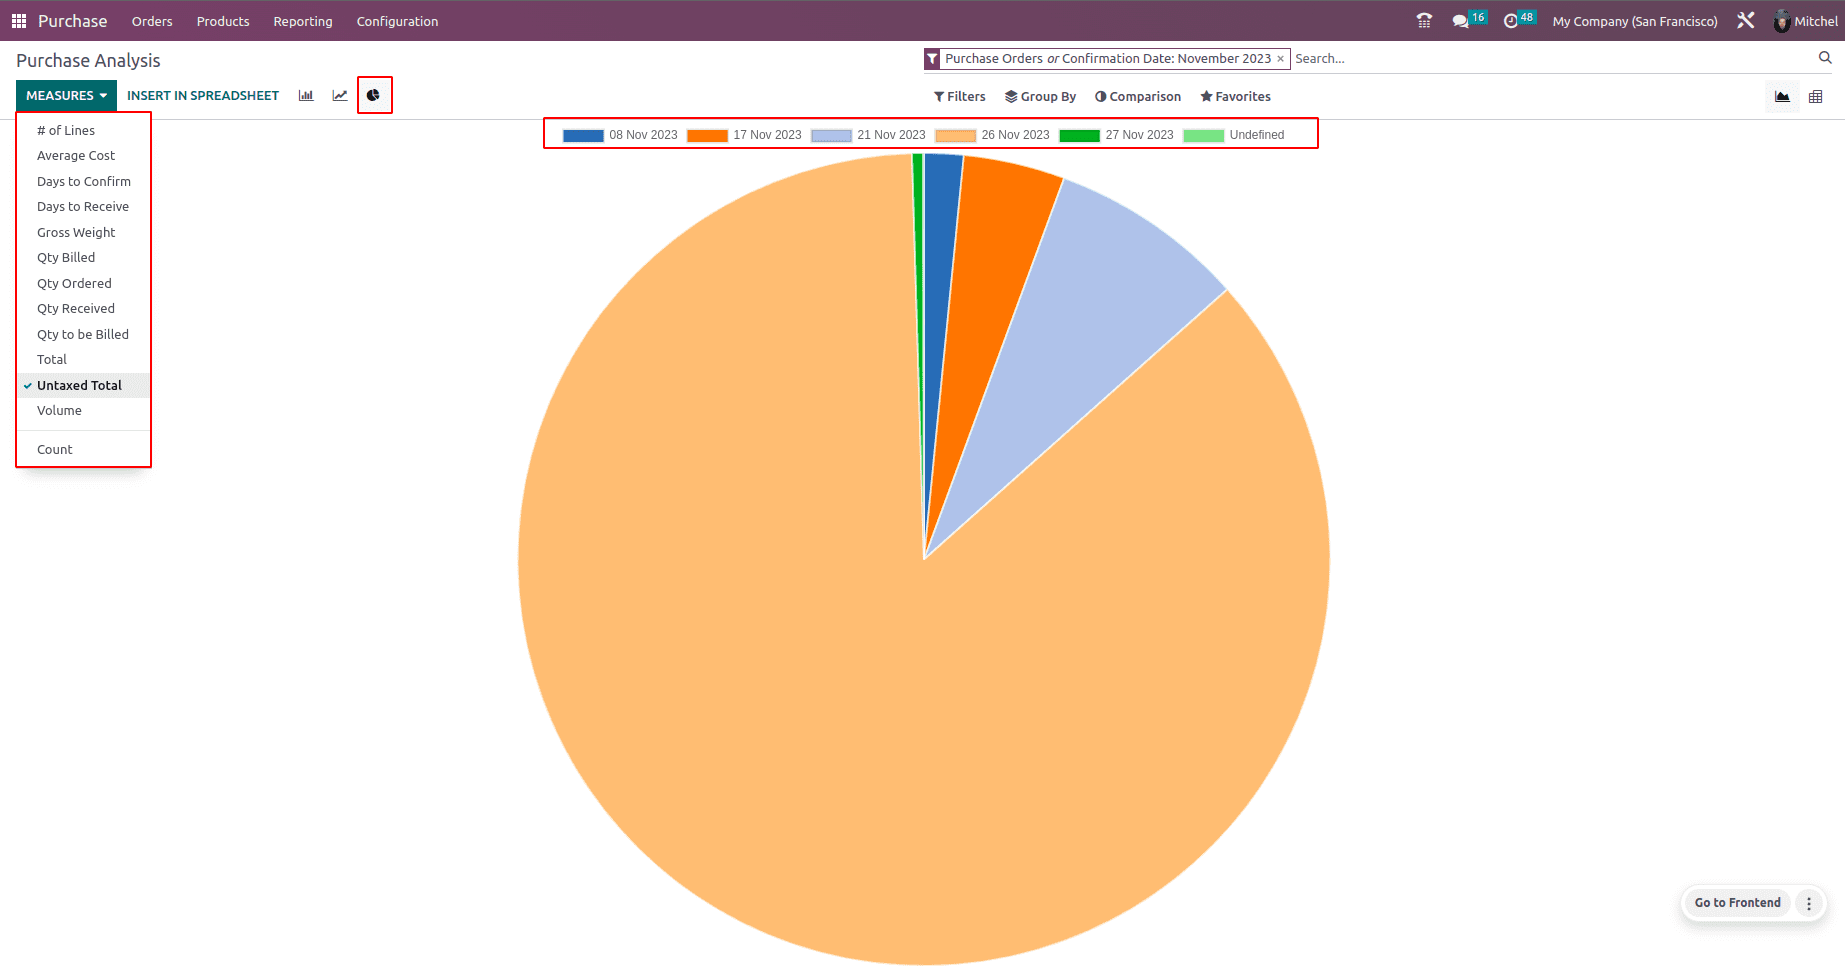
The Pivot Table view allows you to explore your data in great detail. Unlike the graphical view, you can add multiple dimensions at once in a pivot table. By clicking ‘Measures’ and marking the columns, you can add as many as you want, each in a new column.
By clicking on the ‘+’ symbol in the Total line, you can add groups. If you click on the group icon ‘+’, you can add a subgroup, and so on.
The other option ‘Add into Spreadsheet’ allows you to add the filtered pivot table to a spreadsheet. Also, it will be able to flip the x and y axis and use the expand all button to expand the filter to your pivot table. The later icon ‘to download’, downloads the pivot table to the xlsx report.

You can even save the current search filter in your favorites.
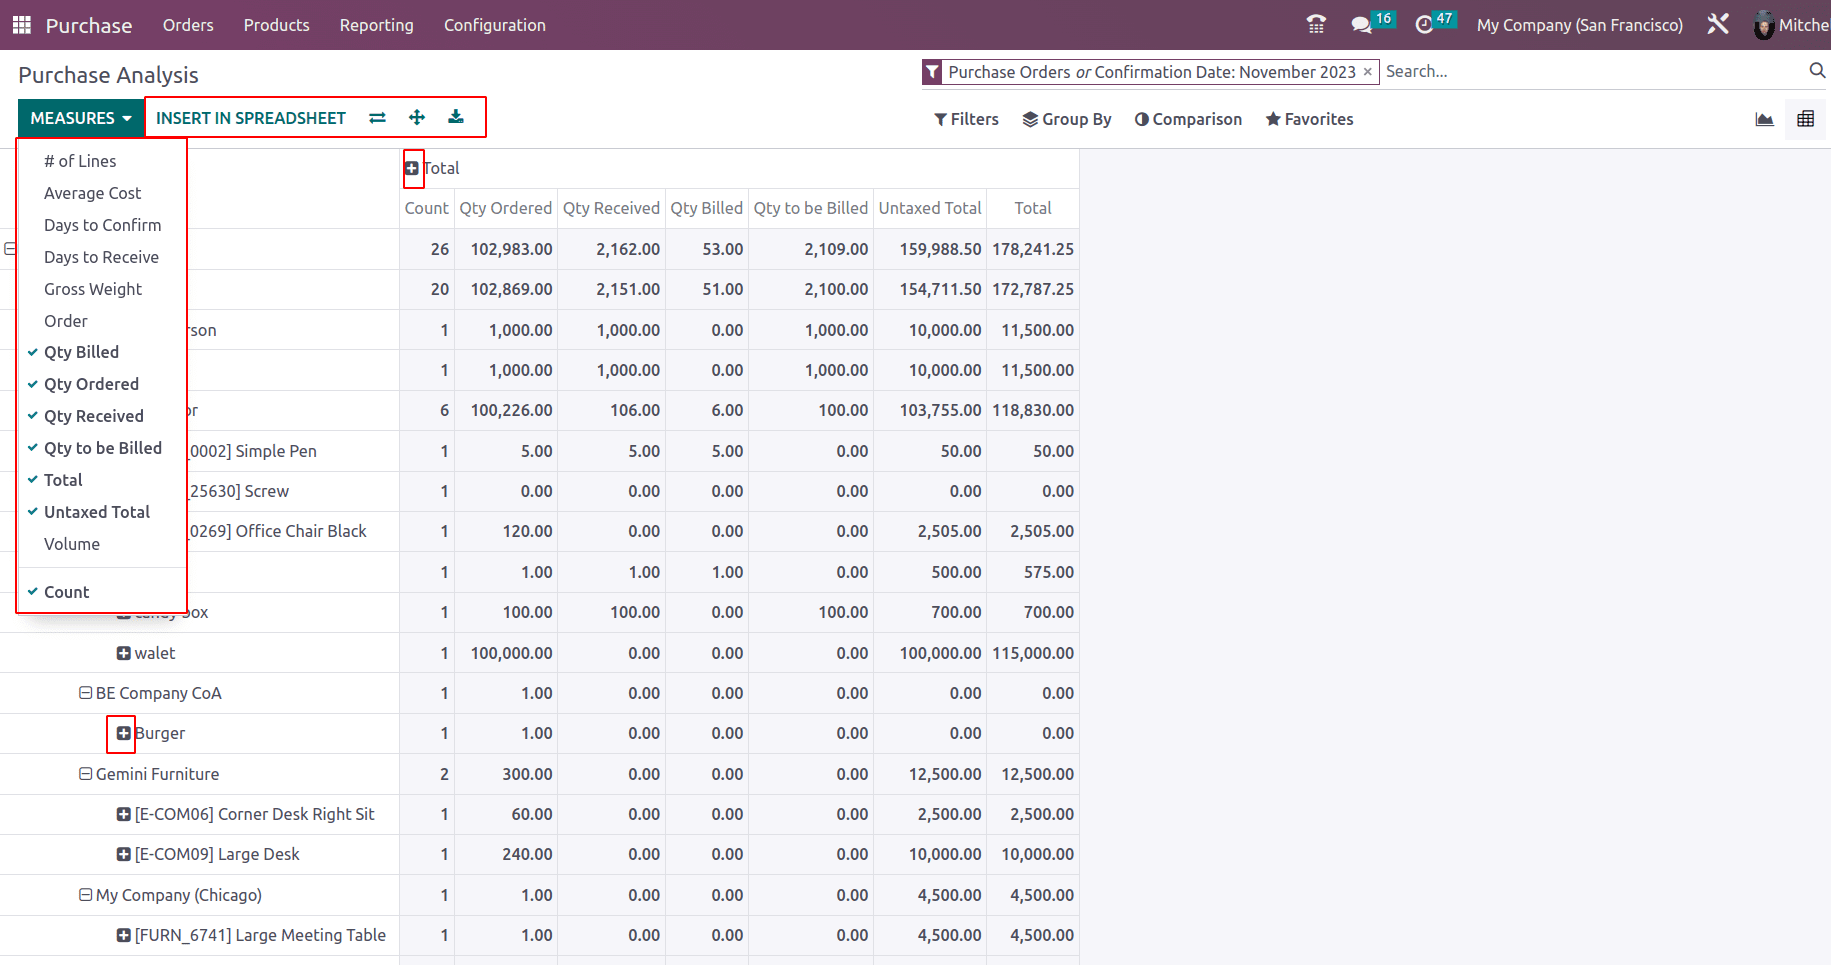
Thus, the purchase analysis report allows you to take dynamic reports into a pivot table, that can be printed into an xlsx format or can be saved to spreadsheets workspace in the documents folder and that can be shared among procurement managers.