The spreadsheet is a highly integrated tool in Odoo and has its fair share of roles in the Odoo Inventory module. Odoo spreadsheet is a highly sophisticated data management system that has the ability to automate itself with data management. The feature allows you to have a clutter-free data management space that will help you in analyzing and effectively communicating with the data. You can literally have real-time data communication with the Odoo spreadsheet and with the highly integrated nature, the level or the amount of advantage that it can give you on business is limitless.
This blog will give you a short idea of the role of spreadsheets in the Inventory Module.
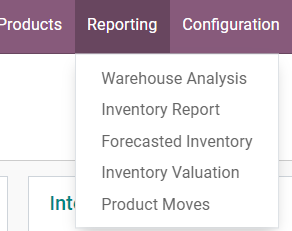
Odoo spreadsheet works in similar formats across all the applications of Odoo and as it is highly integrated into the applications you can access the spreadsheet from the dashboard of the application itself. Because of its highly integrated nature the data in the respective application will be automatically collected and sorted out for your analysis and all you have to do is to open the Spreadsheet from the application. In the Inventory module, you can access the spreadsheet from the dashboard of the inventory application. Inventory is a sector business that has a direct impact on the company data, so maintaining it properly is important. Inventory is basically filled with important data, in Odoo you can access the various reports from the Reporting in the dashboard of the Inventory module and the spreadsheet plays its part in this section of the Odoo Inventory.

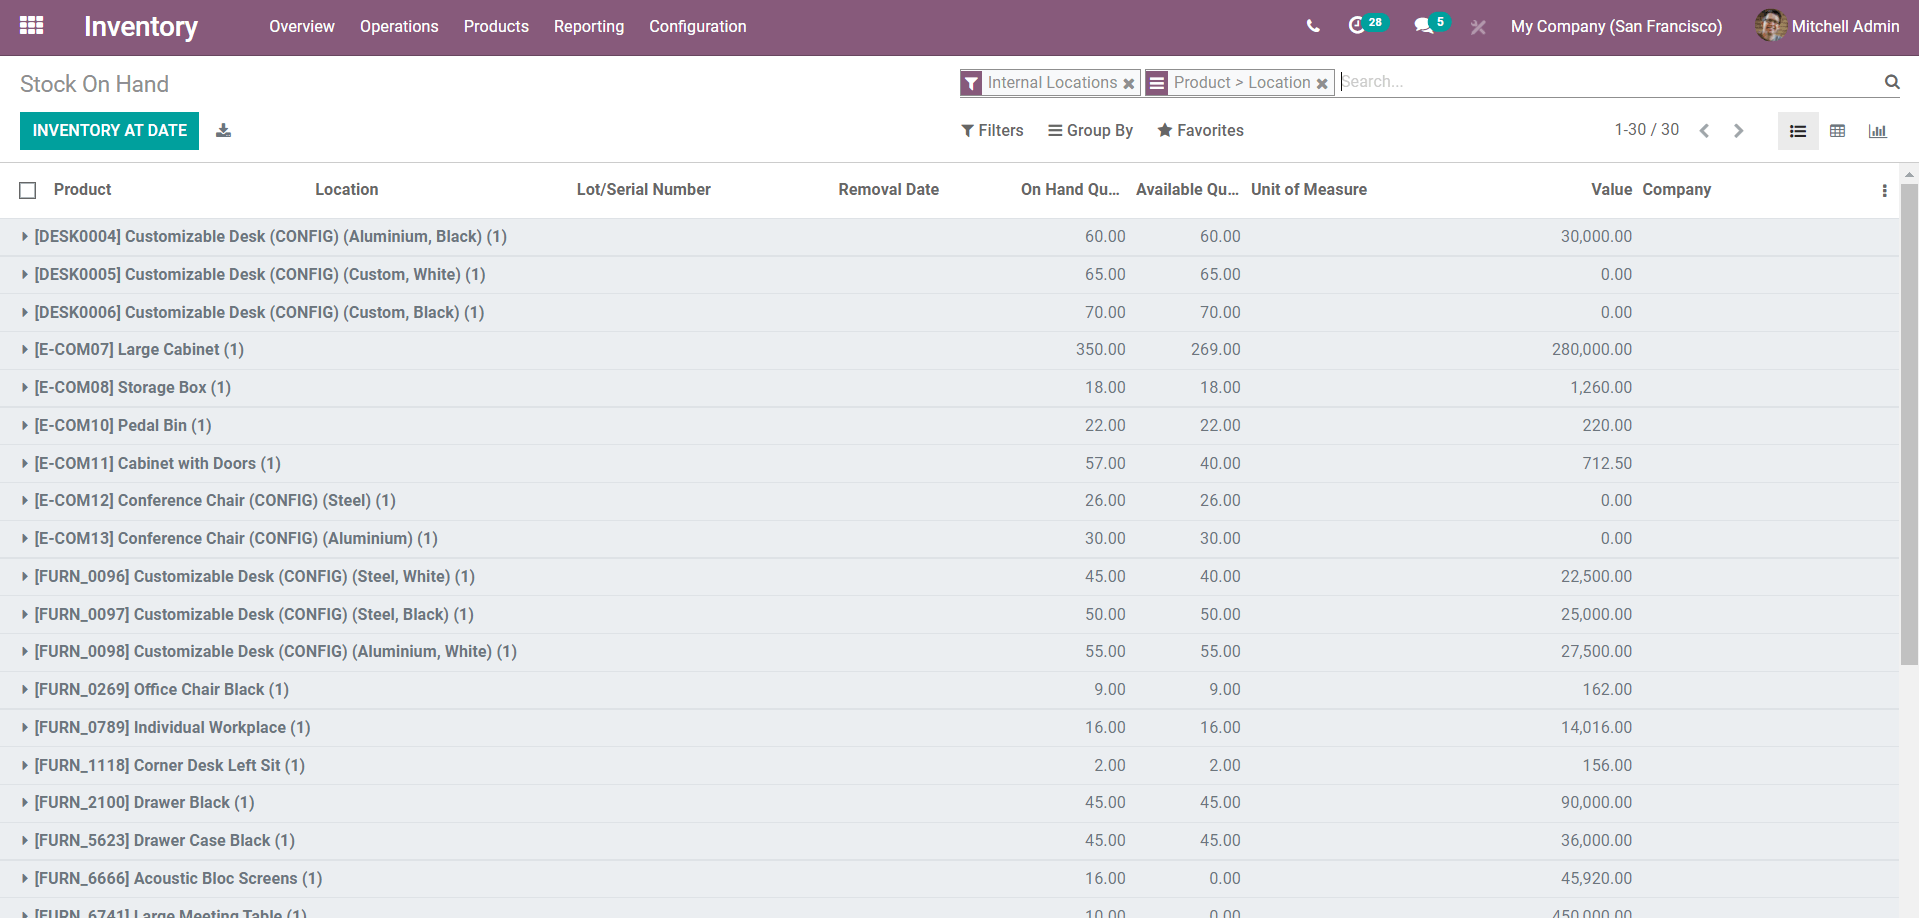
You can choose the type of report form here the below given screenshot is the Inventory report.

This is the list view of the Inventory report, here you have options for filtering and configuring the list and the data. To get the pivot view of the list you have to go to the right side corner of the dashboard and there are three viewing options as in the screenshot given below.

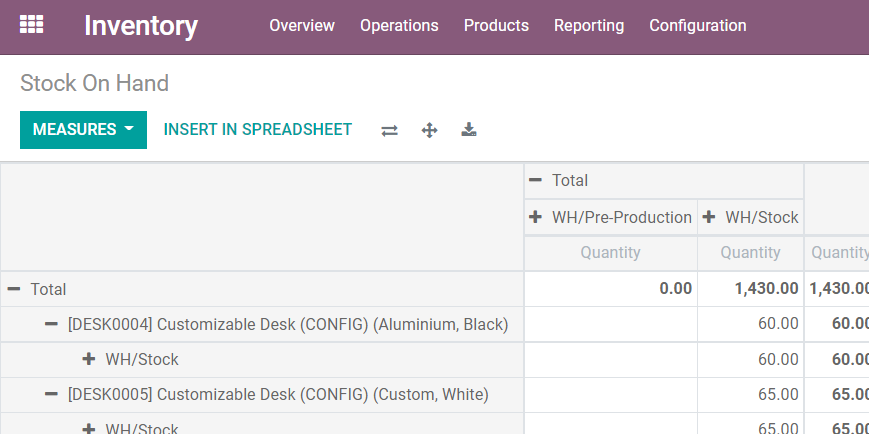
Click on the second option to getting a Pivot view of the list as shown below.

The Pivot view is more explicit in nature and you can filter, group, and add favorites from here and whatever you do here will be reflected on your Spreadsheet. With the advanced filtering options, you can avoid unnecessary clutter from your spreadsheet along with the data you wish to see and analyze, so it's recommended that you filter your Pivot columns. As soon as you are done with the filtering click on ‘Insert In Spreadsheet’ and your data is now in the spreadsheet and it will be automatically entered and you don't have to wrap your time around it. The data present in the spreadsheet will be the result of the filters that you have applied in the PIvot view. You can filter the spreadsheet again by going to the right-hand corner of the spreadsheet and you can find an emoticon of filter and you can find the filtering options under it as given in the screenshot below.

There are three filtering options available for you to filter your spreadsheet. You Can filter your inventory spreadsheet according to the date, the relation of the text. If your company or business deals with a huge amount of inventory then you must filter your Spreadsheet for cutting-edge data results because effective and efficient inventory management can actually help you predict your business's future. You can find your spreadsheet on the Documentation module of Odoo. If you want to edit the spreadsheet you can do it from the documentation itself. You can add almost anything to your spreadsheet from the inventory module.
A spreadsheet is a useful tool for your ineffective inventory management. Inventory is widely used for business predictions and often the sales department works extremely close to the inventory to analyze the reports for customer and sales management with the traditional format of reporting it would take you and your team ages to figure out the data alone and ordering and arranging it would take another set of ages. This is where the Odoo spreadsheet plays its role. As the Odoo spreadsheet is much more advanced than any other data entry system, it is highly efficient in managing your reports effectively.
As said before, the tools on the spreadsheet in Odoo have a huge impact on the reports that are created and you can use the tools especially the Filter tool to its maximum. The filtering tool allows you to have a clean look at your data and you can choose from the various filter options for your spreadsheet. You can click on the filtering options to optimize the data that you wish to analyze hence making the process of data analysis easier. The option aims to make you and your team more efficient in data management and allows you to arrive at clear and accurate decisions. This is why you should use the filter option to its maximum and in a way it even allows you to predict the future of your business.
The nature of the spreadsheet except for its advanced tools and functions as same compared to the traditional excel sheets, as the people are more aware of the Excel sheet functions so it will be easy for you to work on the spreadsheet and formulas are same but the major difference is the application of the formulas. Odoo has designed the spreadsheet to be extremely user-friendly in nature, applying and getting results on the formulas is extremely easy in Odoo. The spreadsheet in Odoo is automated and will continuously update itself with essential data and you don't have to update the data on the spreadsheet for every single data fluctuation or change in the inventory module. This efficient and advanced tool has its own importance in the Odoo environment and is imperative for effective data management. The tool does not require additional coaching and it's free to use across all of the applications in the Odoo ERP. The spreadsheet tool can make an impact on your business data management in a positive way.