As we all know, a triumphant business return should rely upon proper management. All businesses must possess appropriate management. To understand a business's reporting and analysis, they must either imply a manual or digital analysis strategy. Most companies follow a manual entry system which ends with a tedious task. And sometimes they can’t manage the task physically. In the rental industry, the rental management seeks a crucial role in reporting and analyzing the available products delivered, booked, or if not in stock, making specific procedures that deal with a frantic task if not properly ordered. And it seems with lots of loss in time. It is best to overcome this situation by implementing an ERP tool.
Yes, here comes the Odoo 15 Rental module that makes your rental business more impressive and systematically tracks your business. It is helpful for a manager in saving his time and implying new ideas for the development and sustainability of the company.
Odoo, which plays as an open-source suite in your rental business or any other business, confers in a tactful path. It assimilates all your complicated tasks like accounting, customer relationship management (CRM), etc., in a very delicate and easy manner over a few clicks.
WHAT IS THE PURPOSE OF REPORTING AND ANALYSIS IN THE RENTAL BUSINESS?
Reporting and analysis stand and impart with a role of the eye in business management. Or in the other hand, it stands as two parts of a coin. However, in the rental business, reporting and analysis stand as solid pillars for the further development of the industry. It is the right of a capitalist to know the status of different functions played in a business and to maintain stable business growth. Through all these reports and analyses, he can implement new ideas or any other new strategies that lead to the feasibility of the business.
In Odoo 15 Rental Reporting, you can view different types in terms of daily, weekly, monthly, and yearly work reports. Based on this, you can analyze the future of your rental business. It will also recognize the working patterns of different marketing and salespersons. The module also gives an idea of dominant customers and their dealings with demand products. Thus, it provides the venture capitalist with establishing the business and what we need to concentrate on more.
This blog gives an insight into how we can promote rental analysis reporting in the rental business through Odoo 15.
Before directly moving to the Rental Reporting, we need to understand the Scheduling of different products in the Rental module. In this, you can deal with the rental-related activities like the orders of products, pickup of orders, delivery of the rental product, transaction status, etc.
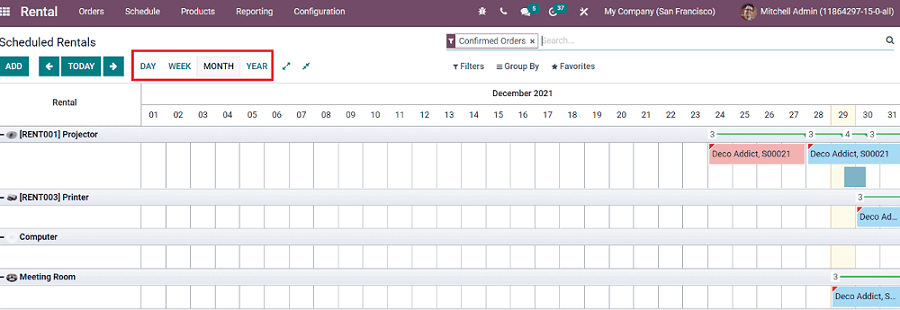
If you click on the MONTH, DAY, WEEK, YEAR, etc., you can get the report of dealings as per your selection. For example, if you look at the monthly basis report, you get a result as seen above screenshot.
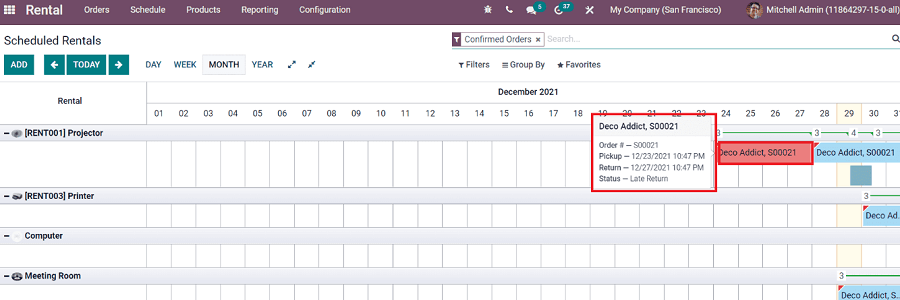
You can get the full details by clicking on any customer's orders, including the status given above screenshot. The status of each customer's order is presented in different colors for easy recognition. Also, by clicking on the ADD option, you can schedule new rentals.
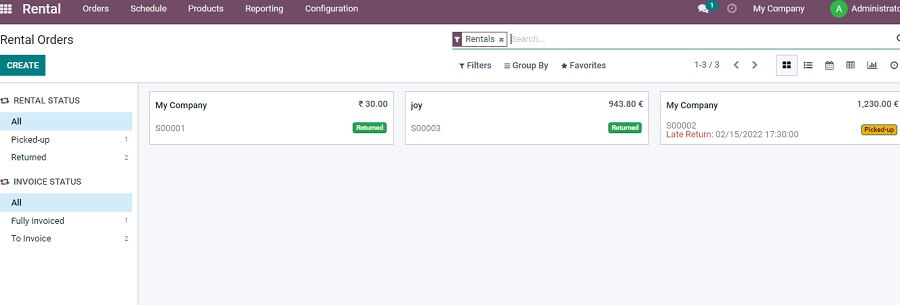
Now we can directly move on to the Reporting menu. Before moving to the first page, shown below gives the list of orders.
By directly clicking on the Reporting menu, you will see these orders as in a graph as shown below.
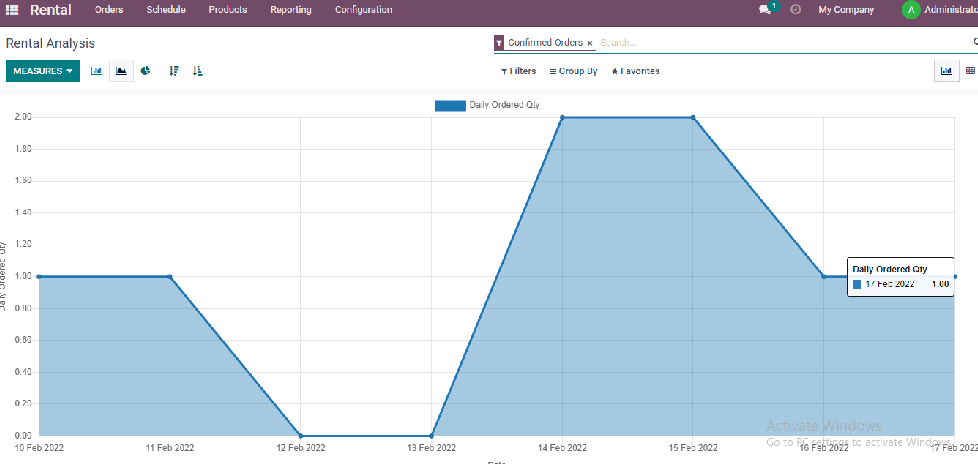
By clicking on the MEASURES, you will get different options as shown below, and as per you will get different views as follows.
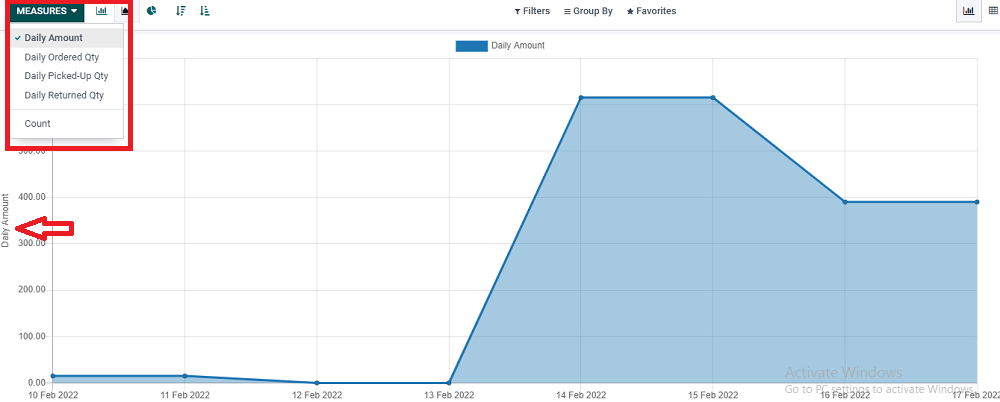
This is a graphical representation view based on the daily amount from the MEASURES option. The representation gives statistics from 10-Feb-2022 to 17-Feb-2022. You can select any of the options from the table of MEASURES options and view them in different ways.
DIFFERENT VIEWS
Now let us discuss the different views on seeing and analyzing the statistics. Odoo Rental module entails various representations to know and understand the rental analysis and make the investor compete.
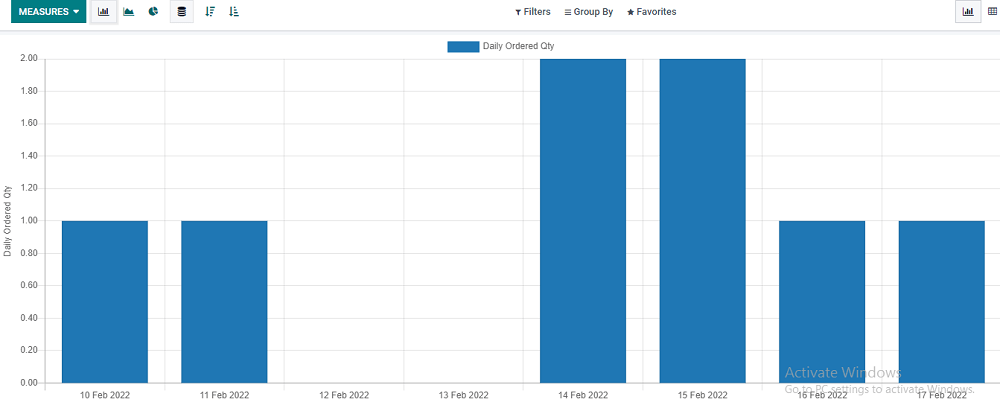
In the same MEASURES itself, by selecting any of the options, such as the Daily Ordered Quantity, you can get a pivot view or graphical view. You can get a line graph, bar diagram, and pie chart from the graphical view, respectively.
Let us see the pivot view.
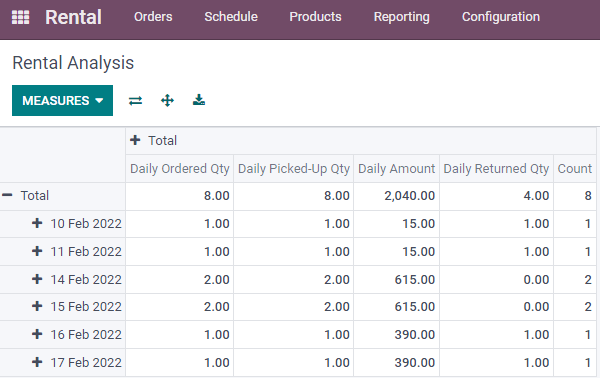
You get all specifications denoted in the MEASURES option in the pivot view.
Let us see the bar graph in terms of Daily Ordered Quantity.
Let us see the pie chart in terms of Daily Amounts.
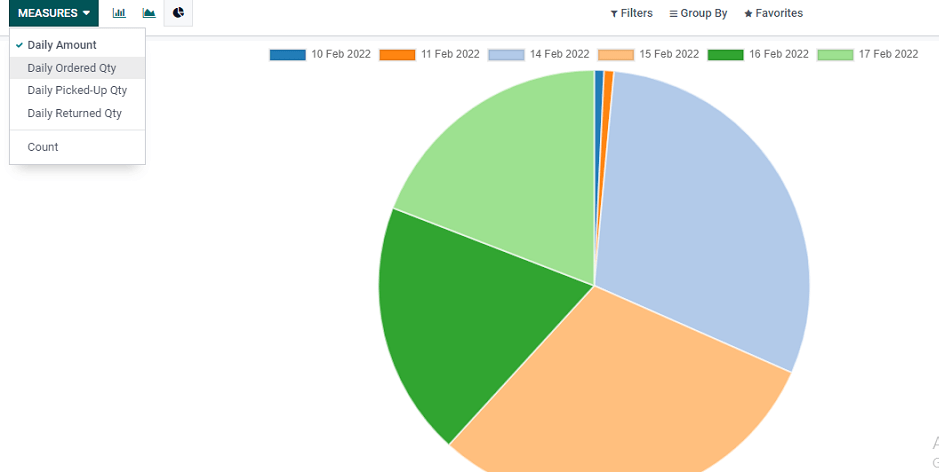
These are the different views where you can analyze your company's statistics.
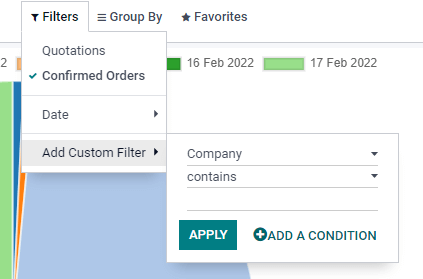
Next, we can move to the Filters option; as we all know, we can set it to the Filters options as per our need or requirement. If required, you can set it with Custom Filter.
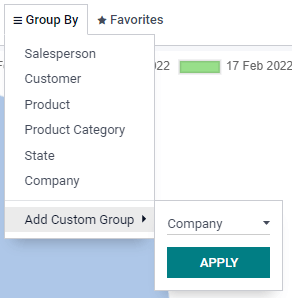
And next is the Group By option. In this, you can see various options like you can see the activities of different salespersons, customers, products, etc., as follows. If required, you can add a custom group.
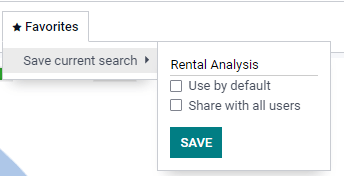
And in the Favourites option, the investor can share the rental analysis with different users or make it as default.
This blog dealt with how rental analysis reporting influences the rental industry using Odoo 15. Since the rental analysis and reporting come by scheduling, I have also discussed scheduling rentals. I hope this blog was informative. We will be reaching you with a new topic soon.