Profiling your code is essential for maintaining the performance and scalability of your Odoo applications. Odoo 18 introduces robust tools for profiling, allowing developers to analyze and optimize their code effectively. This guide explores how to enable profiling via the User Interface (UI) and code, provides an overview of collectors, and explains the various graph types used in profiling analysis.
What is Code Profiling?
Code profiling is a technique for measuring the performance of code. It helps identify bottlenecks by tracking execution time, memory usage, and the complexity of various code segments. Profiling is invaluable for optimizing resource-intensive tasks, improving database query performance, and enhancing the overall efficiency of your Odoo 18 applications.
Enabling Profiling in Odoo 18
1. Enabling Profiling from the User Interface
The UI method is the easiest way to start profiling in Odoo 16. This approach is suited for profiling web requests.
Steps to Enable Profiling:
1. Activate Developer Mode:
* Go to the debug menu and enable Developer Mode.
2. Enable Profiling:
* Open the Debug Tools from the systray.
* Click on Enable Profiling.
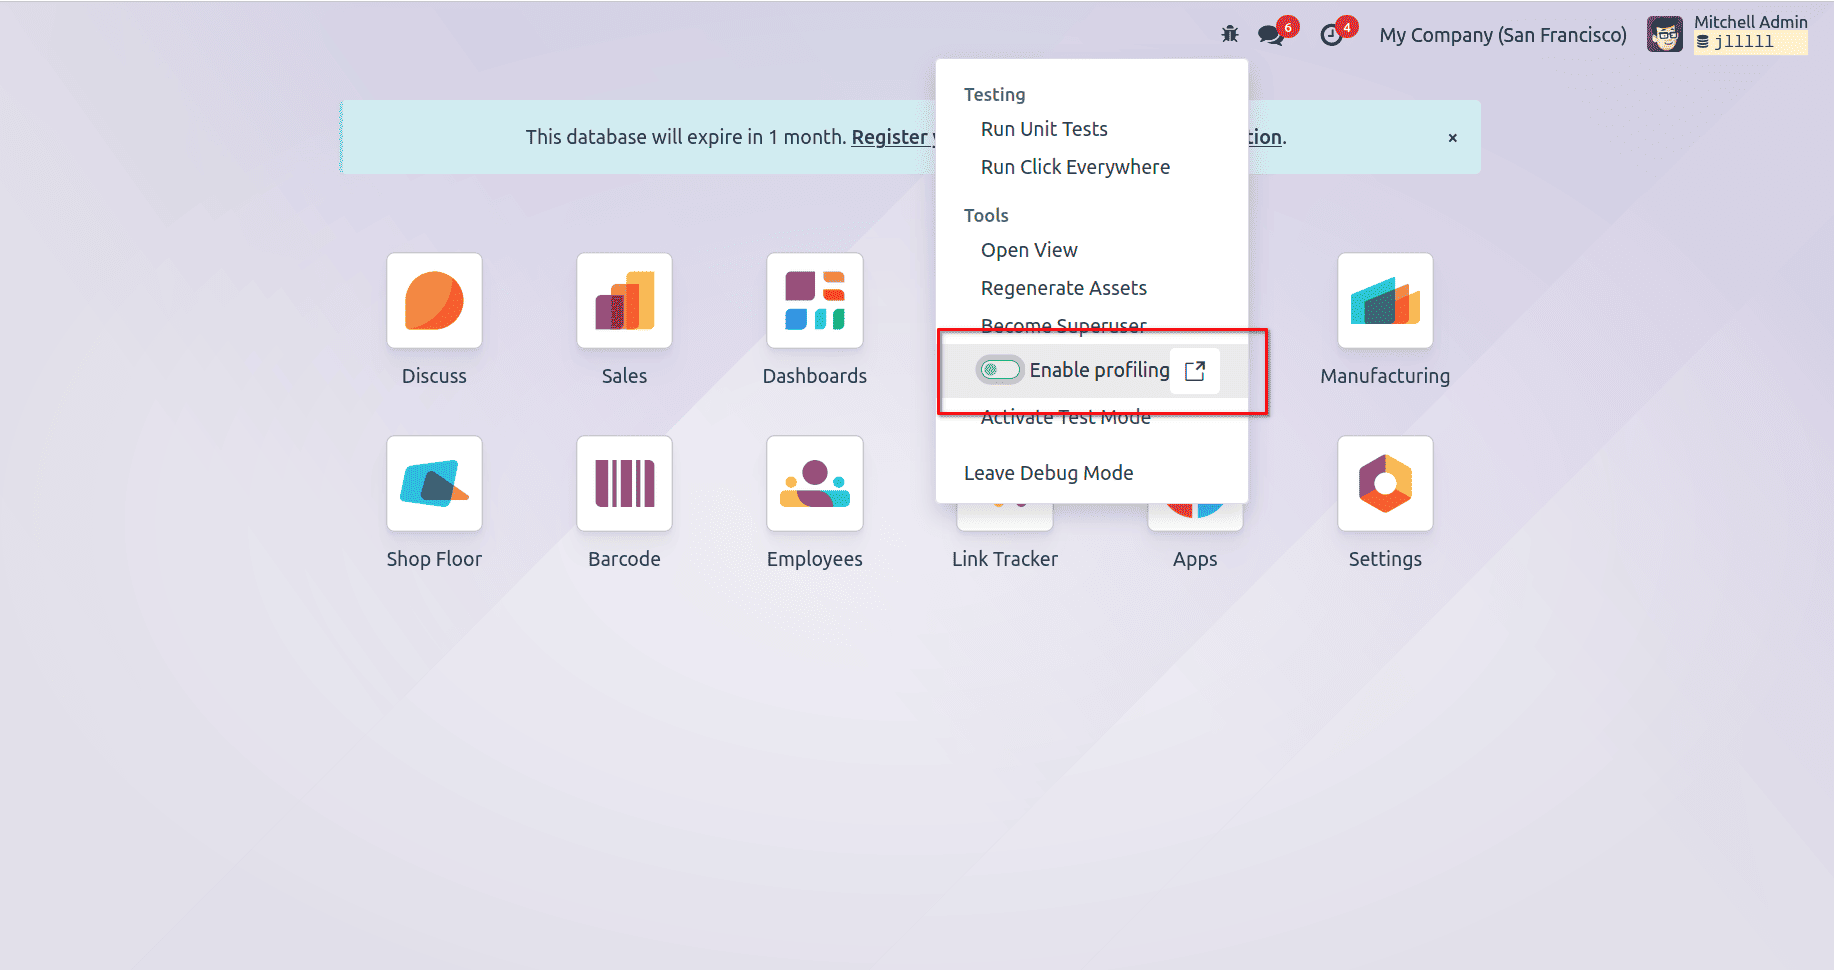
* A wizard will prompt you to set an expiration time for profiling.
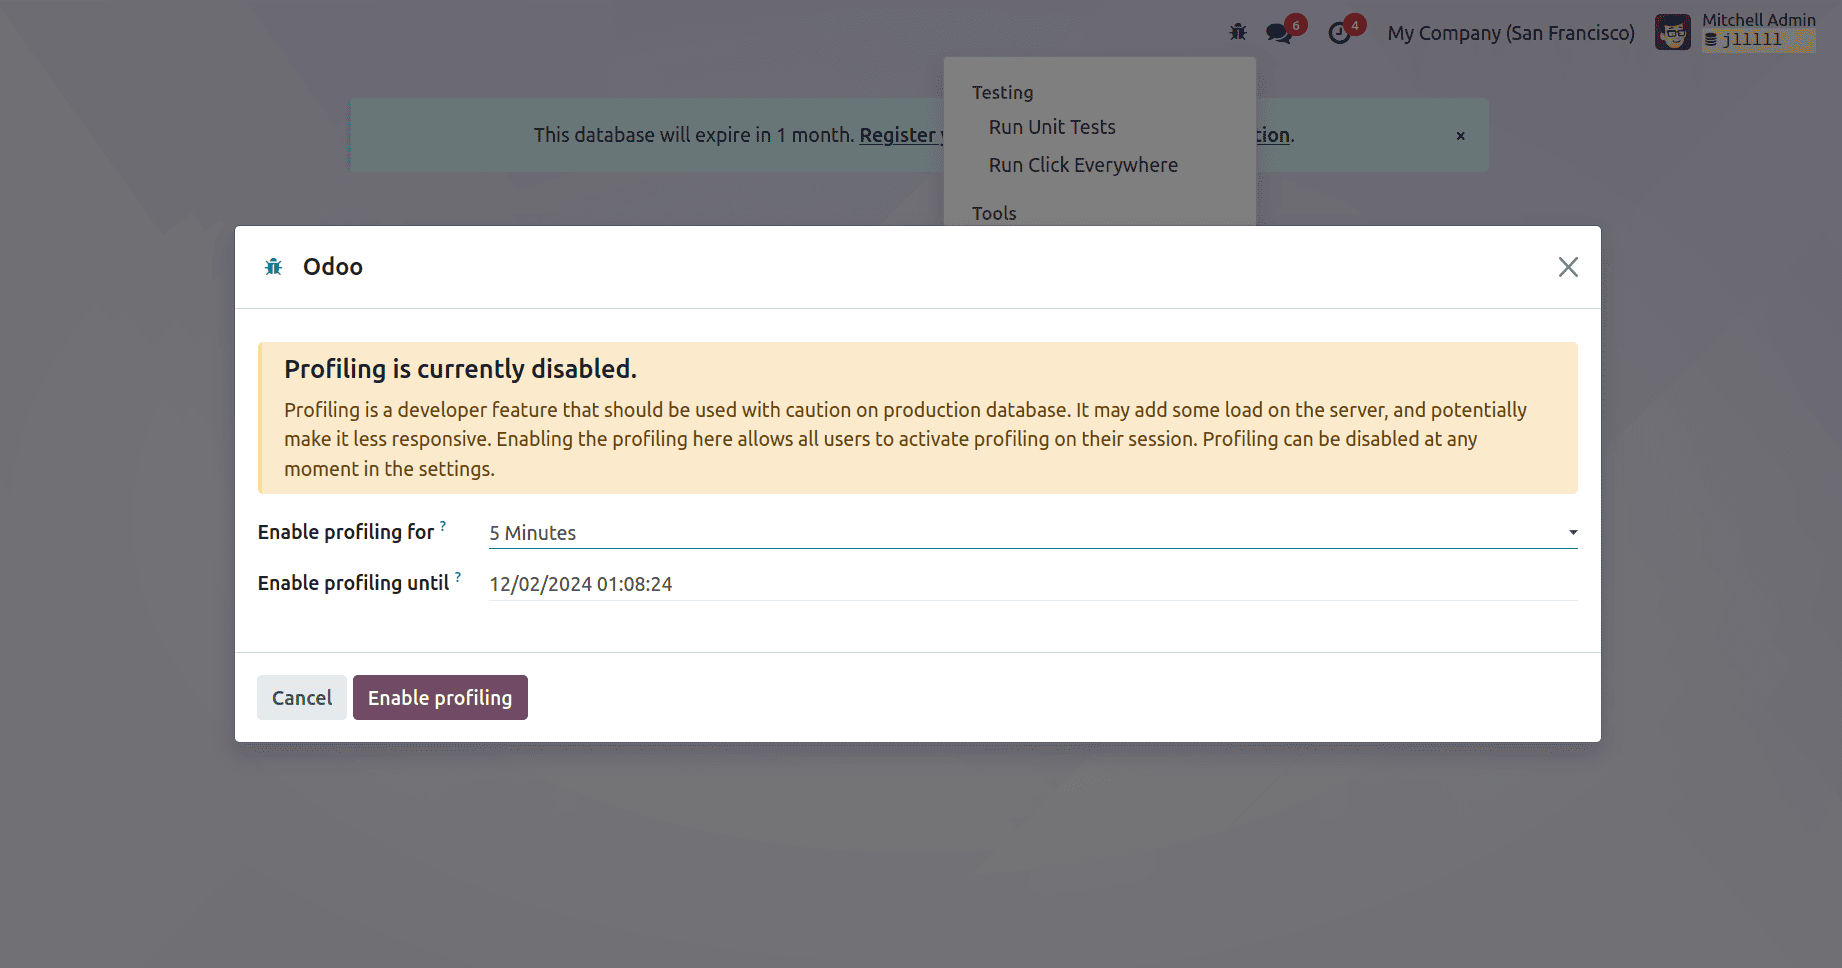
* Click Enable Profiling to start the session.
3. Activate Profiling for a User Session:
* In the same Debug Tools, toggle the Enable Profiling button for your session.
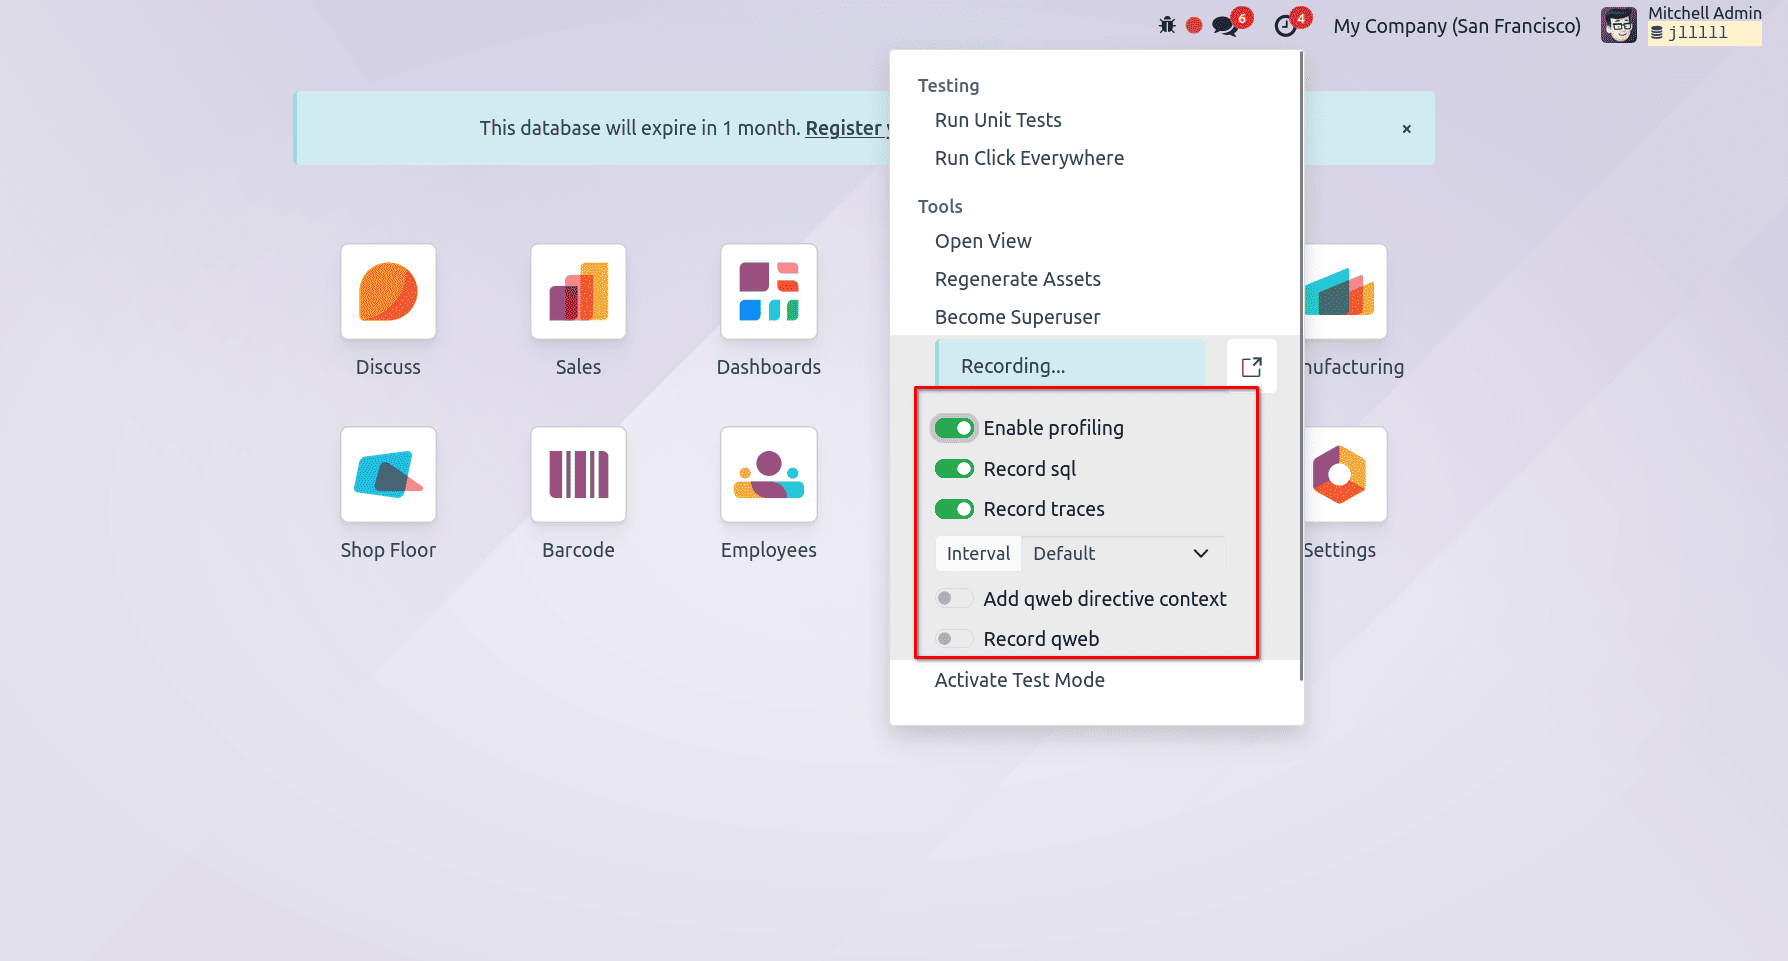
* You can enable additional options like:
1. Record SQL: Captures all SQL queries.
2. Record Traces: Captures periodic stack traces.
Profiling Results:
Once enabled, Odoo captures profiling data for all requests, saving it as ir.profile records. You can view and analyze these records from the developer tools.
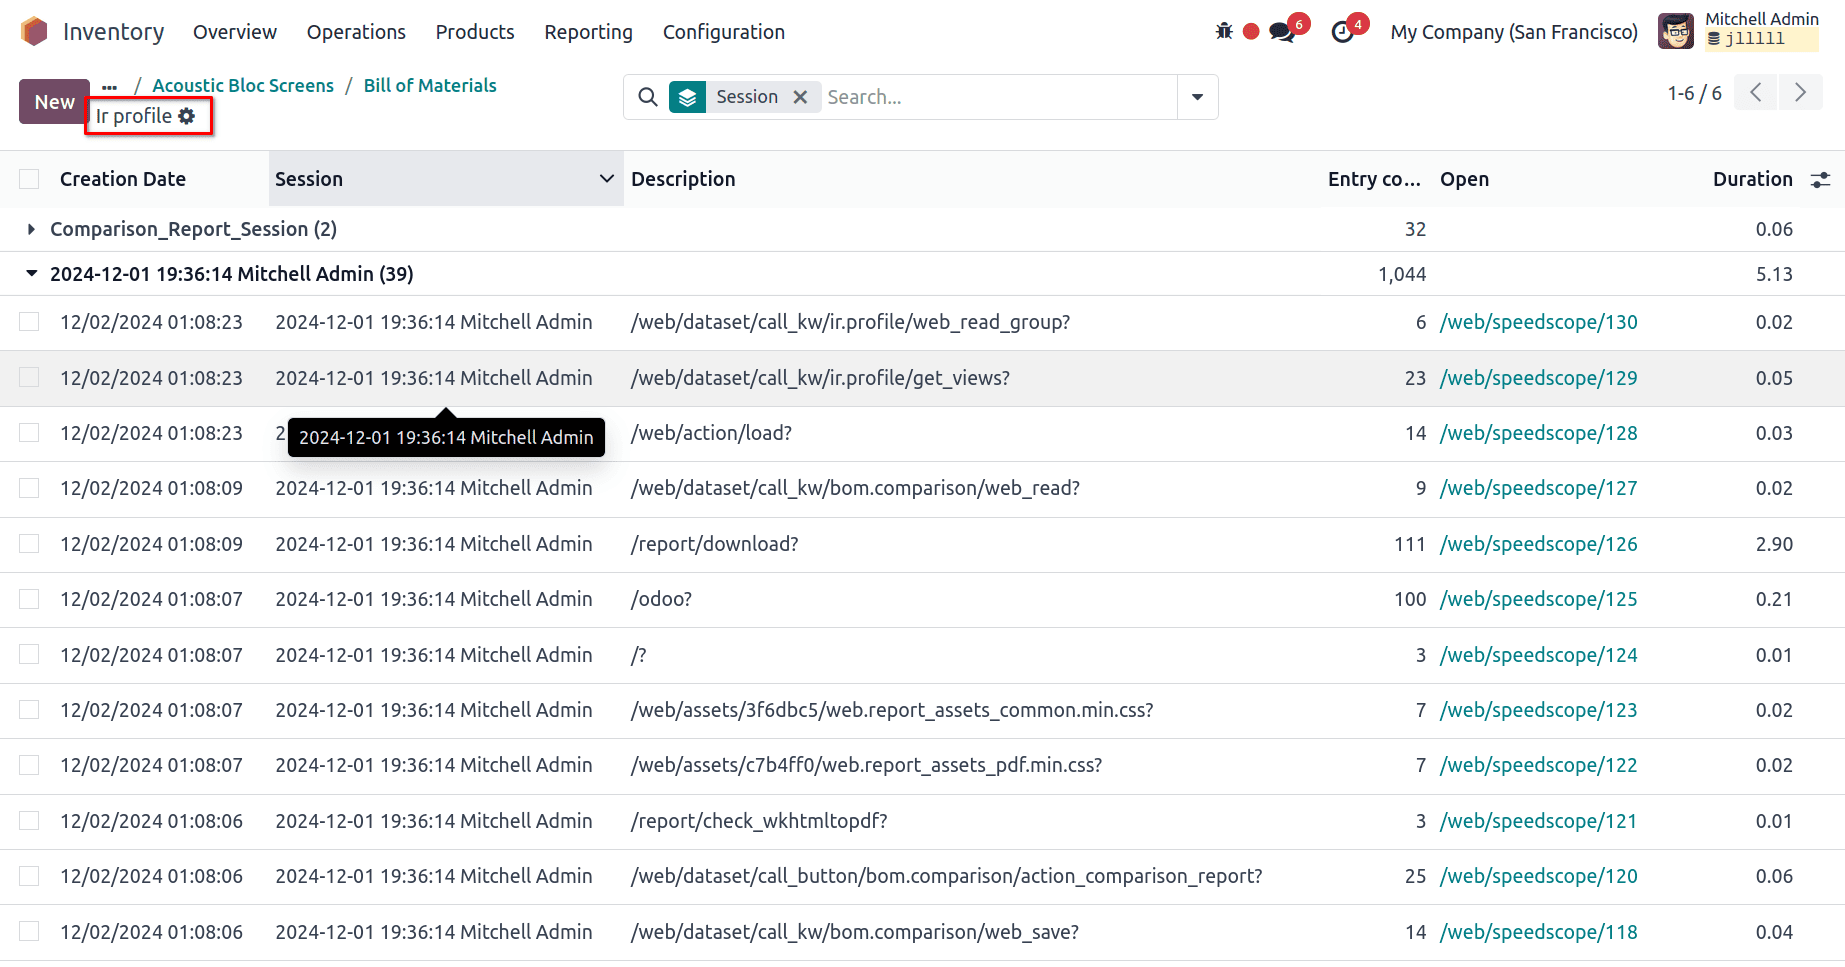
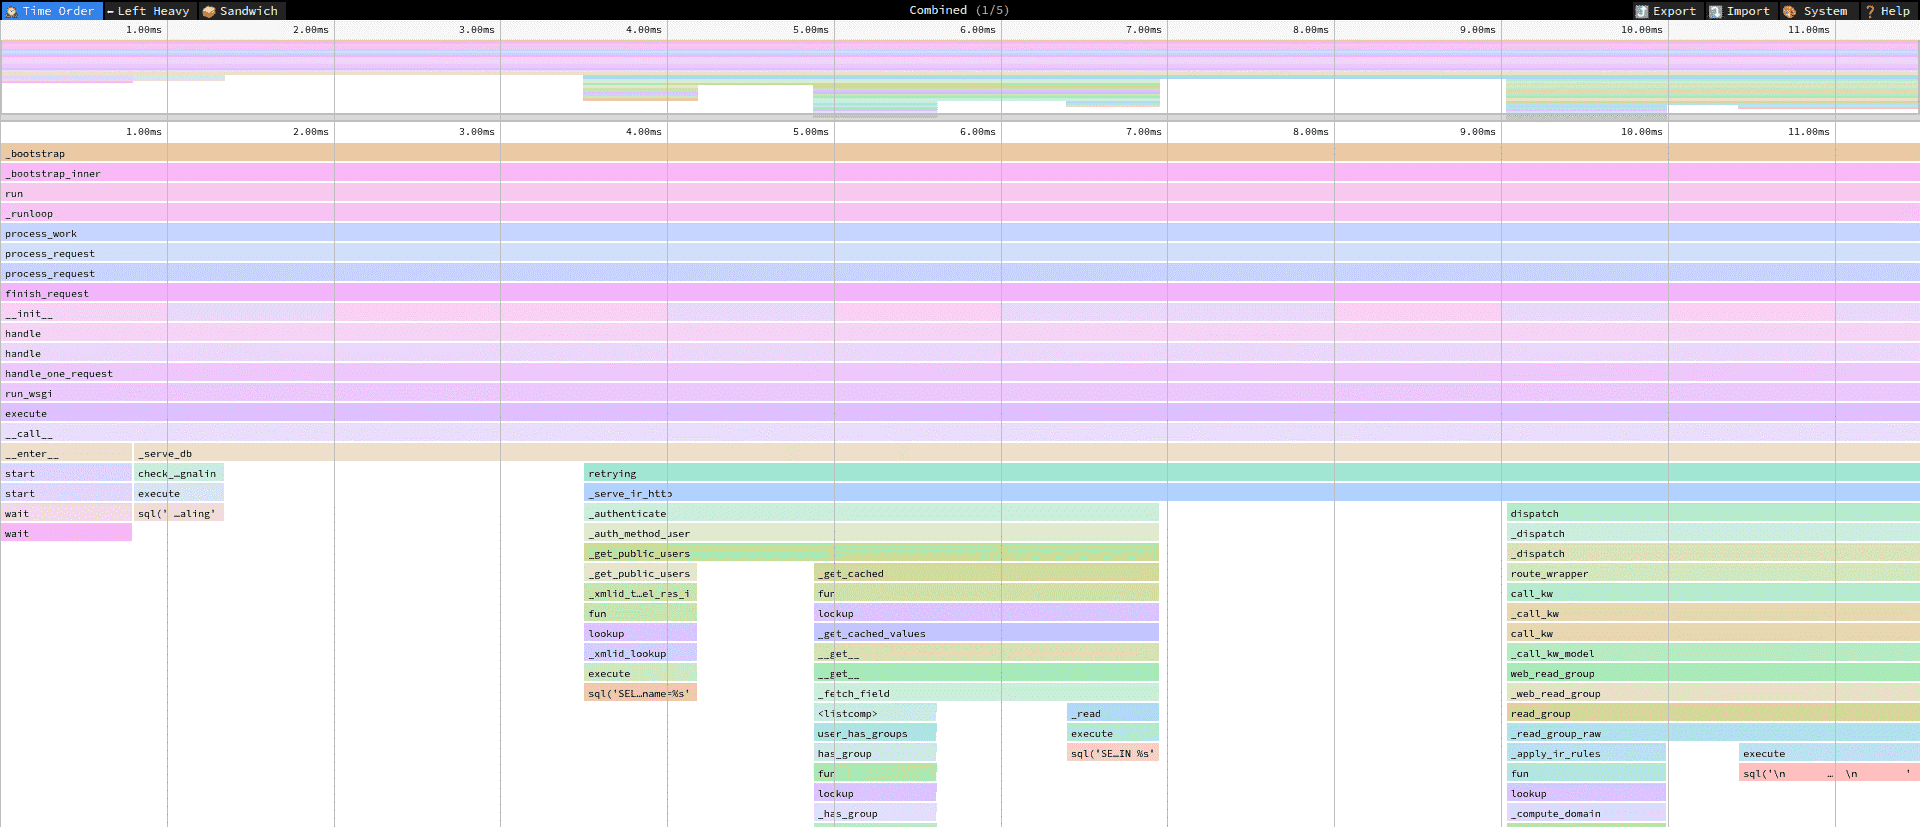
Furthermore, the profiling results can be visualized using Speedscope, a powerful tool that provides an intuitive graphical representation of performance data. Speedscope makes it easier to analyze and interpret profiling results, allowing developers to identify bottlenecks and optimize their code more effectively.
With Speedscope, you gain insights into execution patterns, pinpoint resource-intensive areas, and take actionable steps to improve overall performance. Its various views, like the Timeline View and Left Heavy View, make it versatile for analyzing different types of data and use cases.
2. Enabling Profiling from Python Code
For more control, you can enable profiling directly in your code. This method allows you to profile specific methods, test cases, or operations outside of web requests.
Using the Profiler in Code
from odoo.tools.profiler import Profiler
def action_comparison_report(self):
   """Action for the Report Generation"""
   with Profiler(
           description="Action Comparison Report",
           collectors=['sql', 'stack', 'callstack', 'periodic'],
           db=self.env.cr.dbname,
           profile_session="Comparison_Report_Session", disable_gc=True, params={'interval': 0.1},
           log=True
   ):
       data = {
           'form_data': self.read()[0],
       }
       return self.env.ref('bom_comparison_report.bom_comparison_report_action').report_action(None, data=data)
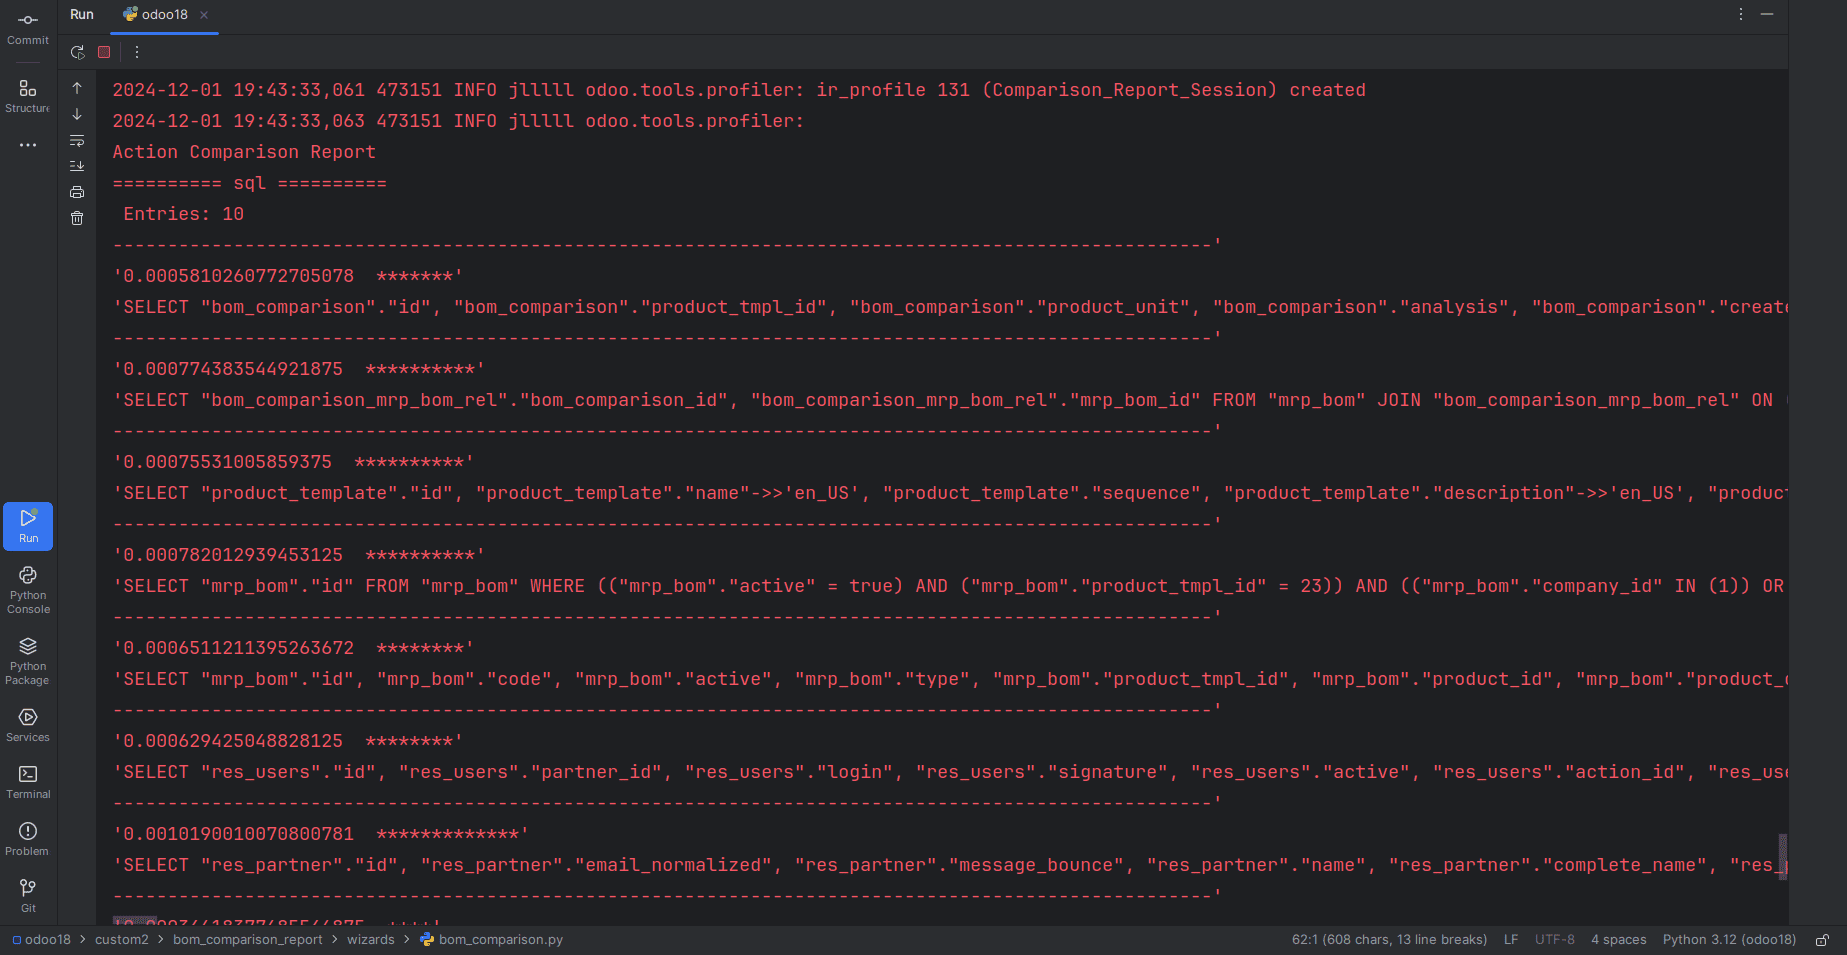
Below is an example of profiling logs generated during a session. These logs not only indicate the creation of a profiling session but also capture the SQL queries executed, their respective execution times, and their context within the application
Collectors Overview
Collectors determine what data the profiler captures. Odoo provides four collectors, each suited for different profiling needs:
| Name | Purpose | Key | Python Class |
| SQL Collector | Captures SQL queries and stack traces. | sql | SqlCollector |
| Periodic Collector | Samples stack traces at regular intervals. | traces_async | PeriodicCollector |
| QWeb Collector | Captures QWeb execution details. | qweb | QwebCollector |
| Sync Collector | Tracks all function calls and returns. | traces_sync | SyncCollector |
Best Practices:
* SQL Collector: Ideal for debugging query performance.
* Periodic Collector: Low overhead, suitable for performance analysis.
* QWeb Collector: Optimizes view performance.
* Sync Collector: Useful for debugging complex flows but not recommended for heavy profiling due to high overhead.
Graph Types in Profiling Analysis
After profiling, you can analyze results using various graph types in Odoo:
1. Combined View:
* Merges SQL queries and stack traces.
* Ideal for comprehensive performance analysis.
2. Combined No Context View:
* Similar to the Combined View but excludes execution context.
* Useful for isolating SQL or Python logic.
3. SQL (No Gap) View:
* Displays SQL queries sequentially, ignoring Python logic.
* Helps optimize database queries.
4. SQL (Density) View:
* Visualizes SQL query density with gaps for Python logic.
* Identifies areas where queries can be batched.
5. Frames View:
* Focuses on stack trace frames collected periodically.
* Useful for identifying high-execution areas.
Important Notes
* Performance Impact:
1. Profiling adds overhead, especially when using the Sync Collector.
2. Use lightweight collectors for minimal interference.
* Odoo Online:
1. Profiling is not available on Odoo Online databases.
Conclusion
Code profiling in Odoo 18 empowers developers to diagnose and optimize performance issues with precision. Whether you enable profiling through the UI for web requests or via Python code for specific tasks, Odoo’s profiling tools offer unparalleled insights into system performance. By leveraging collectors and analyzing profiling data through Speedscope, you can ensure your Odoo applications are optimized for speed, efficiency, and scalability.
To read more about An Overview of Code Profiling in Odoo 16, refer to our blog An Overview of Code Profiling in Odoo 16.