There are different types of views in Odoo, such as form view, list view, pivot view, etc.
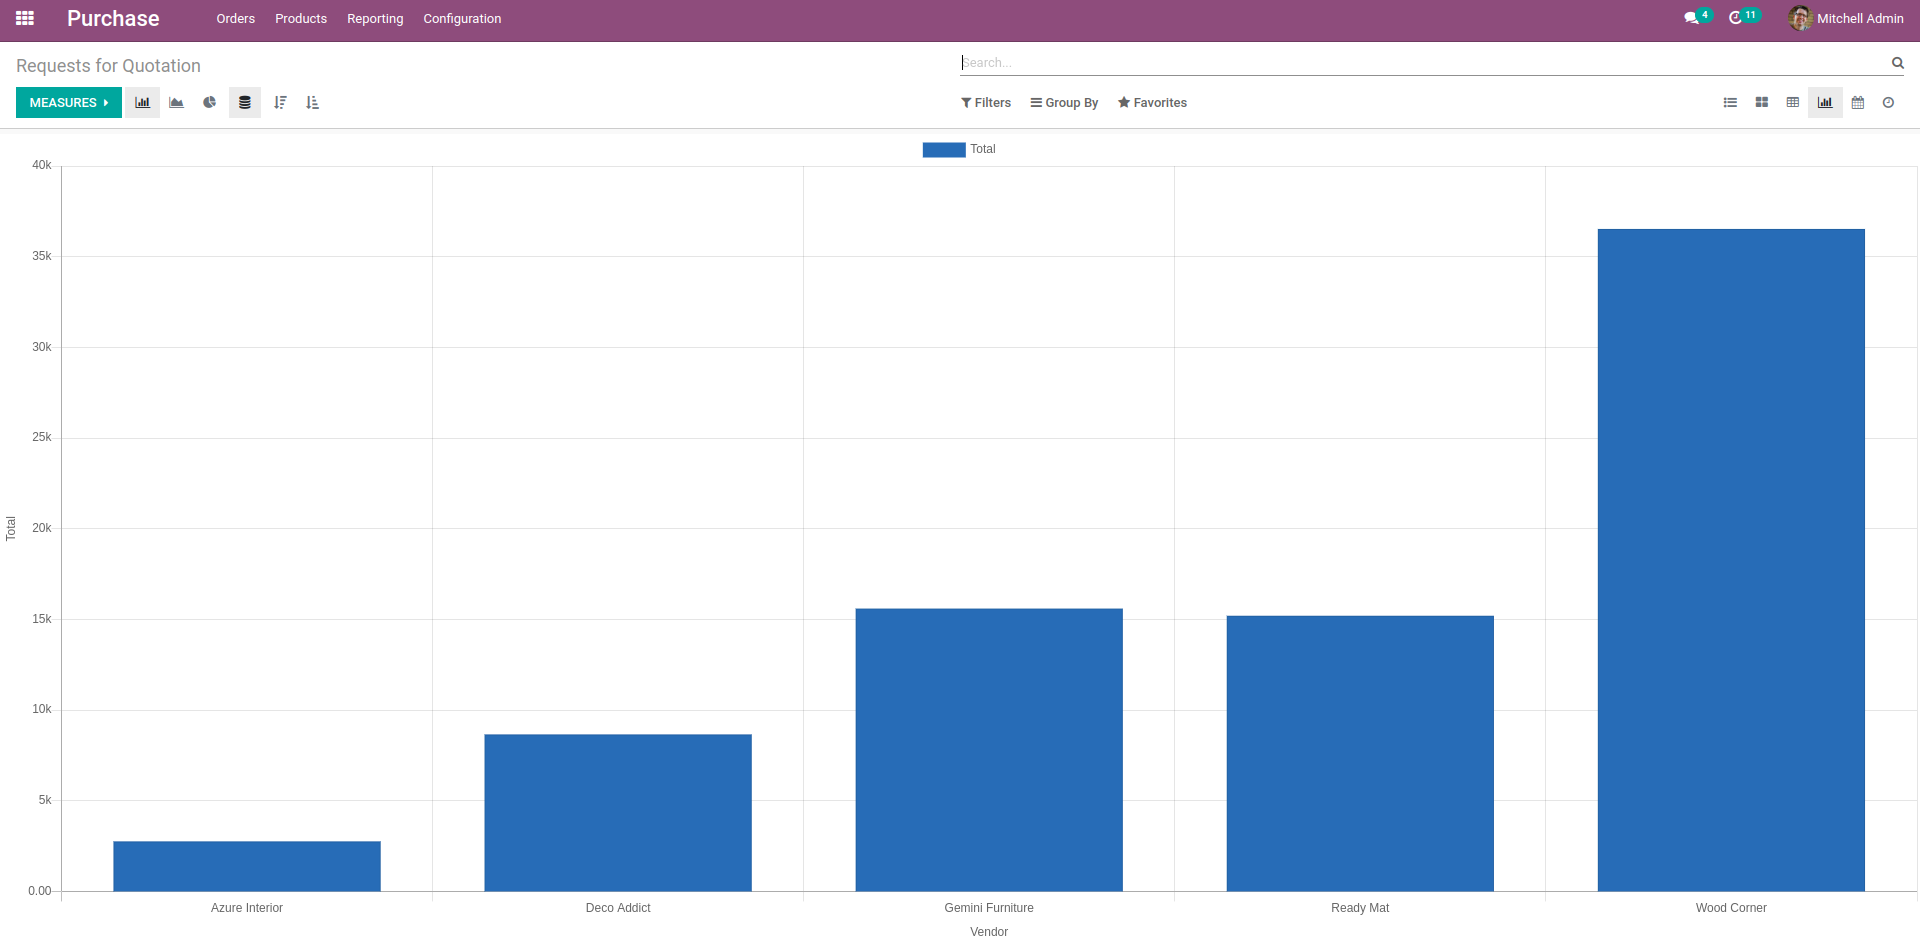
The graph view is a type of view in Odoo in which the data will be arranged and shown as a graph, which can be easily understood by the users. The graph view is a visual representation of data. The basic views in Odoo are List or Tree view, Form view, and Pivot view.
The image below is an example of a graph view in Odoo.

In Odoo, there are different attributes for graph view, which can be used to customize different features of it. In this blog, we are discussing the different attributes of the graph view.
1.string
It specifies the string that needs to be displayed as the label of the graph view.
<graph string="New Graph">
The string will be displayed as the title of graph view.
2.model
Specifies the name of the model in which the graph view is to be created.
<graph string="New Graph" model="sale.order">
In the place of ‘sale.order’ specify the model name.
3.type
It defines the type of graph to be displayed in the view, such as a bar graph, line graph etc.
The type of graph will be based on the type specified with the graph tag.
<graph string="New Graph" type="line">
Different types of graph are:
* line
* bar
* pie
* donut
* area
* scatter
* radar
We can specify these values with the keyword ‘type’ for the graph to display with the features and style of the different graph types.
4.domain
We can filter the graph view using the domain attribute based on different conditions.
<graph type="bar" model="sale.order" domain="[('state', '=', 'sale')]">The data that is required to display the graph will be filtered based on the condition specified inside the domain.
Here the graph view is created in sale.order and in the view only the confirmed sale orders will be displayed (ie: state is in ‘sale’). Likewise, we can provide multiple conditions and specify which data needs to be displayed in the graph.
5.sample
The sample attribute is used to limit the number of records that are fetched for plotting the graph. That is, when the view is loaded, the graph fetches the model records to display the graph. If the graph fetches data from a large database, it causes issues in displaying the graph. So the sample attribute limits the data loaded.
<graph string="New Graph" sample="1">
Here the sample is set to 1, so 100% data will be fetched. If the sample is set as 0.5 only 50% data will be fetched. Sampling helps in increasing the performance of the graph.
By sampling, we can reduce the number of data points in the graph.
6.stacked
The stacked attribute is used to determine whether the data of different categories should be displayed or stacked on top of each other, data or as side by side of each data.
<graph string="New Graph" type="bar” stacked="True">
7.disable_linking
This attribute is used to disable the linking of the data displayed in the graph view with the corresponding form or tree views.
That is, if disable_linking is set as 1 or True and if the user tries to click on the data of the graph to navigate to the corresponding record, it will not navigate to the corresponding form or tree view.
If it is set to 0 or not specified, the user can easily view the corresponding record of data shown in the graph view by just clicking on the graph.
<graph string="New Graph" disable_linking="True">
8.order
Order attribute is used to specify the graph data to be displayed in ascending or descending order.
<graph string="New Graph" sample="1" order="desc"
Specify the value as ‘desc’ for descending and ‘asc’ for ascending.
9.groupby
Using this attribute, graph can be grouped based on one or more fields of the model in which the view is specified.
<graph string="New Graph" type="bar" model="sale.order" groupby="team_id">
Here the field used with the groupby attribute is team_id. That is, the graph will be grouped based on the field team_id in the model sale.order. We can specify multiple fields in the groupby attribute by just separating the fields by a comma.
[eg: groupby=”team_id, user_id”].