In the dynamic landscape of data analytics, deriving meaningful insights from raw data is a paramount challenge. Power BI, Microsoft's business analytics service, offers a robust solution to this challenge through its powerful data transformation capabilities, primarily driven by Power Query.
In this blog post, we will explore the key concepts and steps involved in data transformation using Power BI, unraveling the potential it holds for analysts and business intelligence professionals.
Getting Started: Importing and Accessing Data
The journey begins with connecting Power BI to your data source. Whether it's an Excel spreadsheet, an SQL Server database, or a CSV file, the "Get Data" option in Power BI Desktop facilitates seamless connections. Once connected, the Power Query Editor opens, laying the foundation for data transformation.
Query Editor: A Comprehensive Toolbox
Query Editor within Power BI is a versatile toolbox that empowers users to perform a myriad of transformations on their data. It offers a clean, step-by-step interface, allowing users to visualize and modify each transformation applied to the dataset.
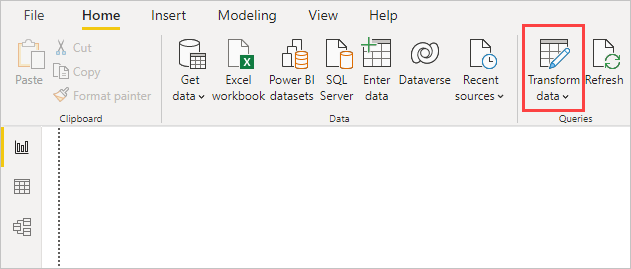
* To access Power Query Editor in Power BI Desktop, navigate to the "Home" tab and choose the "Transform Data" option.

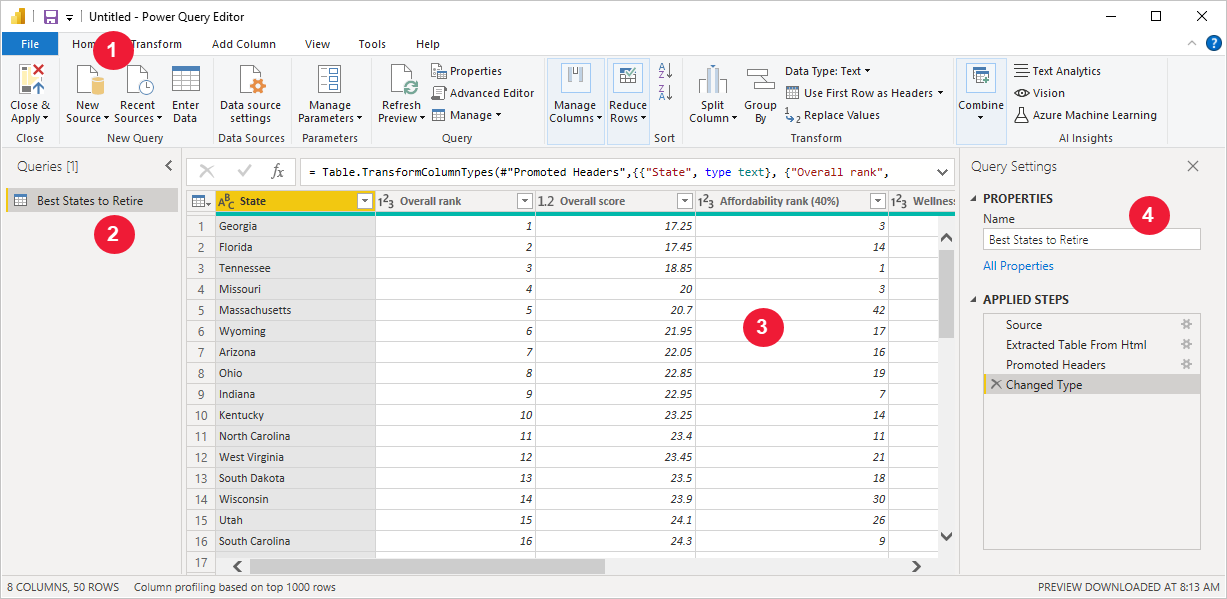
Upon loading a query in Power Query Editor, the interface becomes more dynamic and engaging. When connecting to a web data source via the "New Source" button in the top left corner, Power Query Editor retrieves information about the data, allowing you to start refining it.
* The ribbon now showcases numerous active buttons that facilitate interaction with the data within the query.
* On the left pane, a list of queries is presented, enabling selection, viewing, and shaping options.
* In the center pane, the data from the chosen query is exhibited, providing opportunities for further shaping and manipulation.
* The Query Settings pane is visible, detailing the properties and applied steps of the query.

Cleaning and Shaping Data:
Data cleaning is a critical step to ensure accuracy in analysis. Power BI's Power Query Editor provides intuitive tools for this purpose. You can easily remove unnecessary columns, filter rows based on specific criteria, and sort or group data as needed. Additionally, adjusting data types to match the nature of the information is crucial for precision.
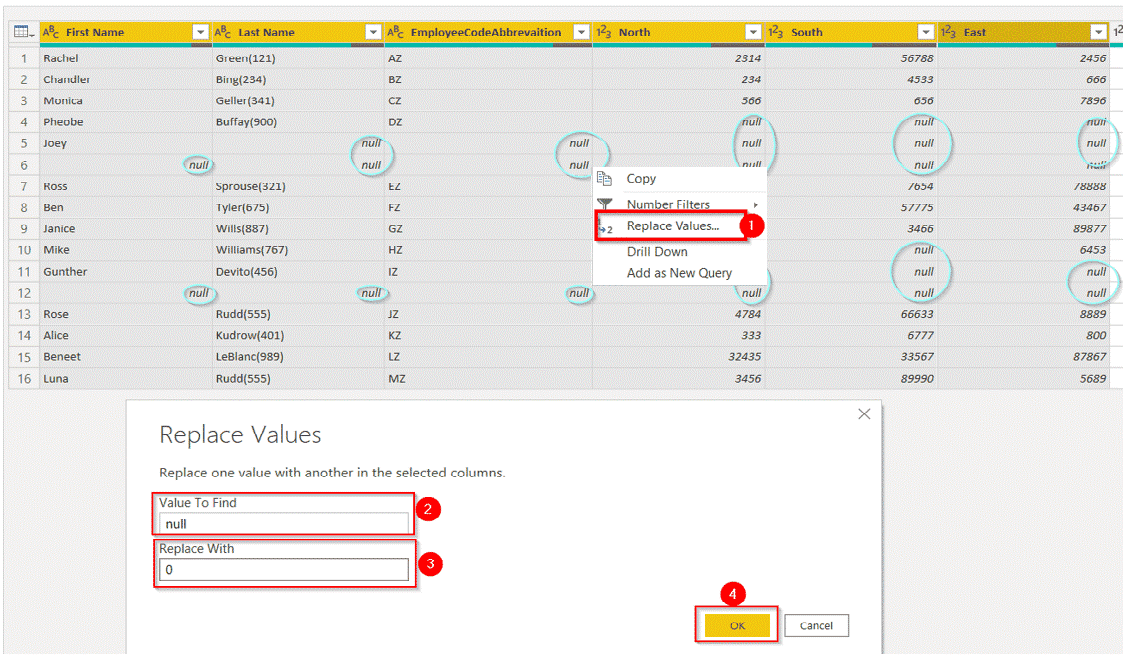
Replacing values is another handy feature in data cleaning. Power BI allows you to replace null or undesired values with appropriate ones, ensuring that your dataset is devoid of inconsistencies.
* Choose all the columns in which you wish to substitute the "Right-Click" value for any row that contains a null value. Opt for the "Replace Values" option.
* It prompts you to specify the specific value you intend to use as a replacement.
* Following that, proceed to set the desired replacement value.
* Then click on OK.

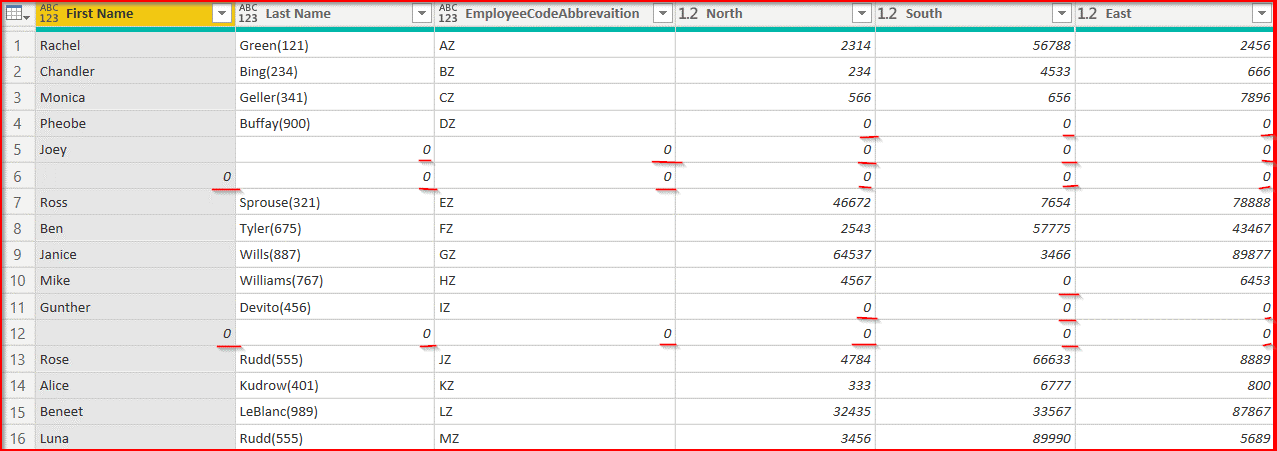
* Observe the outcome: all instances of null values have now been substituted with the value 0.

In conclusion, mastering data transformation in Power BI is a key skill for anyone looking to derive meaningful insights from their data. The Power Query Editor provides a user-friendly interface for essential tasks such as cleaning, shaping, and enriching data. With advanced features, custom scripting options, and integration with DAX formulas, Power BI empowers users to prepare their data for effective reporting and visualization.
By following the comprehensive guide outlined in this blog post, you can navigate the data transformation process in Power BI with confidence. Whether you are a beginner or an experienced user, harnessing the full potential of Power BI's data transformation capabilities will undoubtedly elevate your analytics and reporting endeavors.
To read more about key features of Power BI, refer to our blog Top 5 Key Features of Power BI in 2024