To streamline the subscription management process, you need to track the functions played by the subscription to your business that is constituted by the practical reporting analysis. Through reporting research, a business can be perfectly followed and analyzed its performance chart, and it can undergo stability and growth. In the 21st century, every company follows the reporting framework. It makes a statistical analysis to understand the company's turnover and weaknesses beyond its performance in every department.
With the emergence of Enterprise Resource Planning (ERP), business operations are desired to move in an automated pattern synchronized with different functions. The Odoo 15, which is the latest version of Odoo ERP with its versatility and adaptability, and scalability with comprehensive features, makes your business management in an organized pattern. In Odoo 15 Subscription module, in the enterprise edition, the reporting is differentiated into different stages and manages your further activities in various departments in a modular paradigm that can be interconnected with a one-stop solution software management.
For a company's stable growth to get its revenue, you need to make reporting management that gives you the statistical analysis in numerical value with its precise and accurate margin. The owners, managers, and executive officers can get a detailed statistical view of their output in each department with the Odoo 15 subscription. With this Odoo ERP, you can handle multiple operations under a singular platform, taking appropriate decisions and providing accurate methodologies and solutions with the reporting management system.
This blog explains how reporting management is streamlined in Odoo 15 Subscription in the enterprise edition with different stages of analysis with quick access.
Reporting
The primary feature of every module in the Odoo ERP is the reporting feature, where you get a deep analysis of the work scheduled by each person in each department. And also vice versa deep analysis.

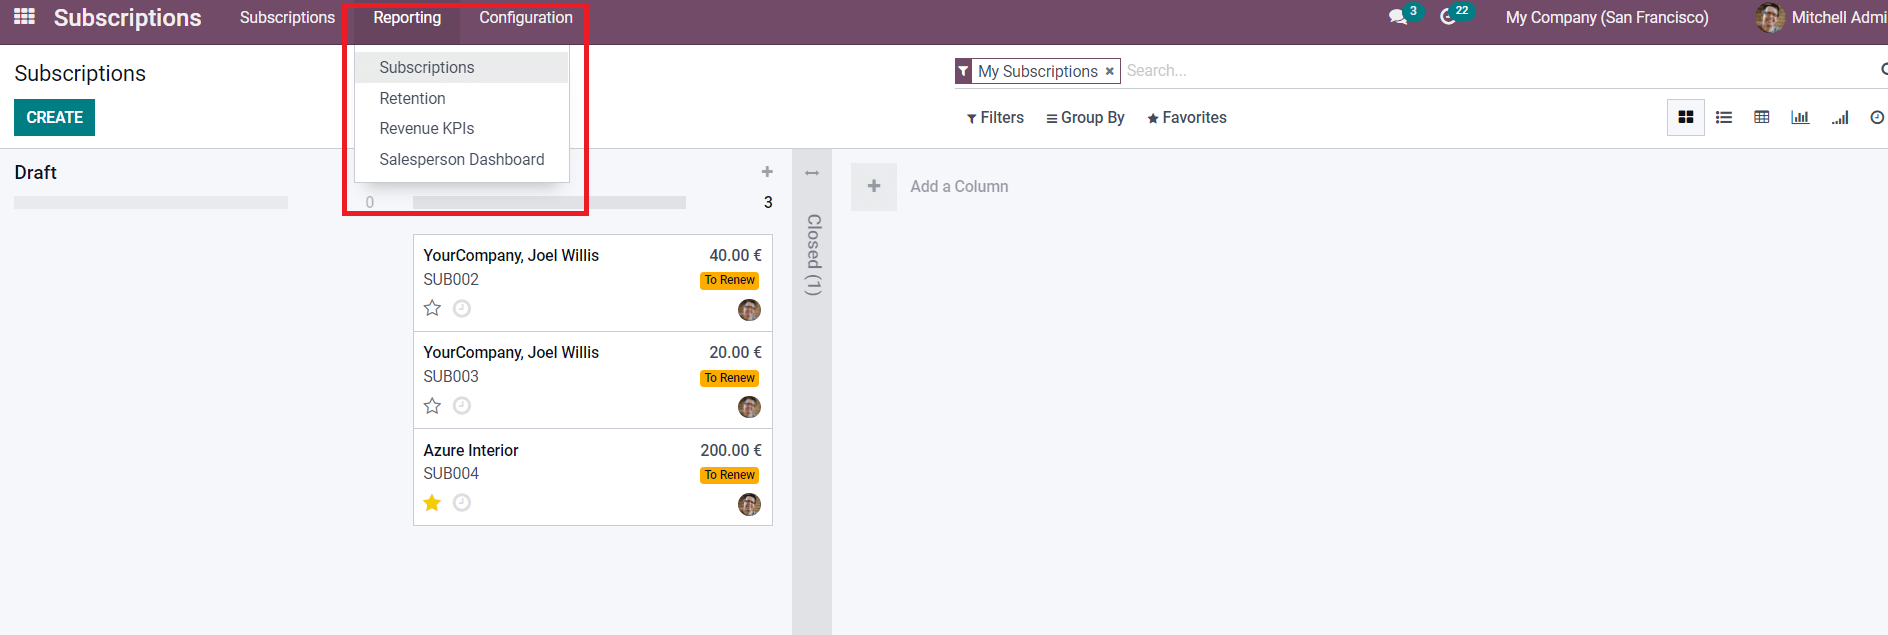
In the above screenshot, under the Reporting tab, in the Subscription module in Odoo 15, you can get a brief idea of Subscription Analysis, Retention Analysis, Revenue KPIs (Key Performance Indicator), and Salesperson Dashboard analysis.
Subscriptions Analysis
By clicking on the Subscription from the Reporting tab, you can get a detailed subscription analysis report.

From the above screenshot, you can get a pivot view of subscription analysis by adding all the contents involved in MEASURES. You can also get different views like cohort and graphical views under subscription analysis. You can even get a customized report by adding the Filters, Group by, and Favorites options and get the result. From the result, you get the monthly subscription and yearly subscription report. By clicking on the icon near to measures, you can get a flip axis report and click on the expand all, and you can get the details in a spreadsheet by just clicking on the icon. You get a downloaded format of further information in a spreadsheet.
Retention Analysis

Here in the above screenshot, you get a result of a report in Retention Analysis. As seen in the screenshot, the report is obtained by cohort mode. You can also get the report in graphical and pivot view. In graphical view, you get the reports by bar diagram, pie chart, line graph, and stacked forms. And in graphical views, you get advanced and customized reports with the function of filters, and with the favorites option, you can add quick access to report analysis. You can add different MEASURES options in the pivot and graphical view and get the report as your requirement. You also get various reports daily, month, week, or year. And also, by clicking on the icon of download, you get the report downloaded in the spreadsheet form.
Revenue KPIs

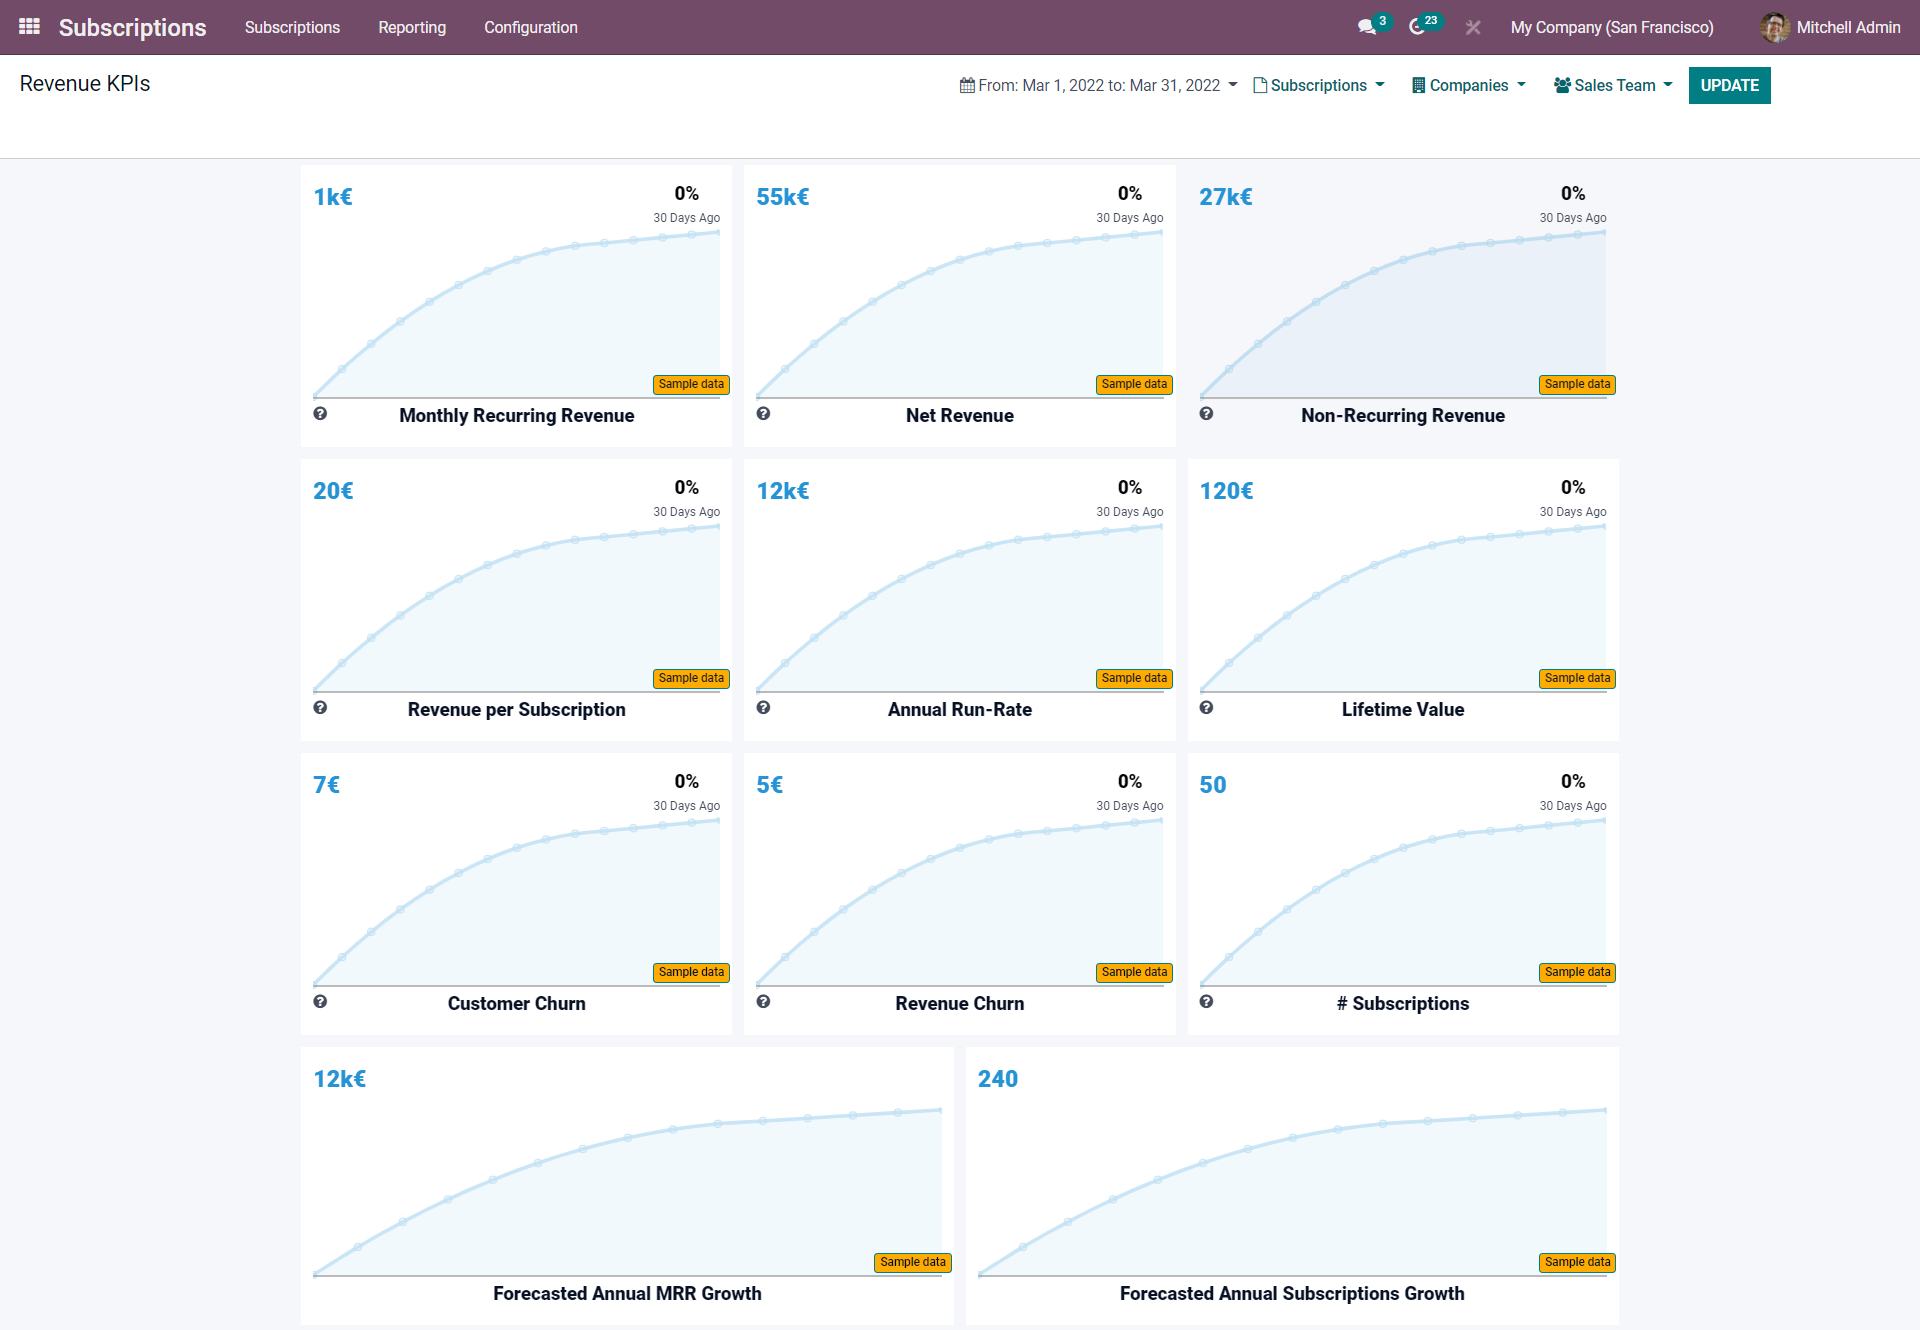
From the above screenshot, you can understand that in Revenue KPIs, you get a detailed analysis in a graphical representation of the (KPIs) key performance indicators of the company’s revenue. As we are familiar with the business, the motive of every business person is to get the revenue the doubled number of the capital they invested. They need to get a detailed statistical report of their work market. In Revenue KPI, as seen in the screenshot, you receive the value of Monthly Recurring Revenue, Net Revenue, Non-Recurring Revenue, Revenue per Subscription, Annual Run-Rate, Lifetime Value, Customer Churn, Revenue Churn, #Subscriptions, Forecasted Annual MRR Growth, Forecasted Annual Subscriptions Growth.
You get these invoice line entries daily or customize them to get the report monthly or yearly. By observing the Revenue KPIs at the period of the financial year, you can recognize the revenue of your business. By analyzing these, you can explore the weak point or dry end of the revenue marked and the peak point where it is obtained. You can know different companies where the subscription is sustained and salespeople who have focused on the revenue. By clicking on the UPDATE, you get the latest revenue report.
Salesperson Dashboard
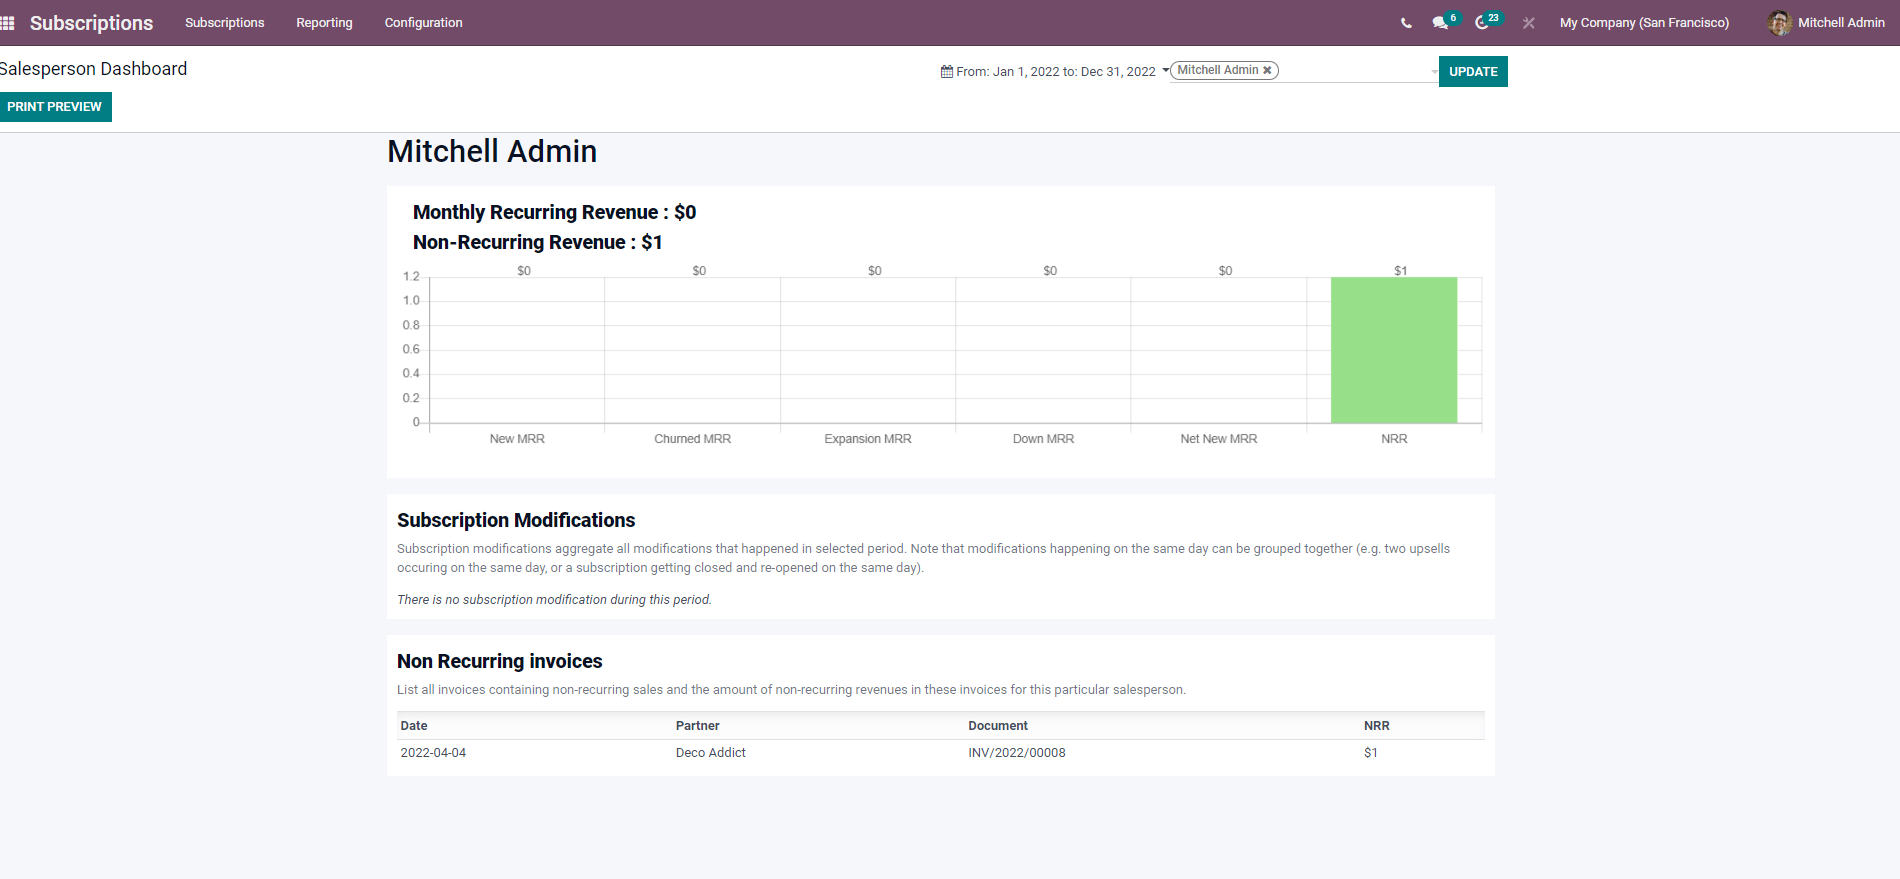
From the below screenshot, you get a detailed analysis of the specific salesperson who has worked during the particular period and contributed revenue to your business. You can get the report of a particular day or month whether the salesperson worked by clicking on the Reporting tab from the Odoo 15 Subscription. And you get the report of the revenue they contributed to your business.

At the end of this blog, we have given you detailed information based on the reporting features of the Odoo 15 subscription. You can get a clear overview of the revenue of your business market, and you can lead the first position with your competitor. You get a picture of the salesperson who has contributed a hike in the market. Thus Odoo 15 Subscription makes your work easier and consumes your time for the better progress of your business.