Debugging is the process of identifying and fixing programming errors. Techniques such as problem simplification, unit testing, bug clustering, backtracking, control flow analysis, coordinated testing, and profiling are examples of effective debugging methods. Most programming and development tools come with built-in features to assist with debugging. Despite the common occurrence of programming errors, it is crucial to focus on efficiently eliminating them. Debugging is vital for ensuring software functions correctly. Various debugging tools are available for Odoo development.
ENABLING DEVELOPER MODE
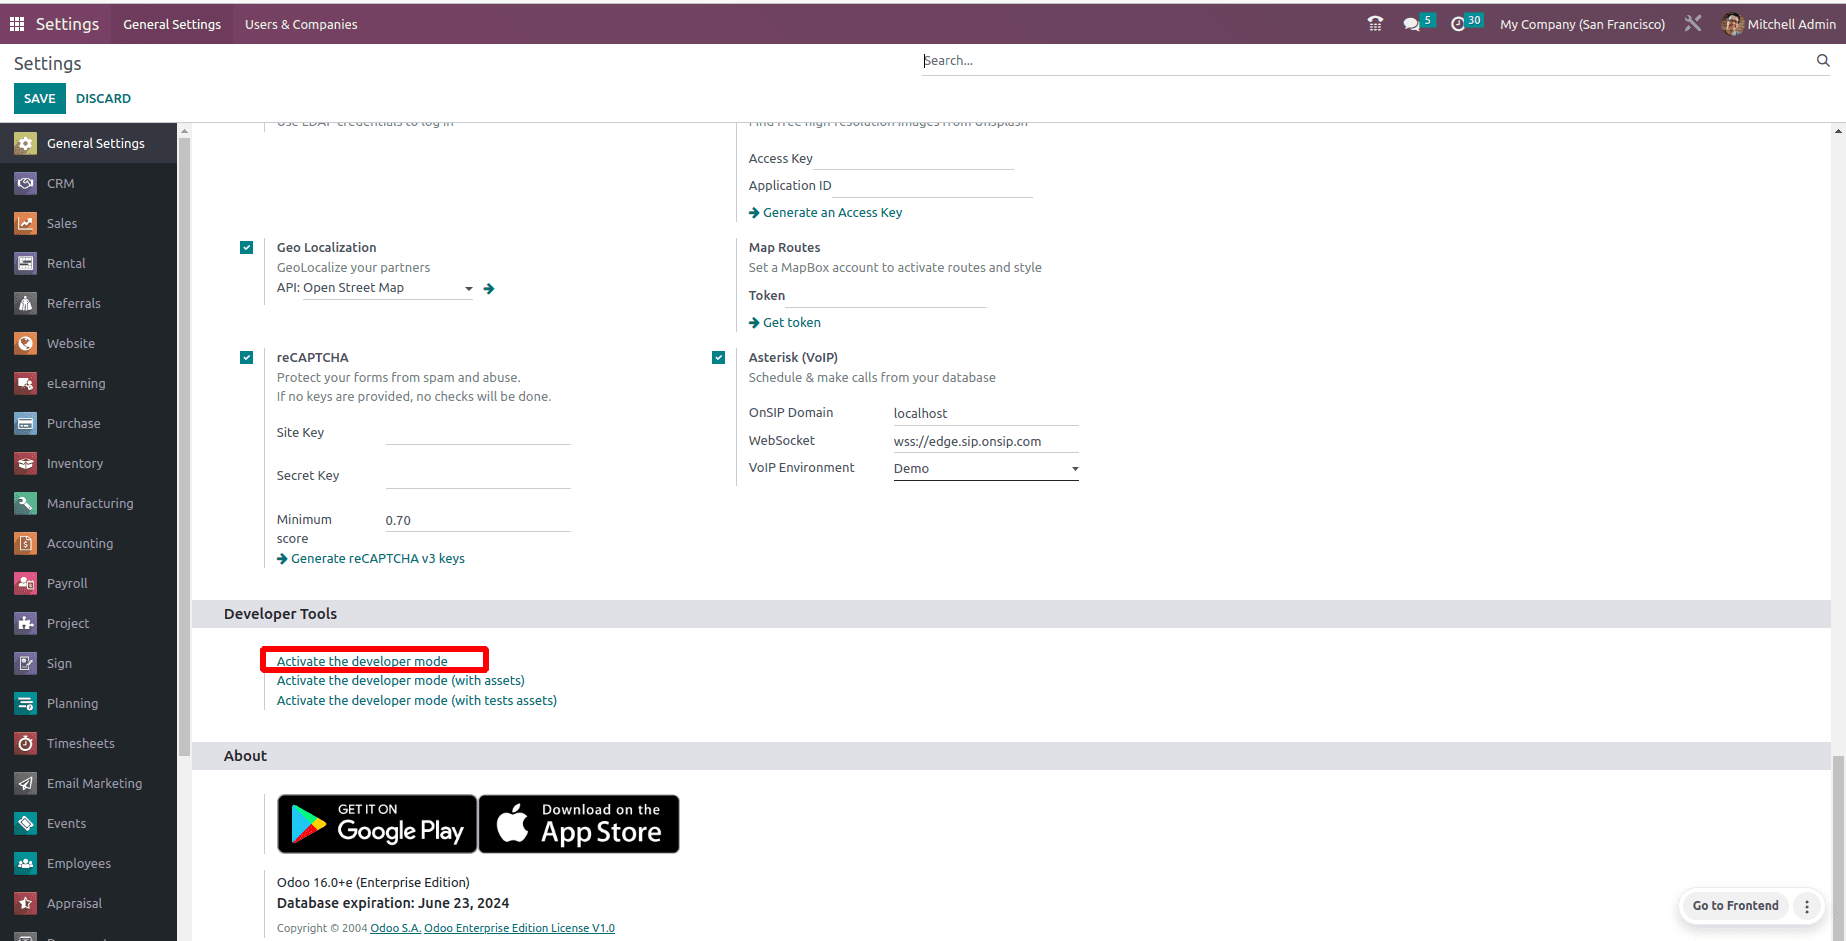
A developer or administrator can use the developer mode tool to obtain technical data about the system. When you navigate the interface in developer mode, Odoo displays additional information on the screen and grants access to certain technical functions. Here's how to activate developer mode in Odoo ERP.
Go to Odoo interface > Settings > scroll down
Once developer mode is activated, hovering your mouse pointer over a field will display information related to that field, as demonstrated in the screenshot below.
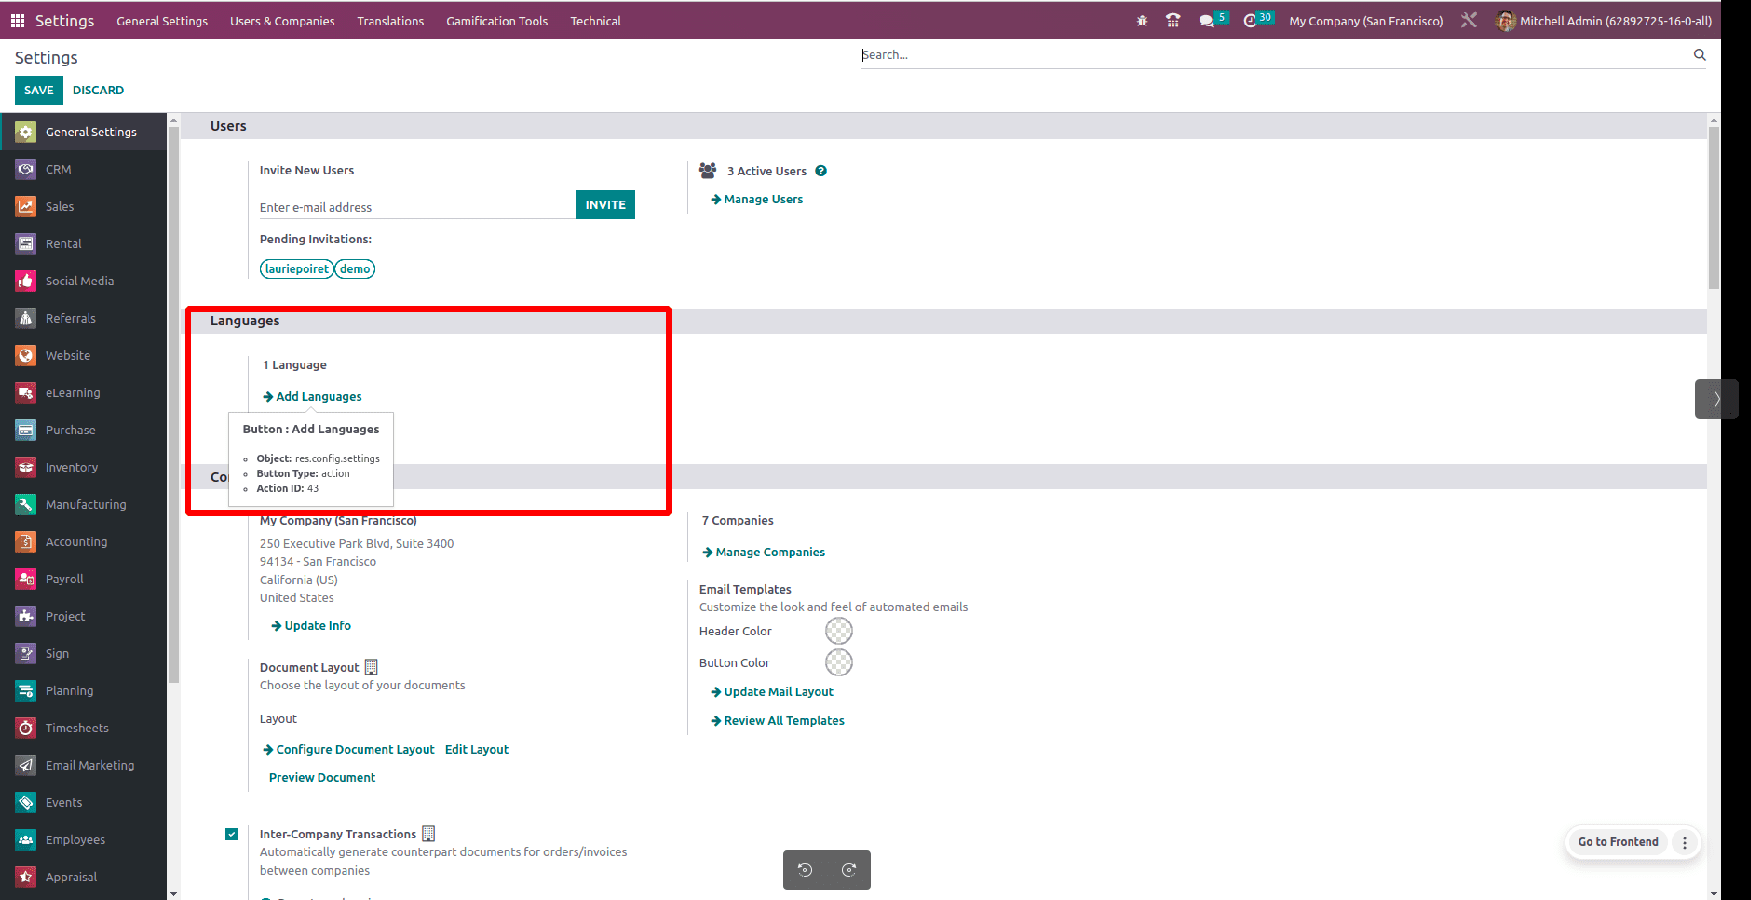
We can now view details such as a model name, action ID, button type, and many others. To simplify this process, we can enable developer mode with Chrome and Firefox add-ons, like the Odoo debug add-ons. These add-ons can be found on the Chrome Extensions page. For more advanced Odoo debugging, developers can use the terminal to execute debug commands as a regular user rather than as root.
/usr/bin/odoo.py --log-level=debug
PYCHARM DEBUGGER
Another way to understand our code's flow is by using the PyCharm debugger. PyCharm offers a highly efficient method to debug the process as it runs. For more details, check out our blog post about the PyCharm debugger.How to Use Pycharm to Debug Your Code
ODOO DEBUGGING USING PYTHON PDB PACKAGE
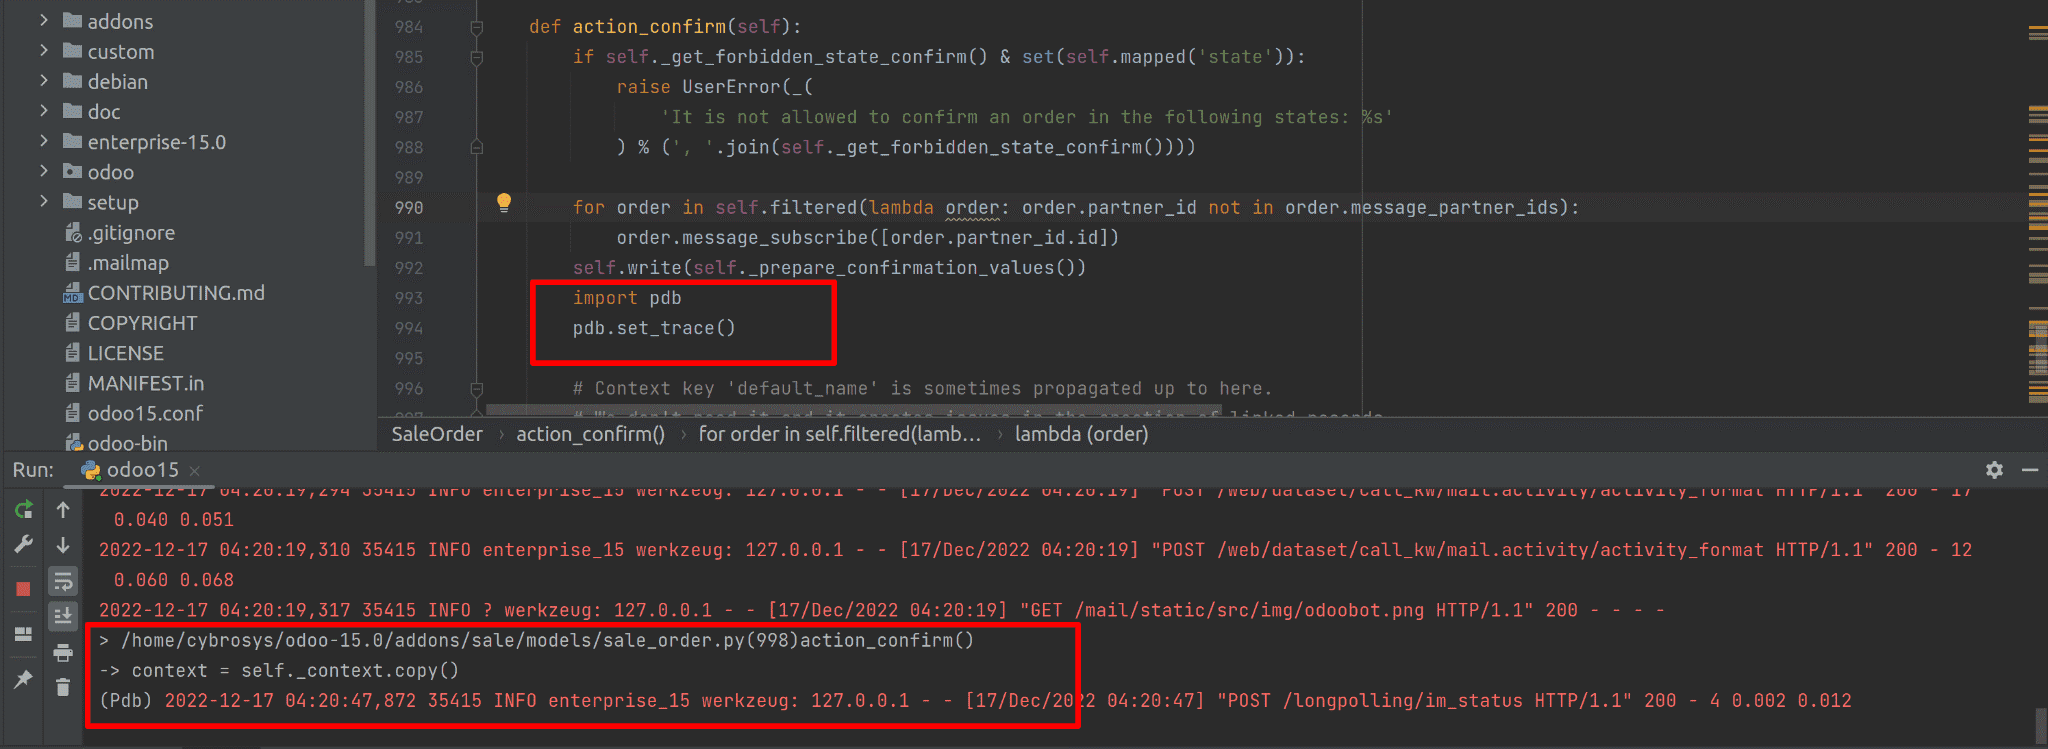
The pdb package offers an interactive debugging tool for Python scripts. It features the pdb class, which can be recognized in the source code and facilitates setting conditional breakpoints and stepping through code line by line. To use this, you can insert two lines into your script: import pdb and pdb.set_trace(). When the execution reaches this point, it will pause. Let’s illustrate this with the following screenshot.
Let's retrieve the values or arguments of any currently active function.
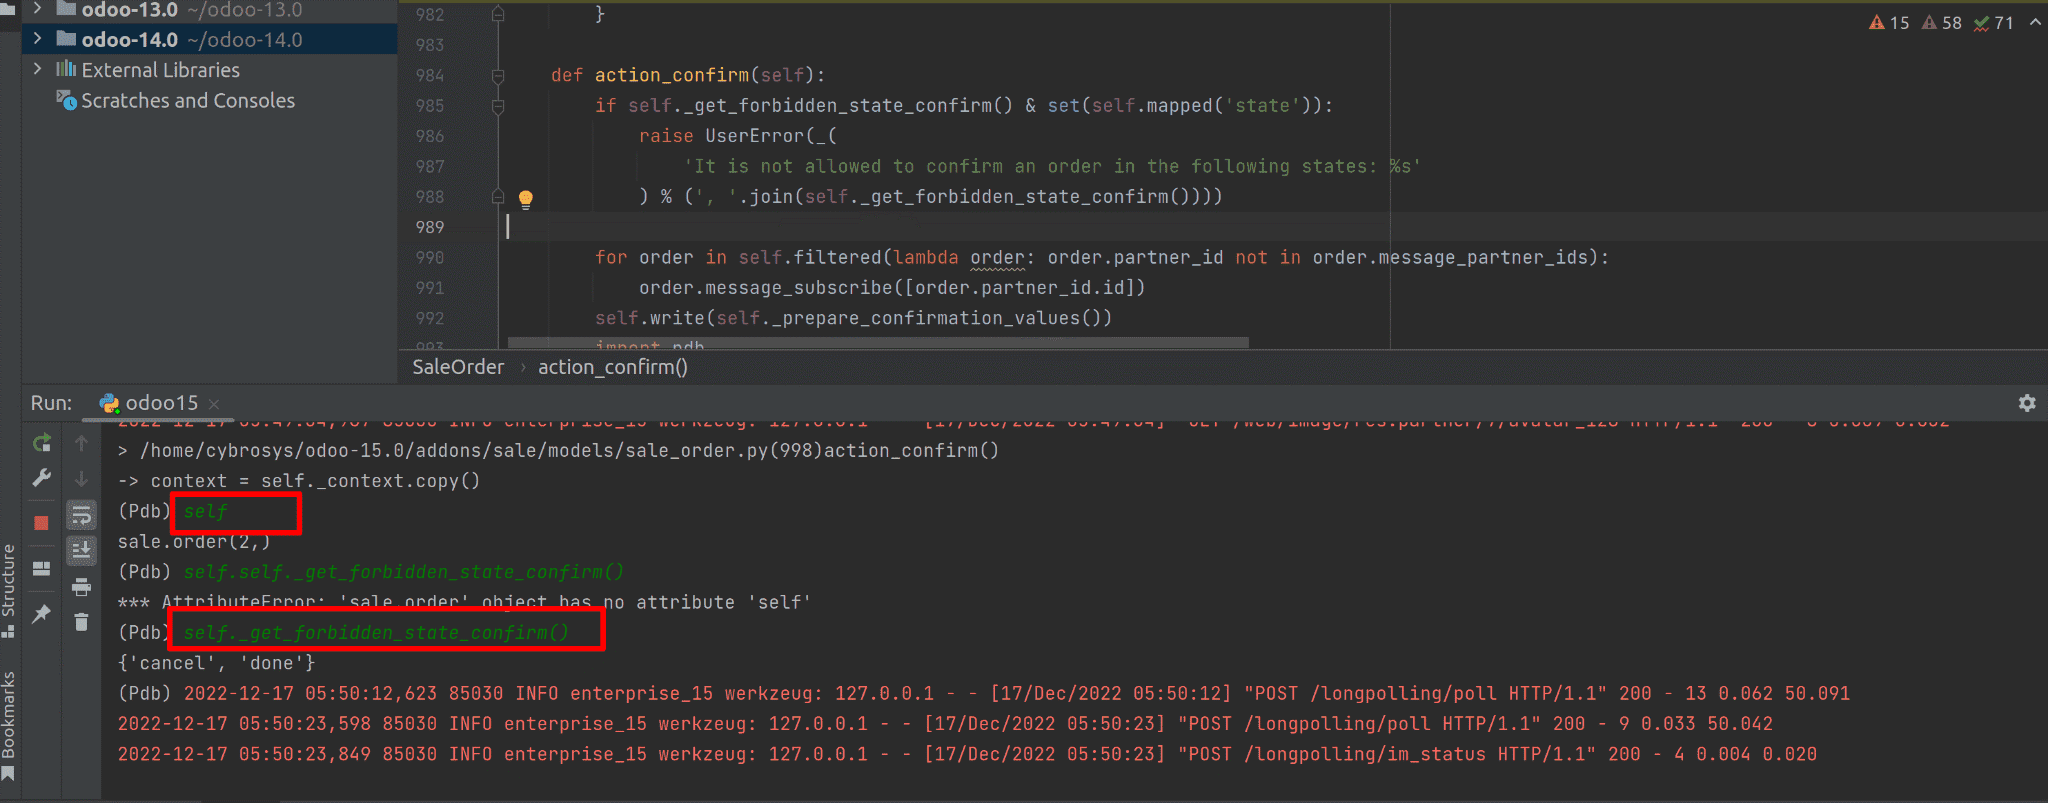
When we identify ourselves and return a function, we can retrieve the relevant record ID along with the return value of the function, as demonstrated in the example. To pause execution at a specific point in our program, we can utilize set_trace(). Moreover, for debugging purposes, pdb.run() offers a straightforward method. The function pdb.runcall(function, *args, **kwds) enables us to execute a function with specified arguments. A common misconception among developers is that the print() function in Python can serve as a debugger. However, print() merely displays the value of an expression after it has been evaluated in the current context.
To read more about How to Debug When Odoo Server is Down, refer to our blog How to Debug When Odoo Server is Down.