In software development and programming, debugging is the process of distinguishing and fixing out bugs. Debugging methodologies include problem simplification, unit testing, clustering of bugs, backtracking, control flow analysis, coordinated testing, and profiling. Most programming and programming advancement gadgets offer projects to support debugging. While programming bugs are quite natural even if we try our maximum effort we must focus on removing them efficiently. Debugging is important for the efficient running of software. We can utilize various debugging tools for Odoo development.
Enabling developer mode
Developer mode is a tool that is used by a developer or administrator to get technical information about data. By activating developer mode Odoo will give you much more on-screen data as you explore through the interface, It grants access to technical features of odoo. Let us see how to enable developer mode in Odoo,
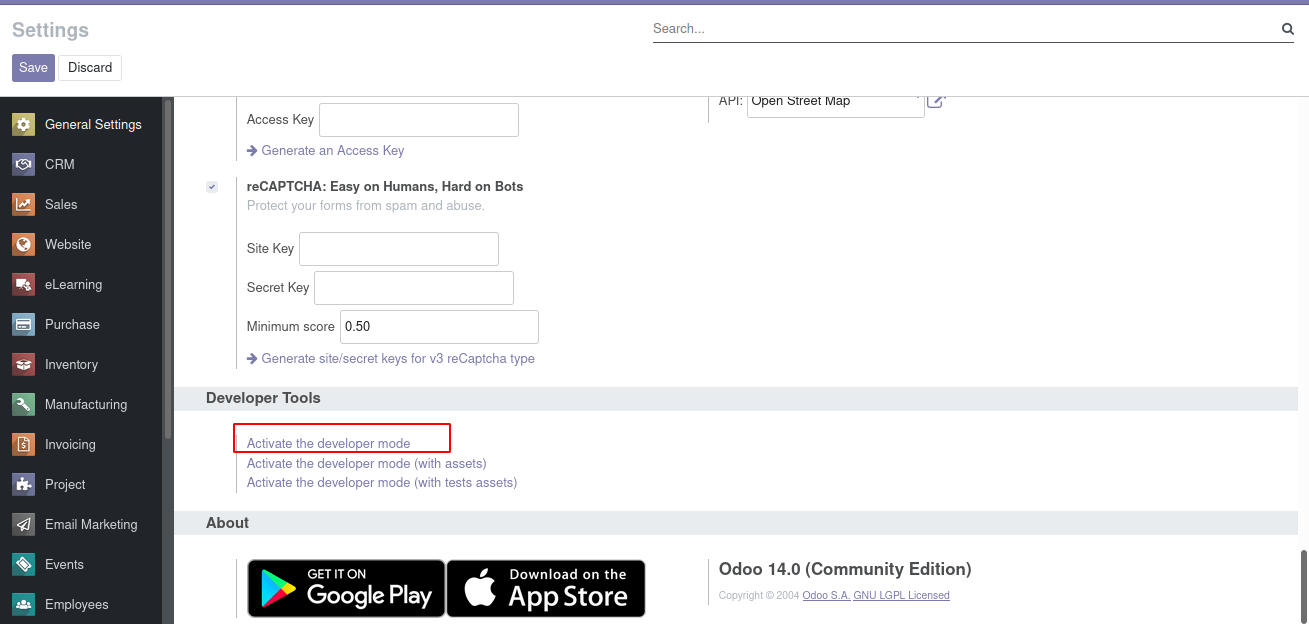
Go to Odoo interface > Settings > scroll down

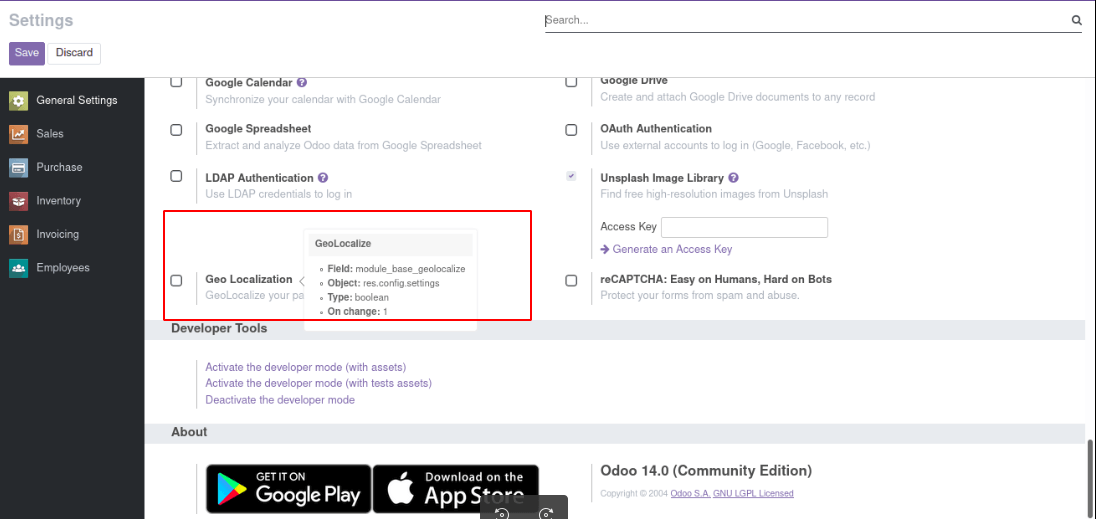
Now we can activate developer mode, and upon activating developer mode when you place the mouse pointer over the field you will be depicted with the information of the respective field as depicted in the following screenshot.

Now we can see the field name, Model name, field type, and many more aspects regarding a field. We can enable developer mode in a simple way by using add-ons for Chrome and Firefox. By navigating to the chrome extensions we can download the odoo debug add-ons which is more time-consuming for the developers to work in developer mode. Moving to the advanced odoo debugging, developers can run debug using the terminal also. For eg: You should do it as a normal user (no root)
/usr/bin/odoo.py --log-level=debug
PyCharm debugger
Pycharm debugger is another method to identify the flow of our code. Pycharm provides a very efficient way to debug the process during execution. To know more about pycharm debugger refer to our blog How to Use Pycharm to Debug Your Code
Odoo Debugging Using Python PDB package
The package pdb gives an interactive source code debugging tool to enhance Python programs. It enables setting conditional breakpoints and single stepping at the source line level; it is specified as the class pdb which can be easily recognized by reading the source.
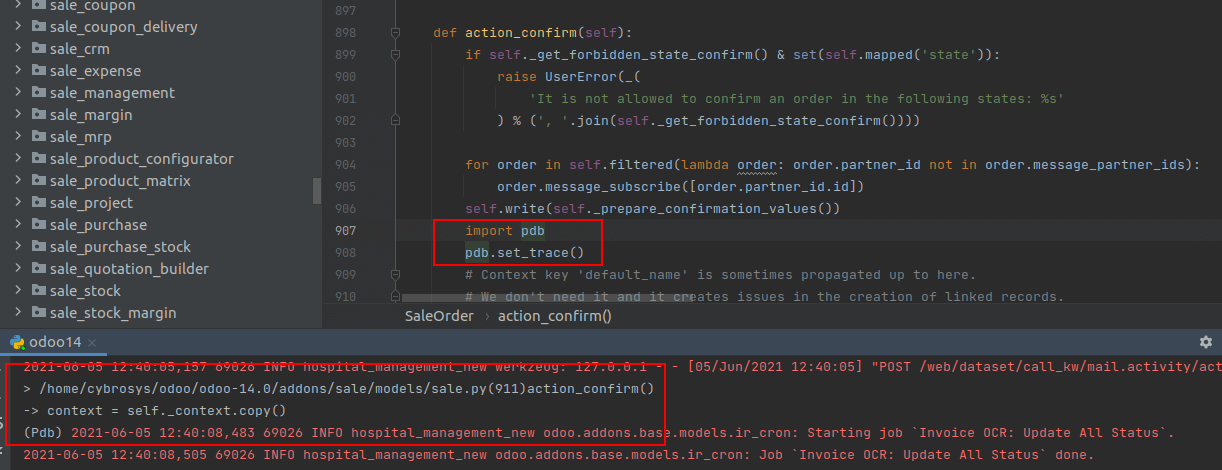
From our source code we can define two lines of code import pdb and pdb.set_trace() inside action or a statement. Once the execution of code reaches here the execution will stop at this point. Let me give an example with the following screenshot

I have declared the pdb package and set_trace() inside action_confirm method. Inside this action, the execution will stop once the statements reach pdb statements and the UI it's still loading. Developers have an option to get values or return inside an existing function. In the mentioned screenshot I have taken action to confirm the sale.order model.

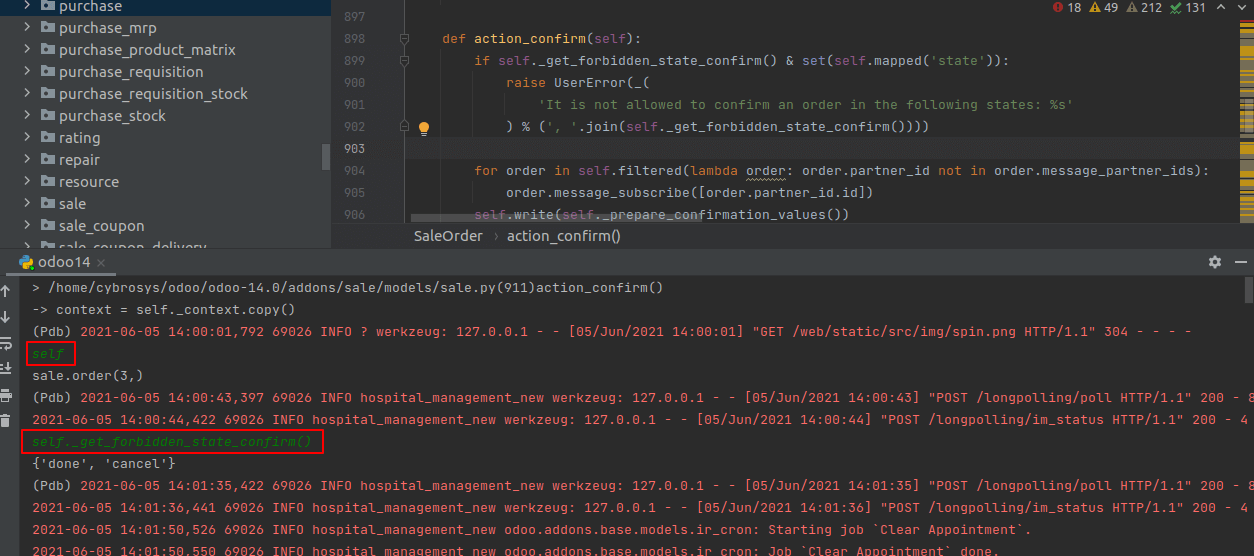
Let us access values or return any statements of the existing function.

As in the given example, By specifying self and return a function, We could get the corresponding record ID and function return. set_trace() at a given point in our program will be used to hard-code a breakpoint. The debugging functionality pdb is pdb.run() is used to execute the statement under debugger control, pdb.runcall(function, *args, **kwds) is used to call the function with the given arguments and many more aspects.? Usually, developers misunderstand that print() is a debugger inside python and printing() is not a debugger, it assesses the expression in the current context and prints its value.