When it comes to taking strategic decisions for the growth of your online businesses, the primary tool you need is an effective analytical platform for understanding each and every aspect of sales through eCommerce. The dedicated eCommerce dashboard in Odoo15 serves as a platform to analyze the eCommerce of a company by tracking and visualizing the data associated with the operations of selling and marketing products and services on your eCommerce sites. The important details regarding online sales can be examined by converting them to graphs and analytic tables to simplify the eCommerce analysis. Regardless of the size and type of the online business you run, proper analysis and monitoring of online sales are really crucial for improving marketing and sales growth. Even if you are well established in the online-based business or a new entrepreneur who is just entering into the eCommerce business field, an eCommerce analysis platform is necessary to understand the development of your business. In the Odoo 15 Website module, the user will get an advanced eCommerce dashboard that offers a dynamic platform where you can monitor your online sales with the help of analytical eCommerce data.
This blog will detail the features available in the Odoo 15 Ecommerce dashboard and how this dashboard helps to improve your eCommerce strategy.
The eCommerce module in Odoo works integrated with the Website module. You will get access to the eCommerce dashboard in the Odoo Website module only after installing the eCommerce module from the AppStore. This dashboard can be used for the analysis of all types of online businesses. The user will get the Go-To Website button from the dashboard itself which will directly lead you to your eCommerce site.
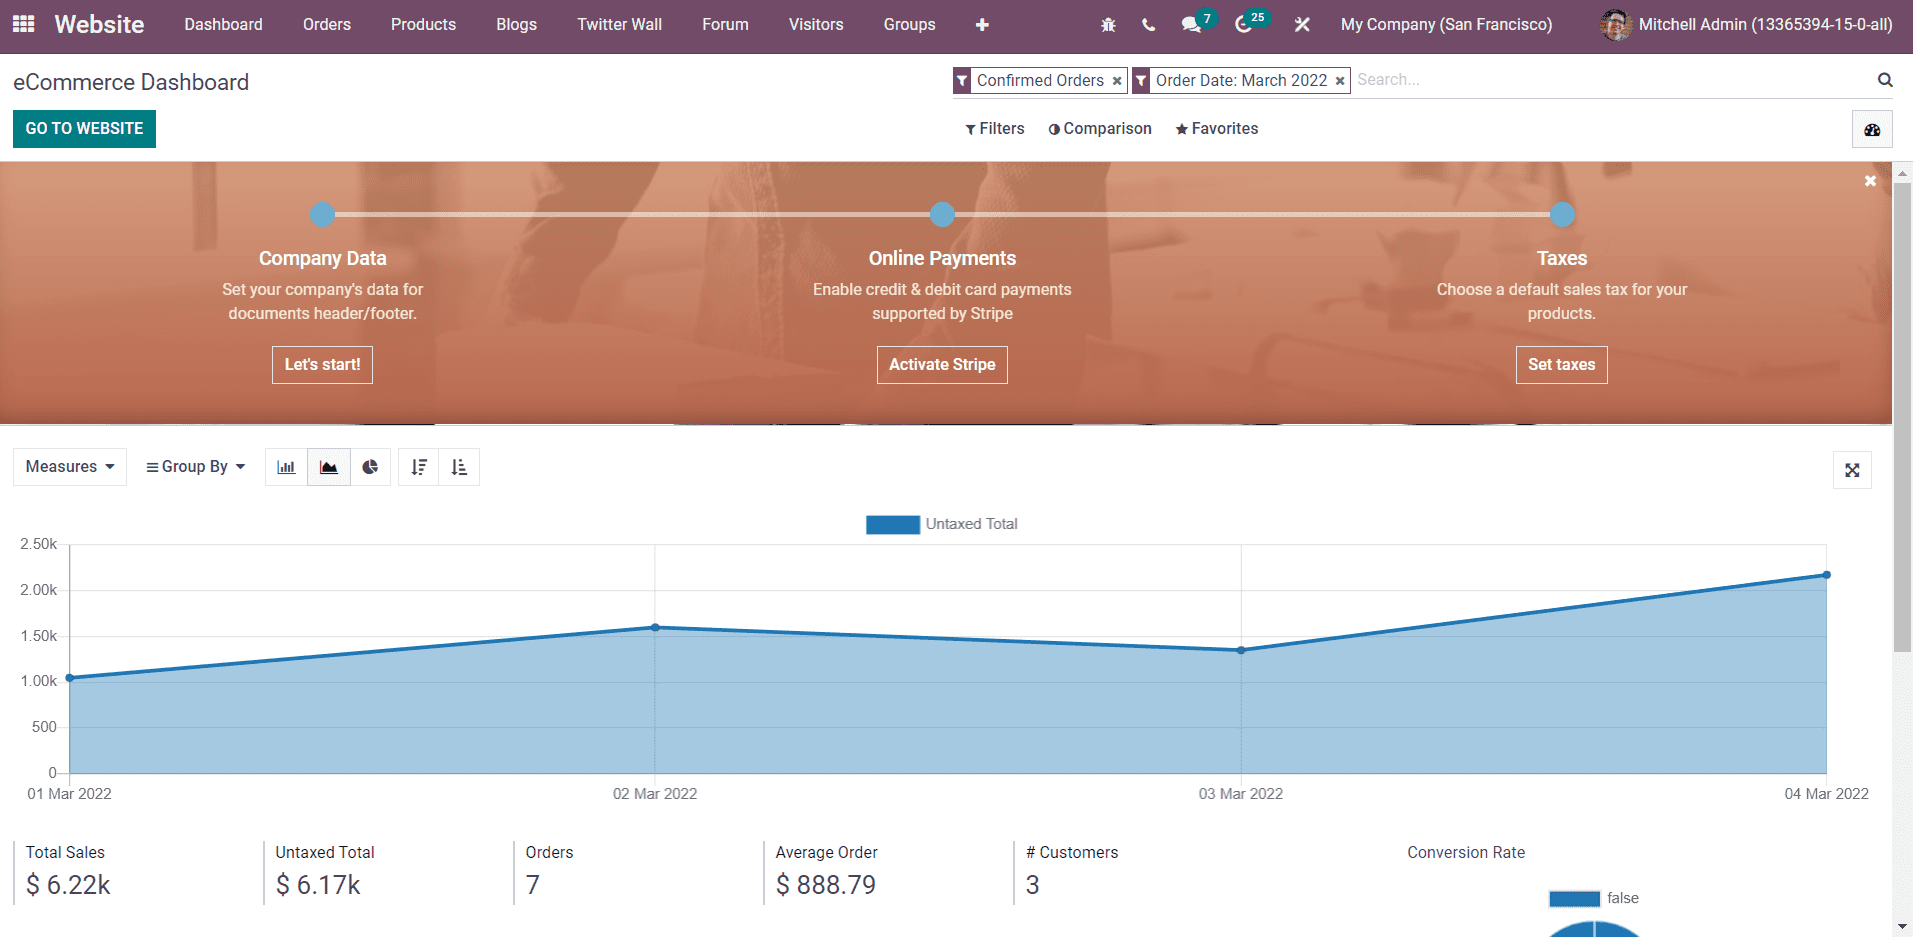
Configuration Panel
When you open the Website module, a configuration panel can be seen on the dashboard that assists you in configuring Company Data, Online Payment, and Taxes into the system.
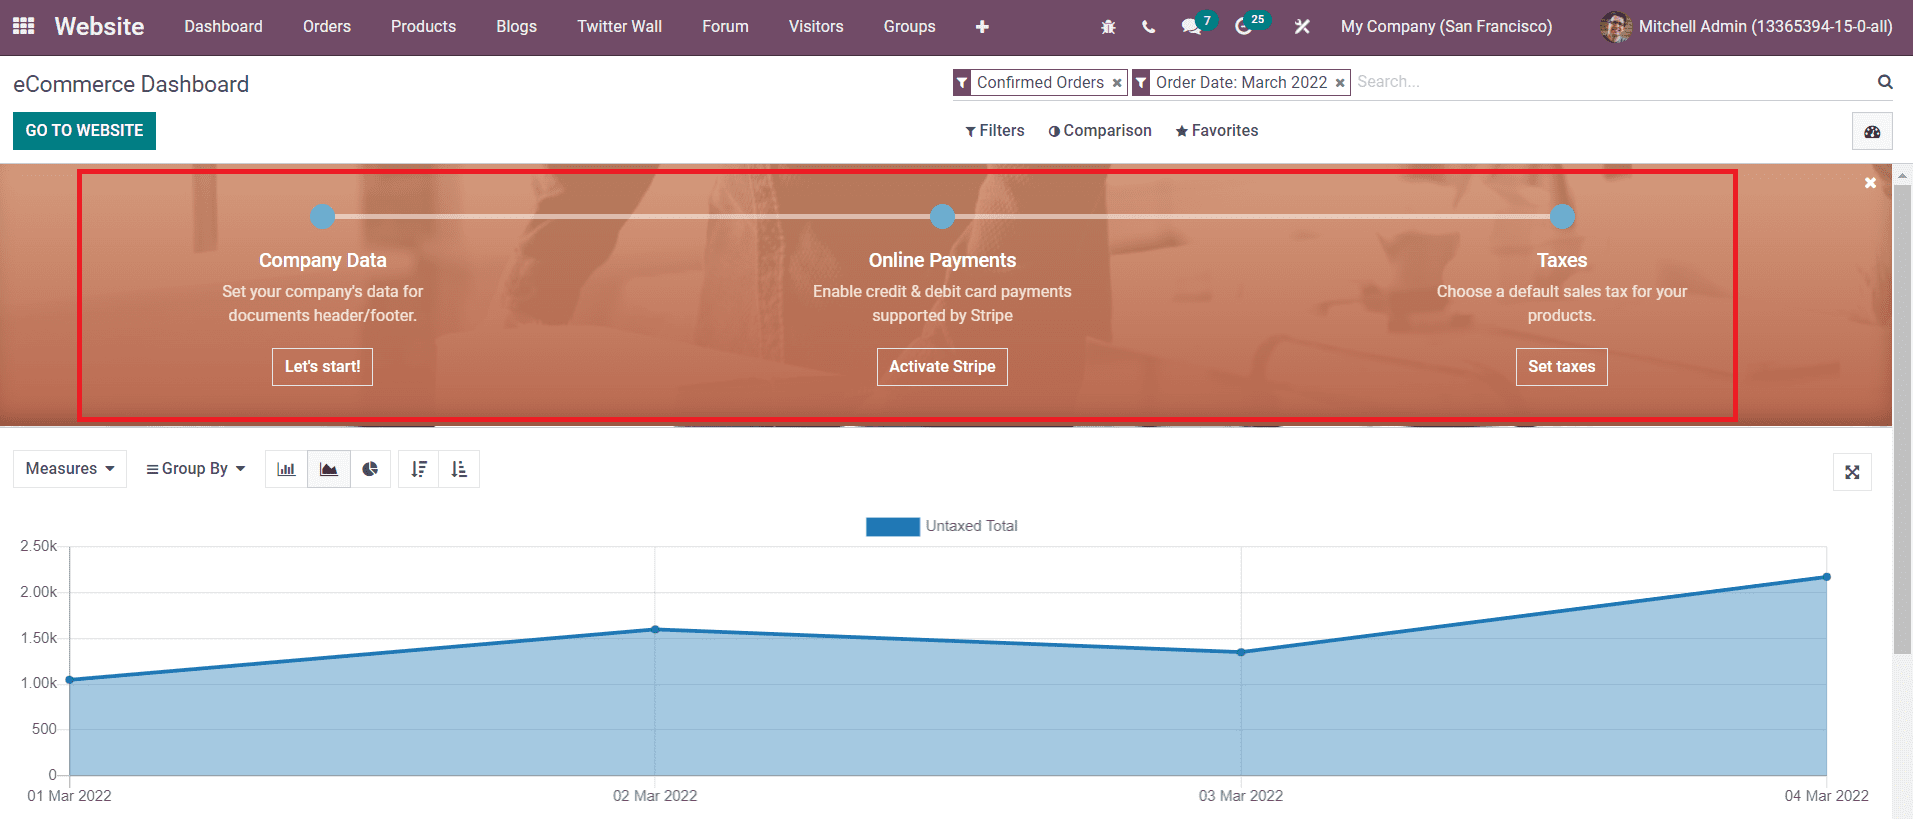
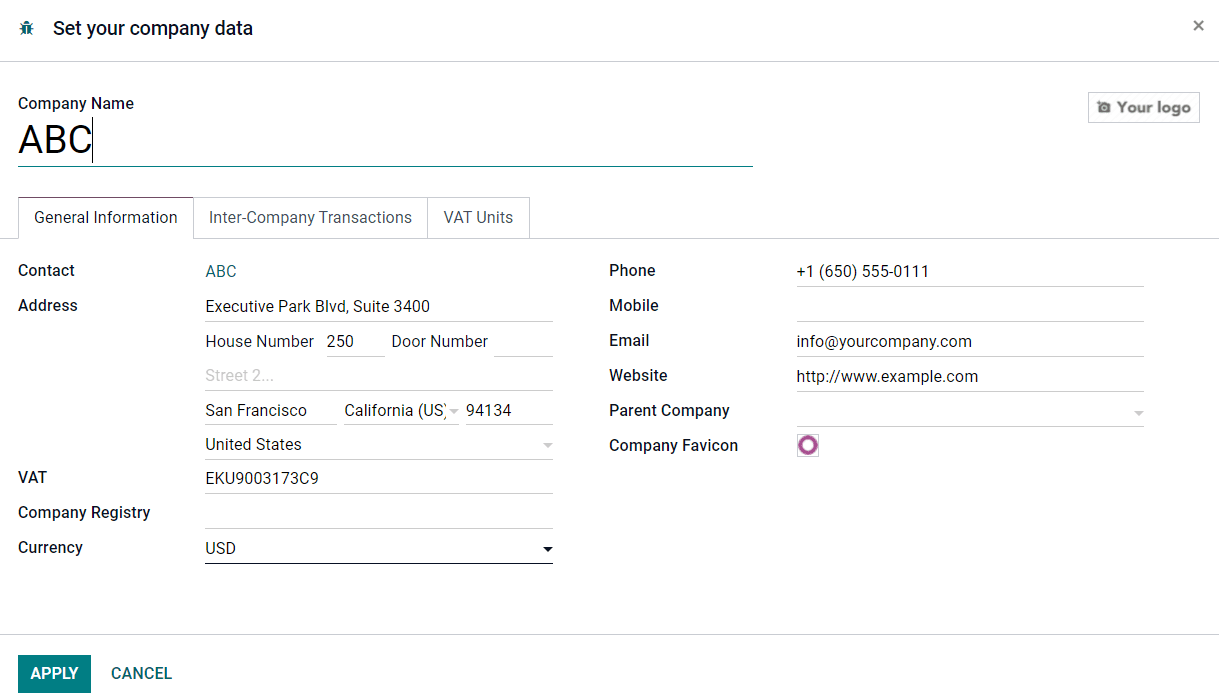
Using the Let’s Start button, you can set your company data for the document's header/footer. A pop-up window will appear as shown in the image below where you can specify General Information, Inter-Company Transactions, and VAT Units.
After configuring company data to the database, you can find the field under the Company Data in the Configuration panel as ‘All Done’.
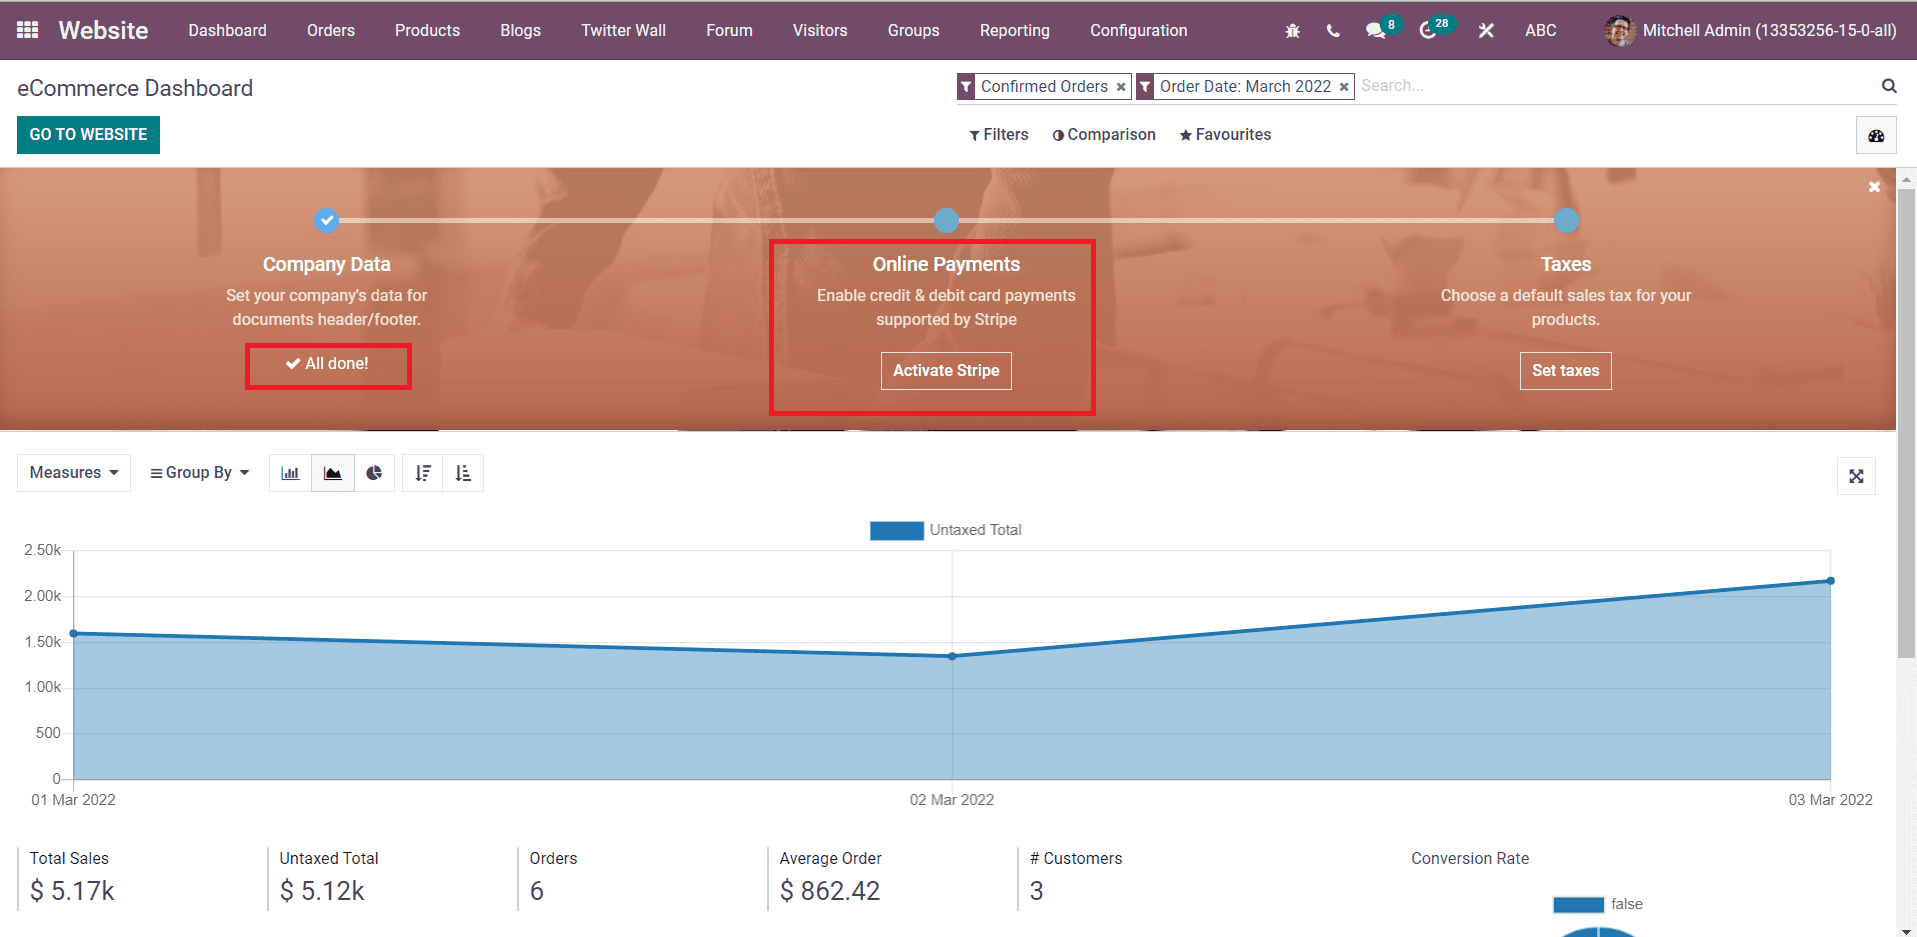
Next, you can configure the Online Payment methods that help your customers to pay online while purchasing products from your website. For this, click on the ‘Activate Stripe’ button under the Online Payments filed as marked in the screenshot above. Odoo will lead you to a new page where you can activate your Stripe account by using an Email and password.
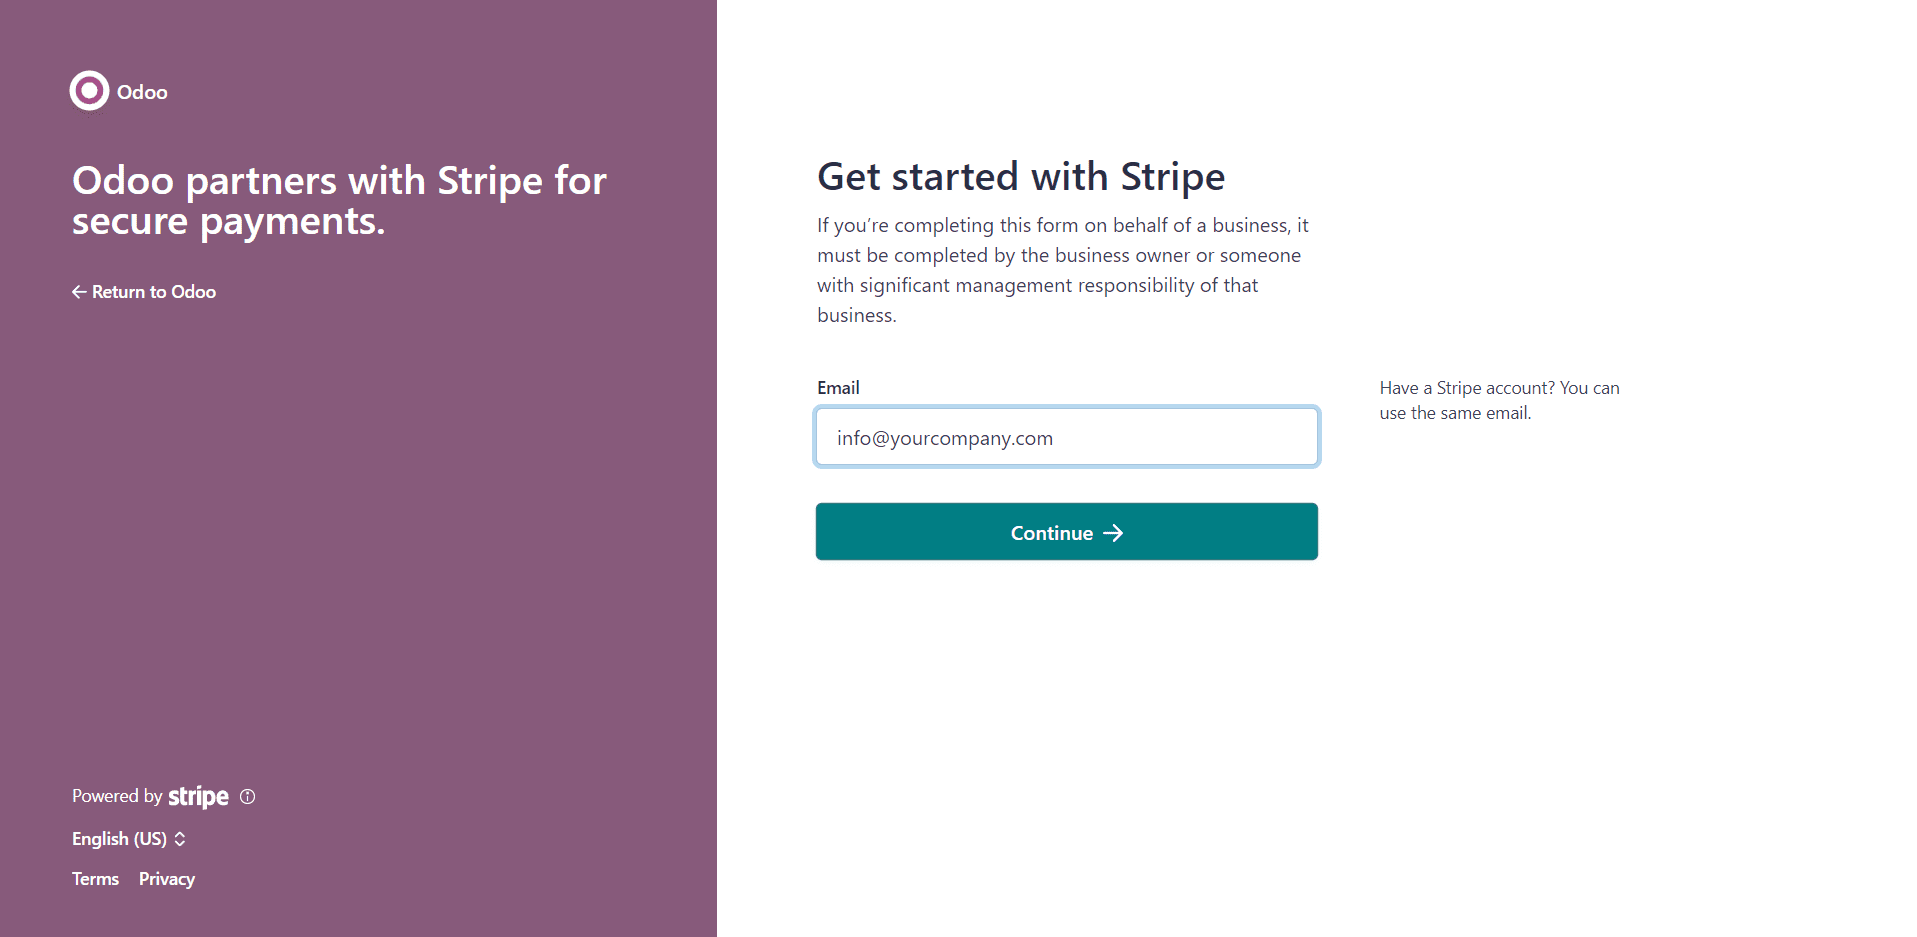
This stage must be done by the business owner or someone with significant management responsibility. The last option in the Configuration panel is to choose a default sales tax for your products.
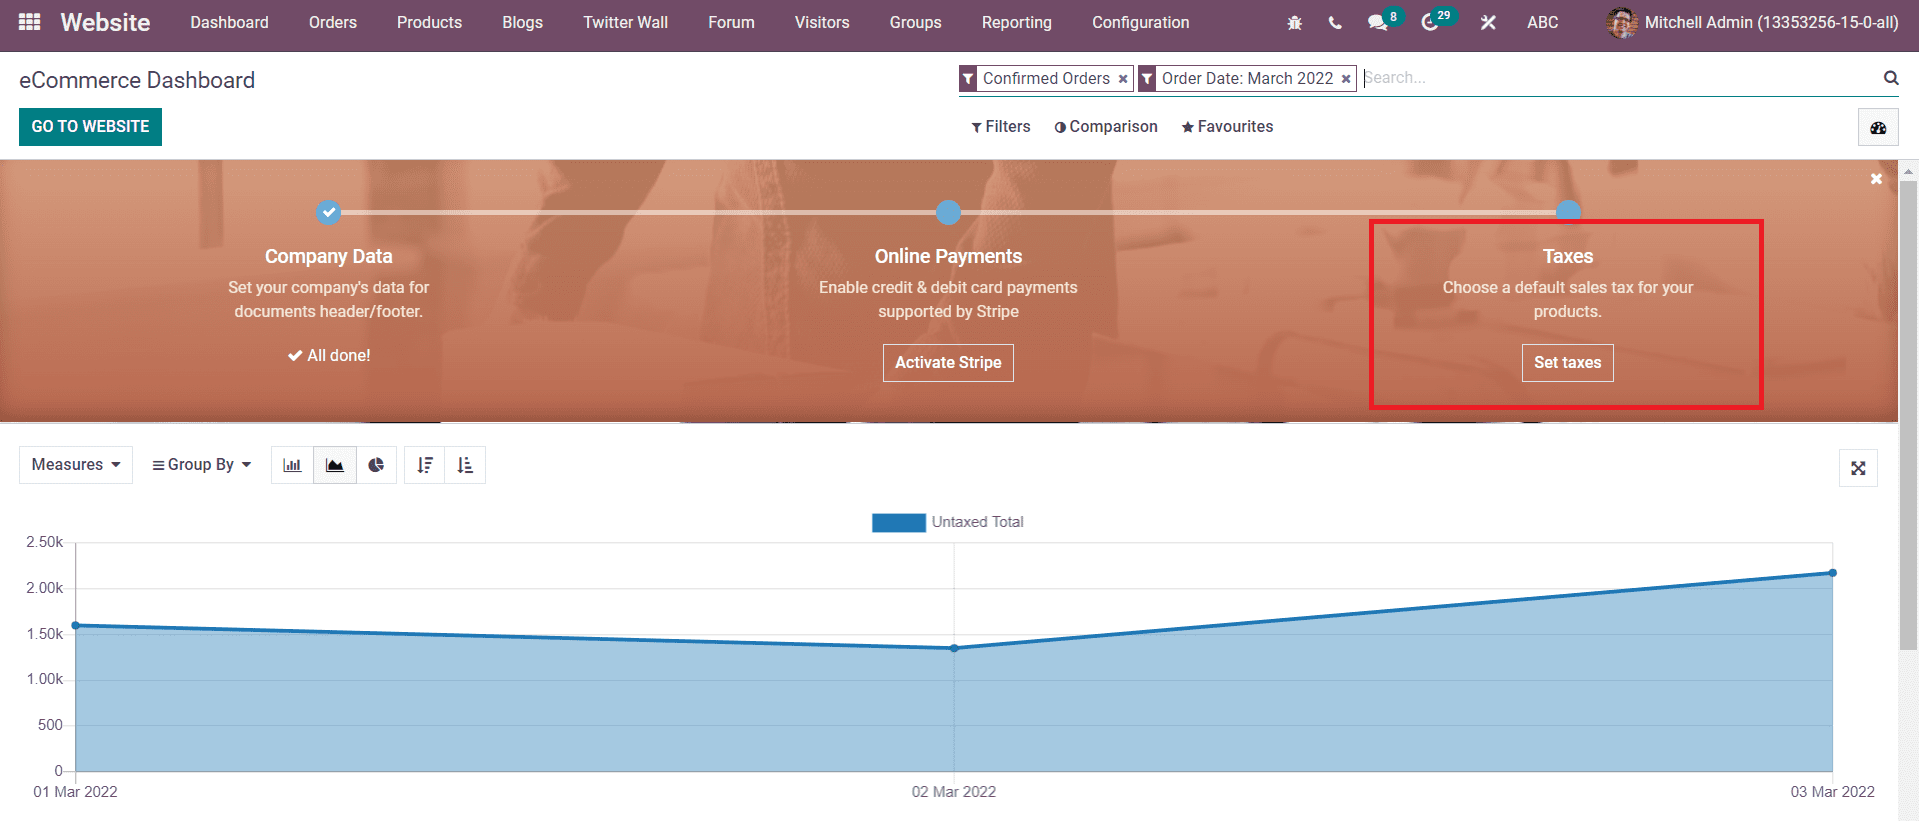
Click the Set Taxes button under the Taxes field as marked in the screenshot above which will direct you to a pop-up window.

In this window, you can set a sales tax as default for the products on your eCommerce site.
Data Visualization
The eCommerce data recorded in the Odoo Website module can be represented in graphical and chart views with the help of the eCommerce dashboard. You will get real-time access to the illustrative charts that help you to understand how well your online business is going. In order to improve the sales analysis, you are allowed to customize the graphs and pivot table using Filters and Measures. In the Graphical view itself, you can display data in various formats such as Bar, Line, and Pie Charts.
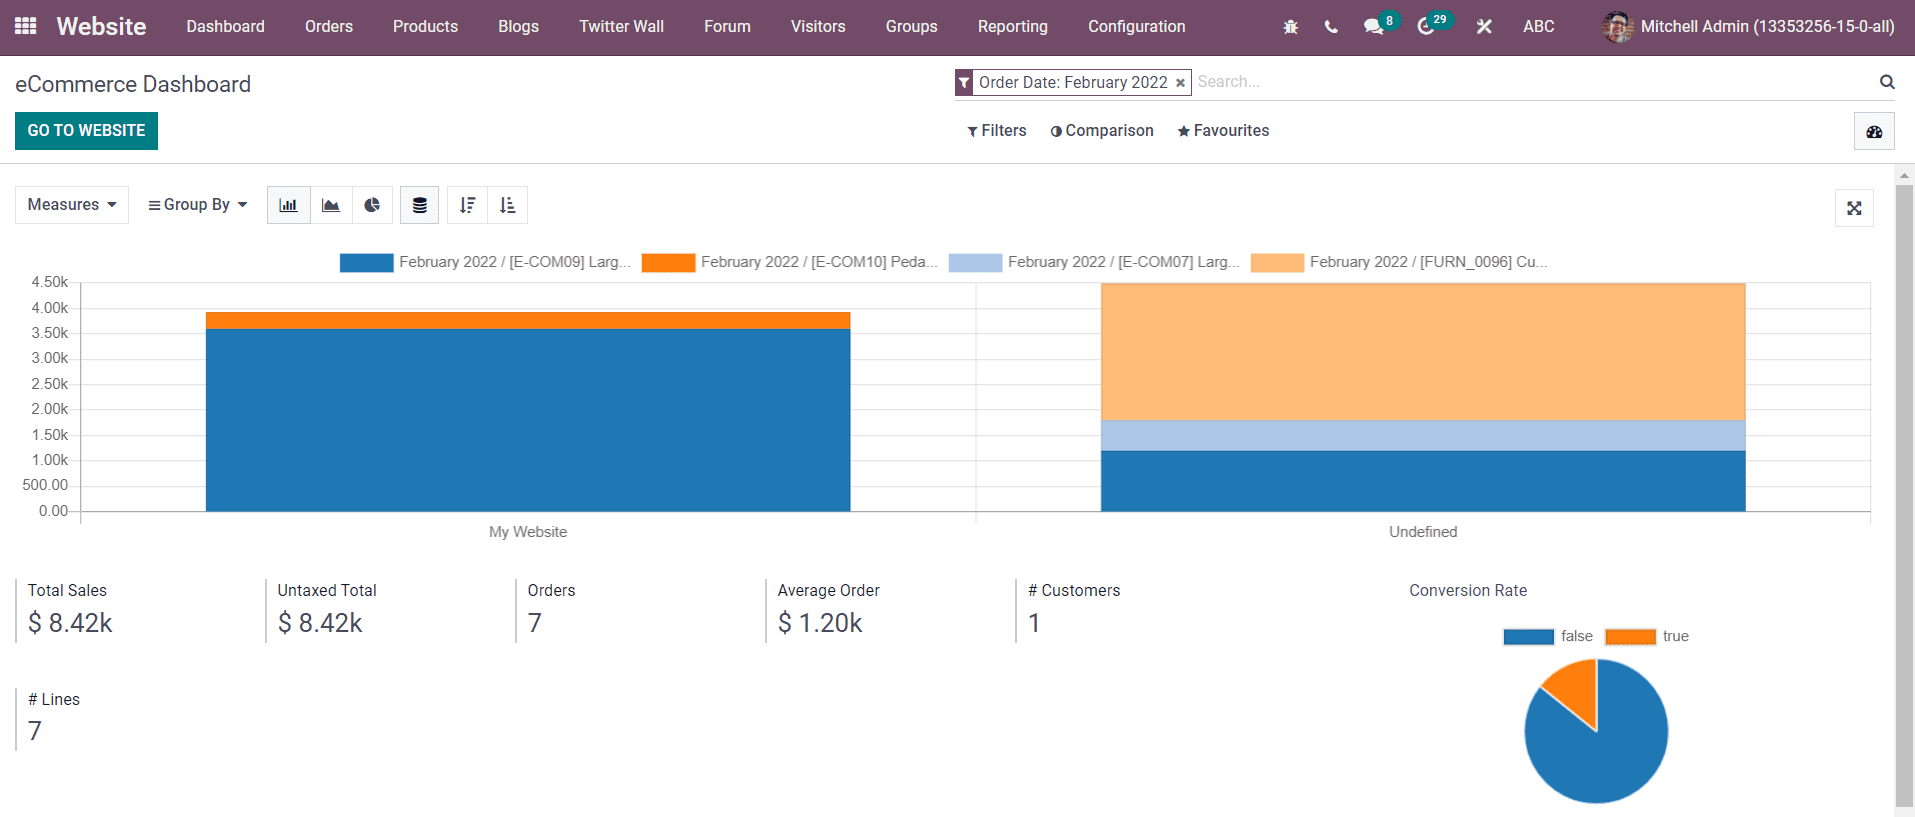
The graphs and pivot tables available in the eCommerce dashboard will help you to examine your Website, Product, Product Category, Customer, Customer Country, Status, and Order Date based on the Discount, Discount Amount, Gross Weight, Margin, Order, Quantity Ordered, Quantity Delivered, Quantity Invoiced, Quantity To Deliver, Quantity to Invoice, Total Amount, Untaxed Amount Invoiced, Untaxed Amount to Invoice, Untaxed Total, Volume, and Count. The customization options available under the Filters and Group By options can be used to generate customized reports according to your business requirements. It is possible to filter the data based on Confirmed Orders, Unpaid Orders, Abandoned Carts, and Order Dates.
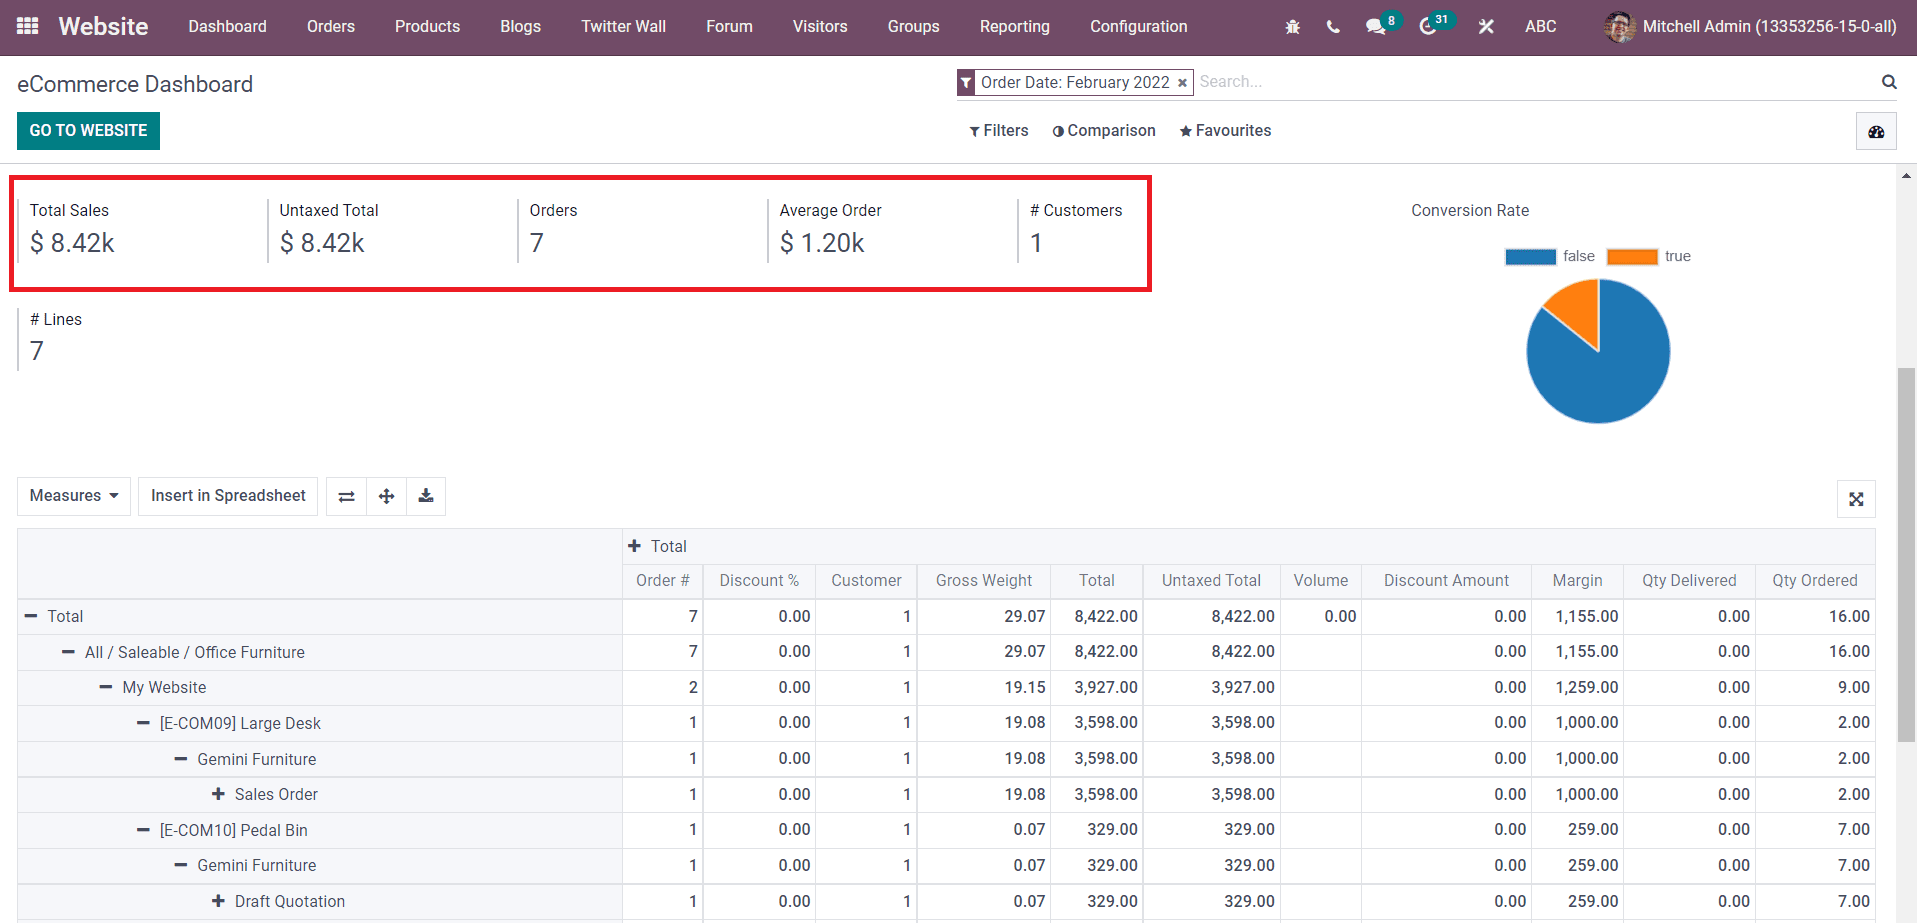
The dashboard will display the details regarding Total Sales, Untaxed Total, Orders, Average Order, and Customers separately under the graphical illustration. The pie chart of the Conversion Rate can be also observed in the dashboard as shown in the image above. Using the pivot table, you can convert the eCommerce data into an analytical table.
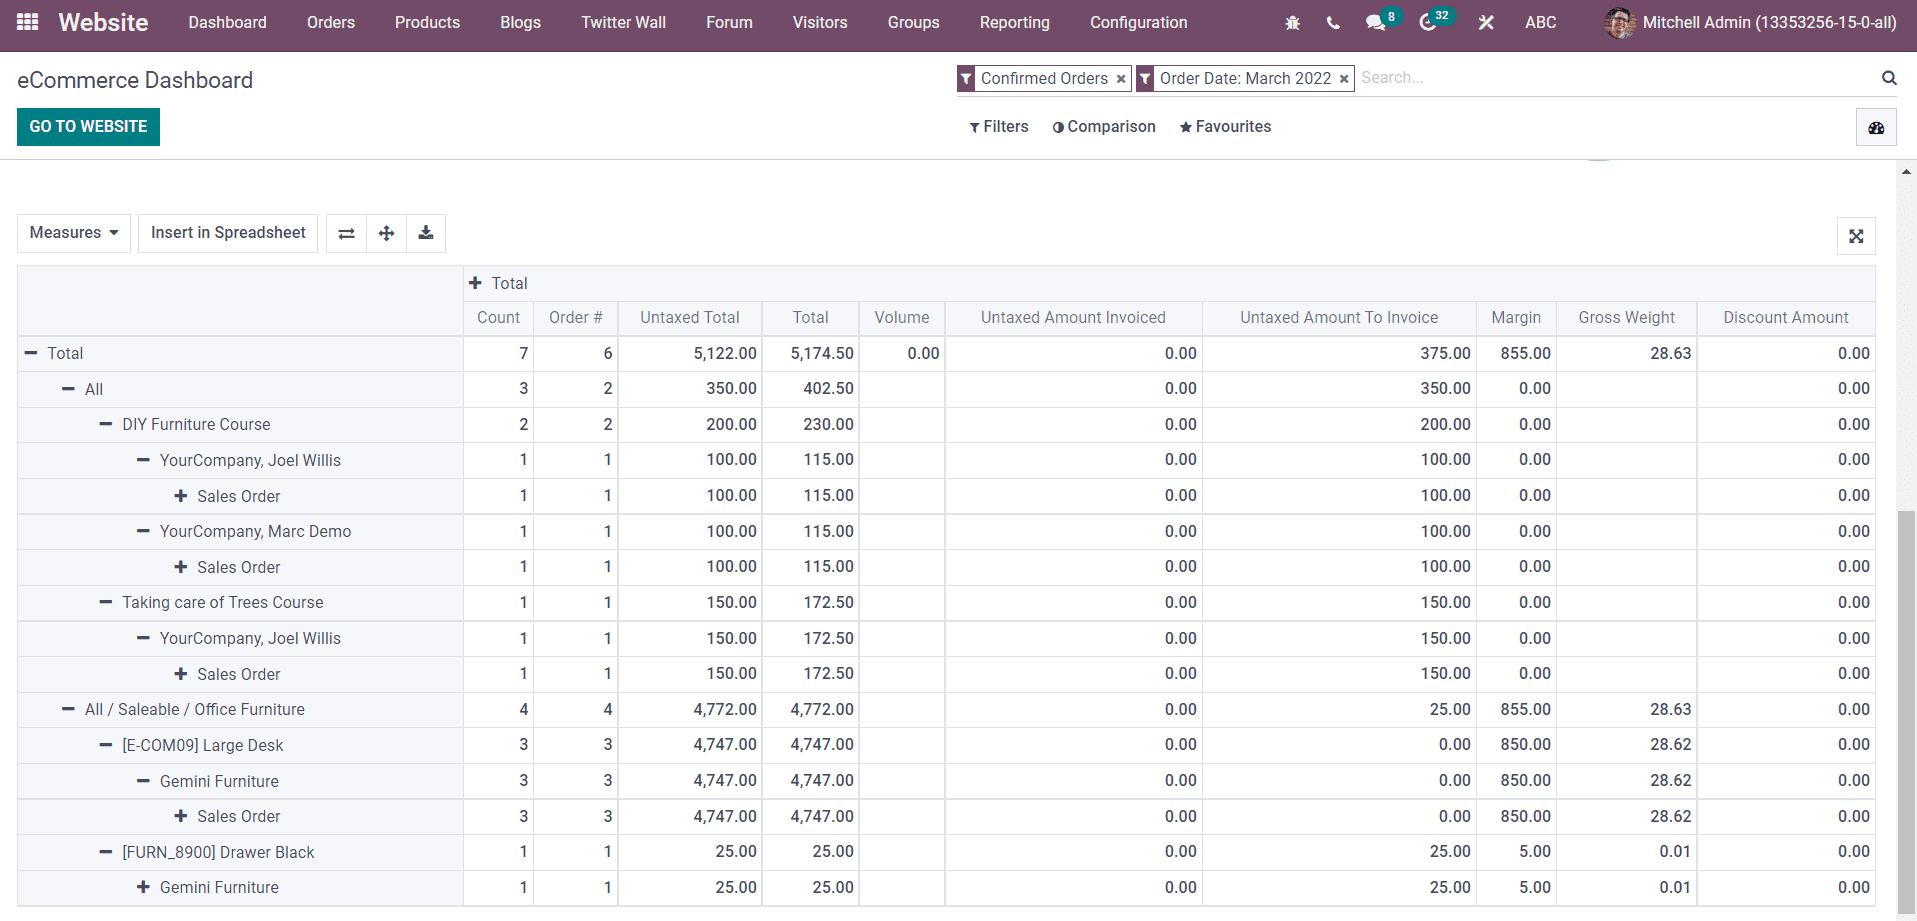
The Measures available here are the same as those used in the graphical illustration. The pivot table can be easily converted into spreadsheets using the Insert in Spreadsheet option. The dashboard also contains options to view the graphs and pivot table in full screen. On a monthly and yearly basis, you can effortlessly analyze various aspects of your online sales.
Comparison
To get an exact idea about the area that demands improvement, Odoo can help you to compare the data regarding your online sales with the previous records. A comparative analysis is the best solution to understand the growth of your business. It will help you to study the development of your eCommerce site compared with the previous time range. For this, Odoo offers the Comparison feature in the eCommerce Dashboard. Seamlessly, Odoo compares each record of sales operation with the previous year or a particular period.
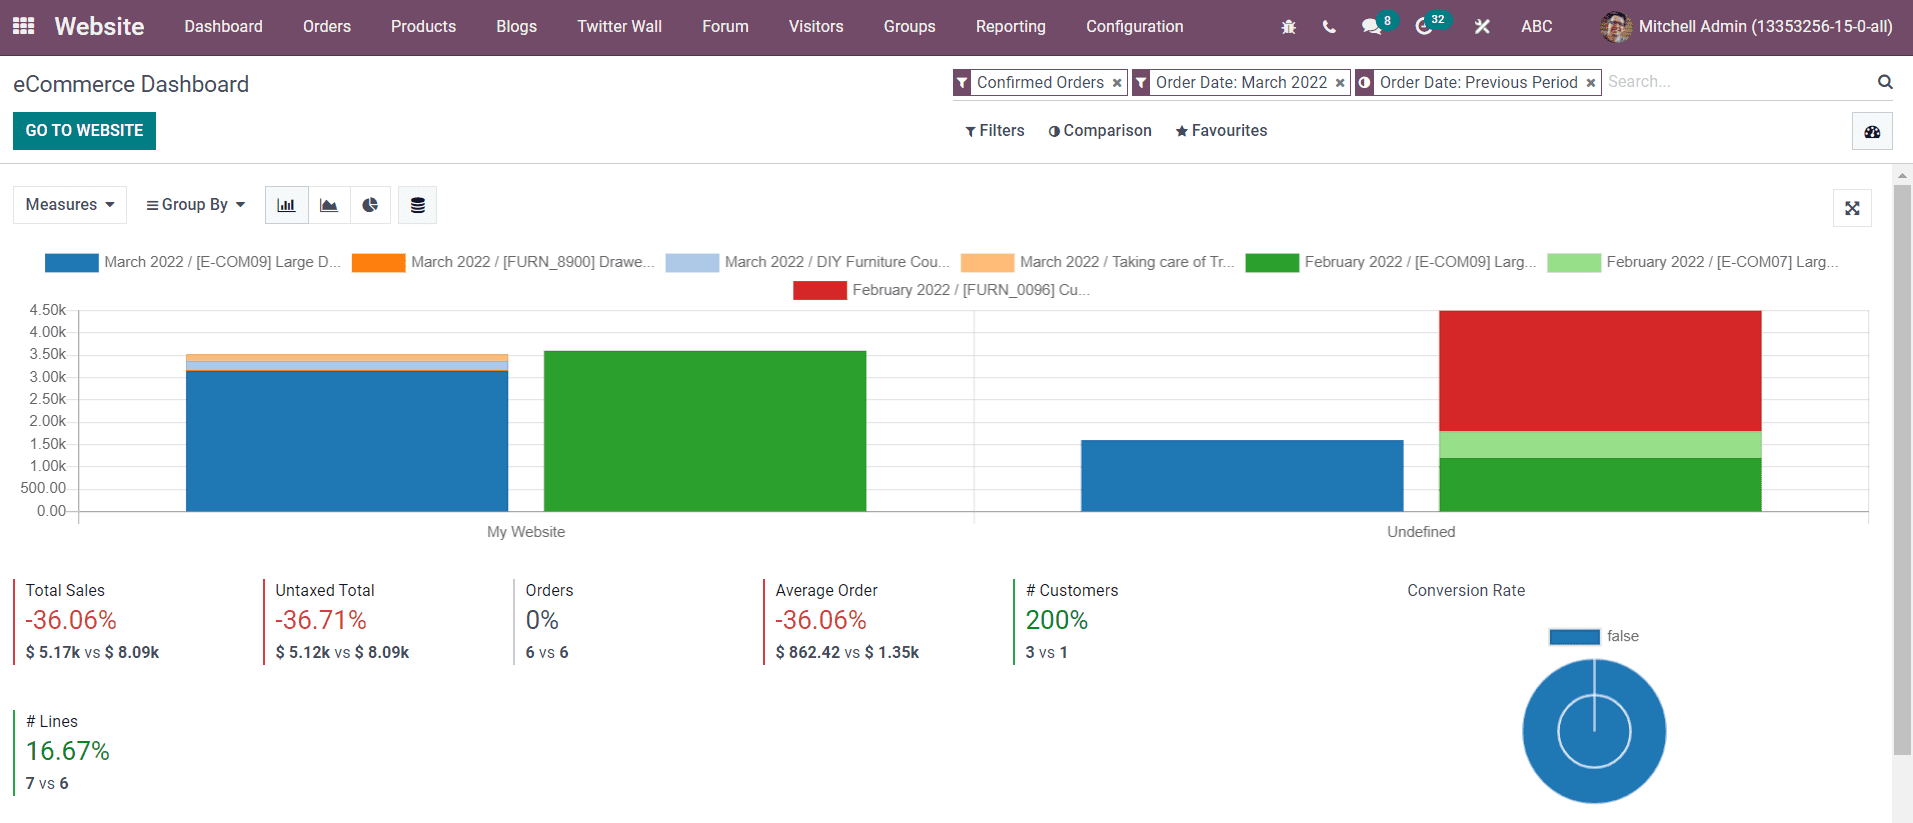
The graphical illustration of the comparative analysis can be seen in the dashboard as shown in the image above. When we take a look at the pivot table of the comparison, along with comparative details of the data in two periods, you will get the percentage of variation also.
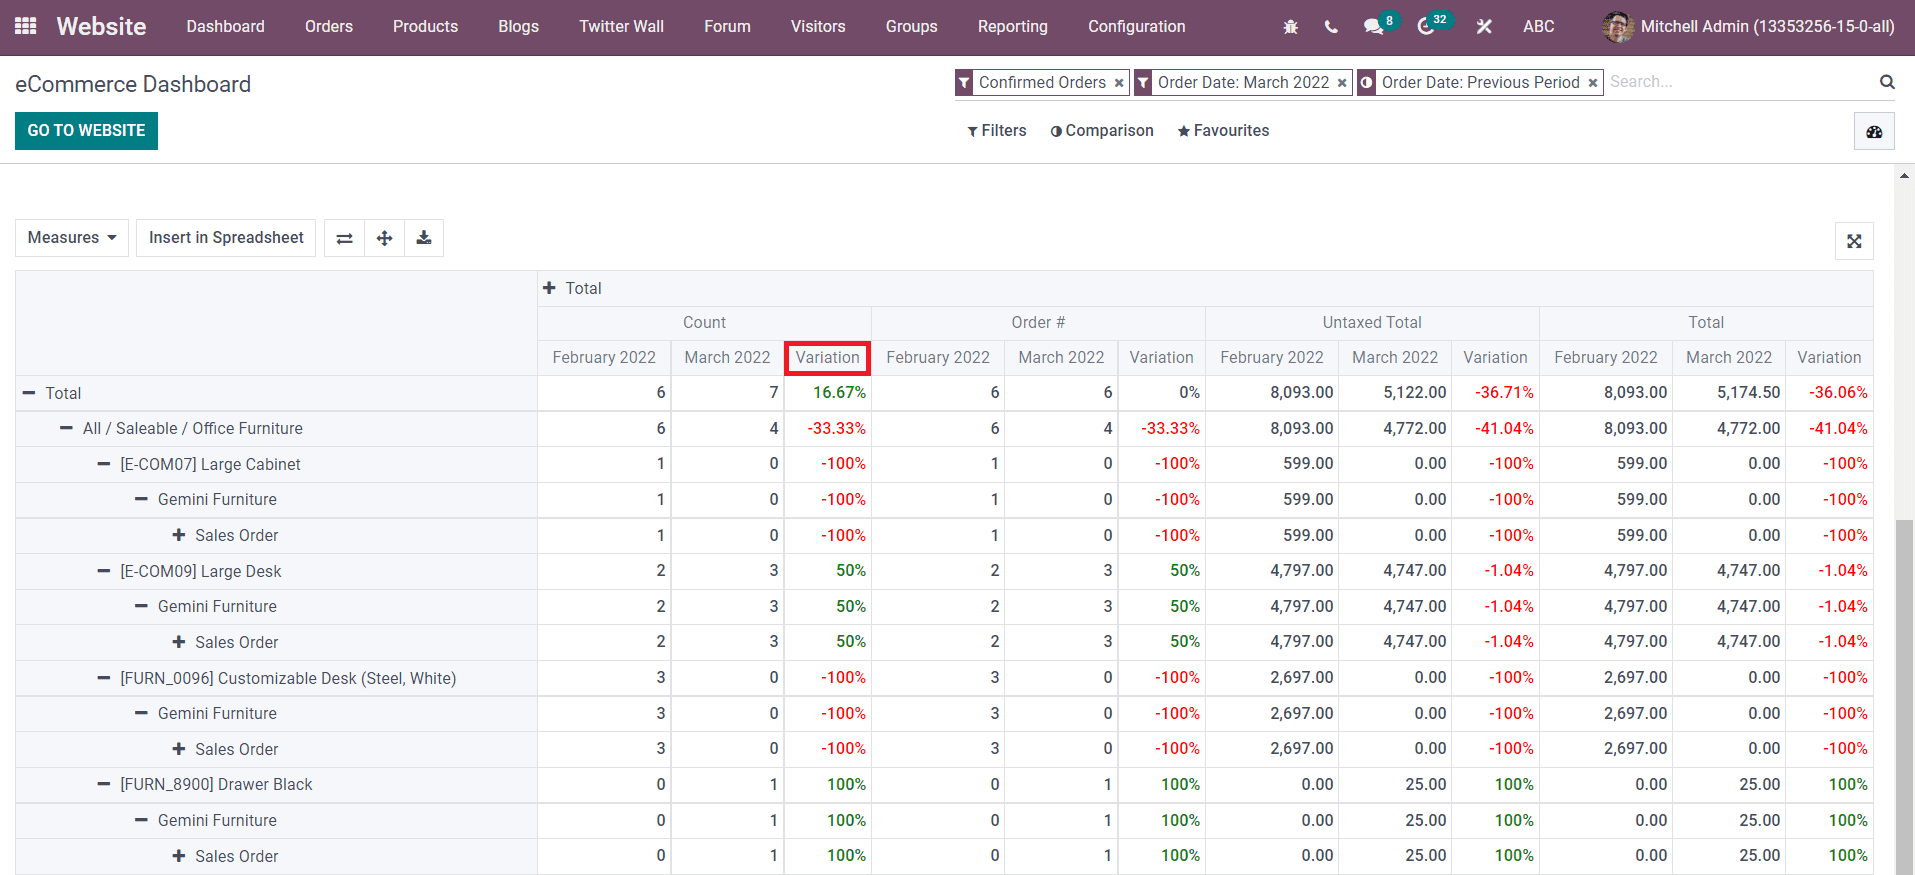
The comparative analysis is an effective tool that benefits your business to identify the factors that need to be improved. By analyzing these factors, you can take fruitful decisions to enhance the performance of your online business better than the current state. The data analyzing platform provided by the eCommerce dashboard can be utilized to examine various aspects of your eCommerce business. With the help of advanced measuring and sorting options, you can effortlessly visualize the data in different views.