Managing and finishing project activities would be exhausting if not organized in a methodical manner. Each organization implements an appropriate management system to facilitate job control relating to specific corporate initiatives. Planning, task creation, assigning accountable personnel, recording timesheets, fulfilling milestones, and billing finished projects are all part of project management. Odoo's newest version will assist you in managing projects in an organized manner.
Views are used in the user interface to expose business objects. Business objects can be defined as enhancing existing capabilities or creating new ones. They are shown in the Odoo user interface via views. Odoo offers a variety of views such as list, form, kanban, calendar, graph, and so on.
In this blog, we will discuss the different views in the Odoo 16 Project module.
When you click on the Odoo 16 Project module, it will take you to the project module's main dashboard. The project dashboard's Kanban view is displayed below.
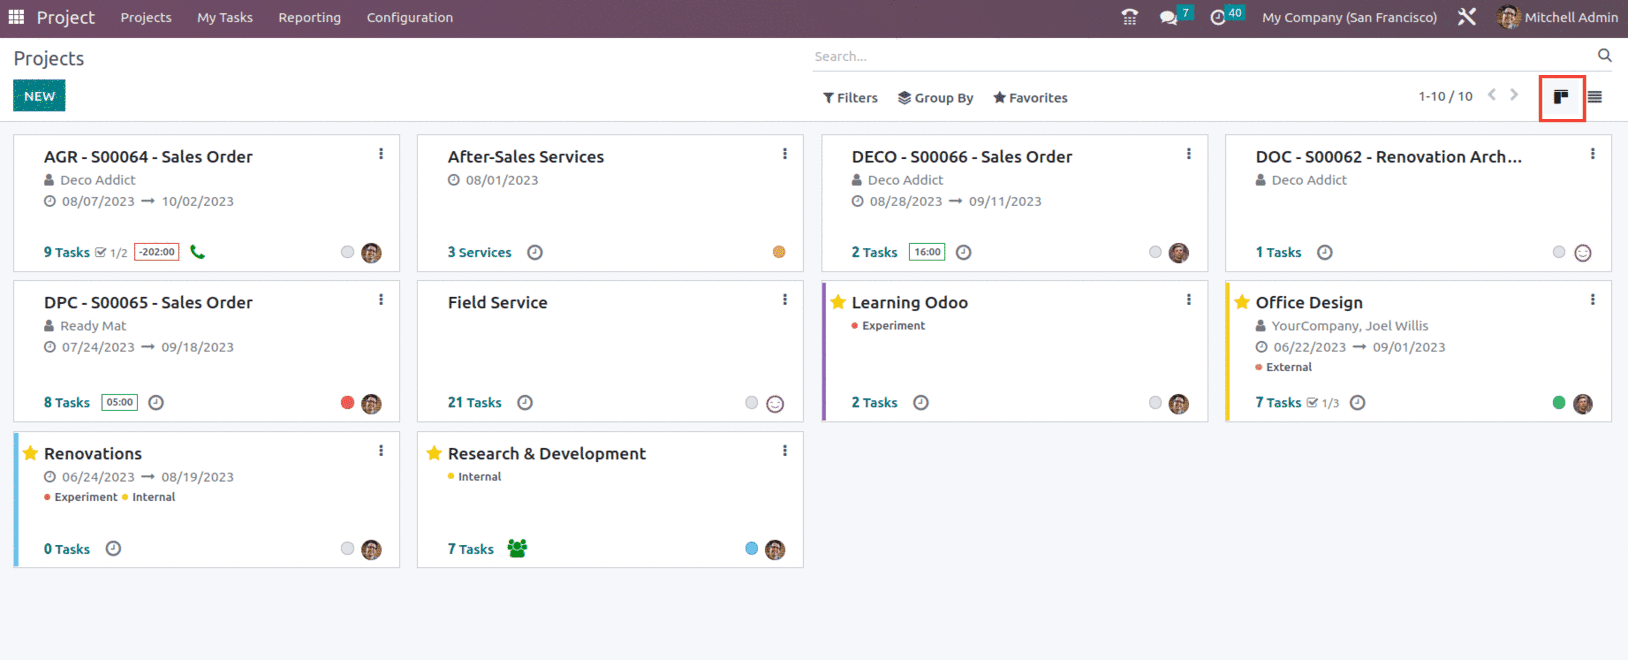
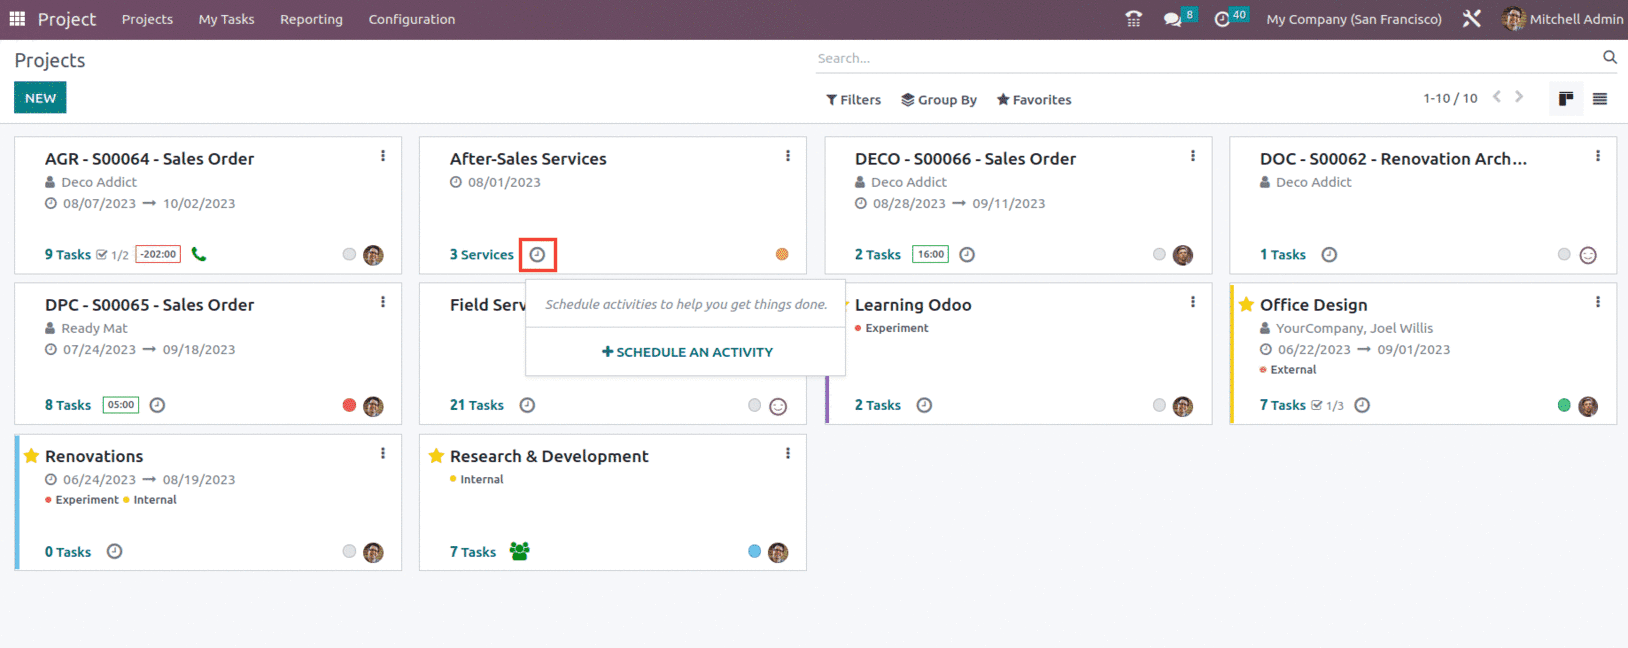
The Kanban view allows you to see the already set up projects. Each project displays the scheduled date, the partner, the customer rating, the amount of jobs involved, milestones, and the number of hours remaining to finish the work. Each project's state is represented by a distinct color, with each color indicating a particular connotation, such as At Risk, Off Track, On Hold, and On Track. You may add the project to your favorites list by clicking the star symbol. The Kanban view allows the user to Schedule activity for different projects, as shown below.
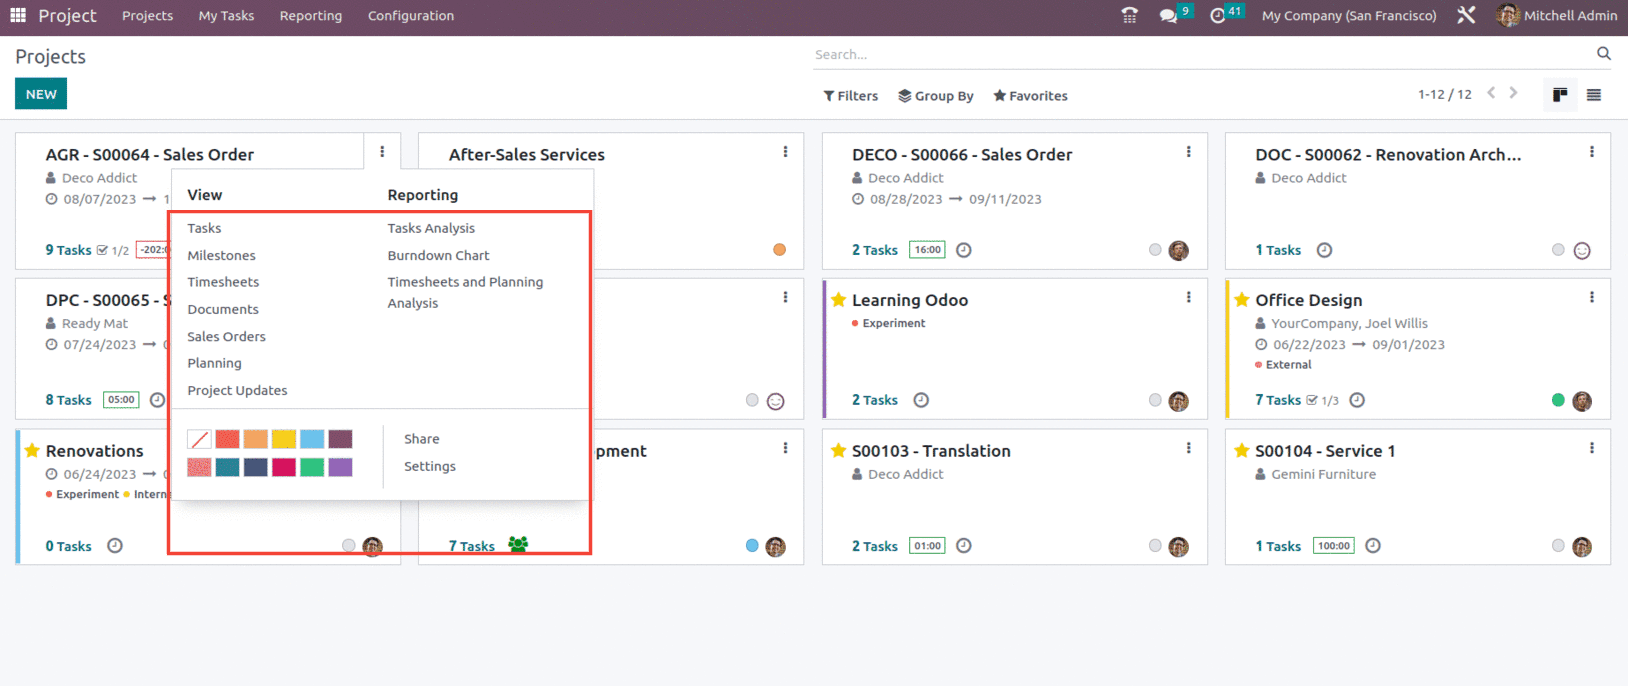
The three little dots in the upper right corner of each project will enable choices to examine the Task, Milestones, Timesheets, Documents, Planning, and Project Updates. This option may also be used to get reports for Task Analysis, Burndown Chart, Timesheets and Planning Analysis, and Customer Ratings.
The next view available in the dashboard of the project module is the List view.
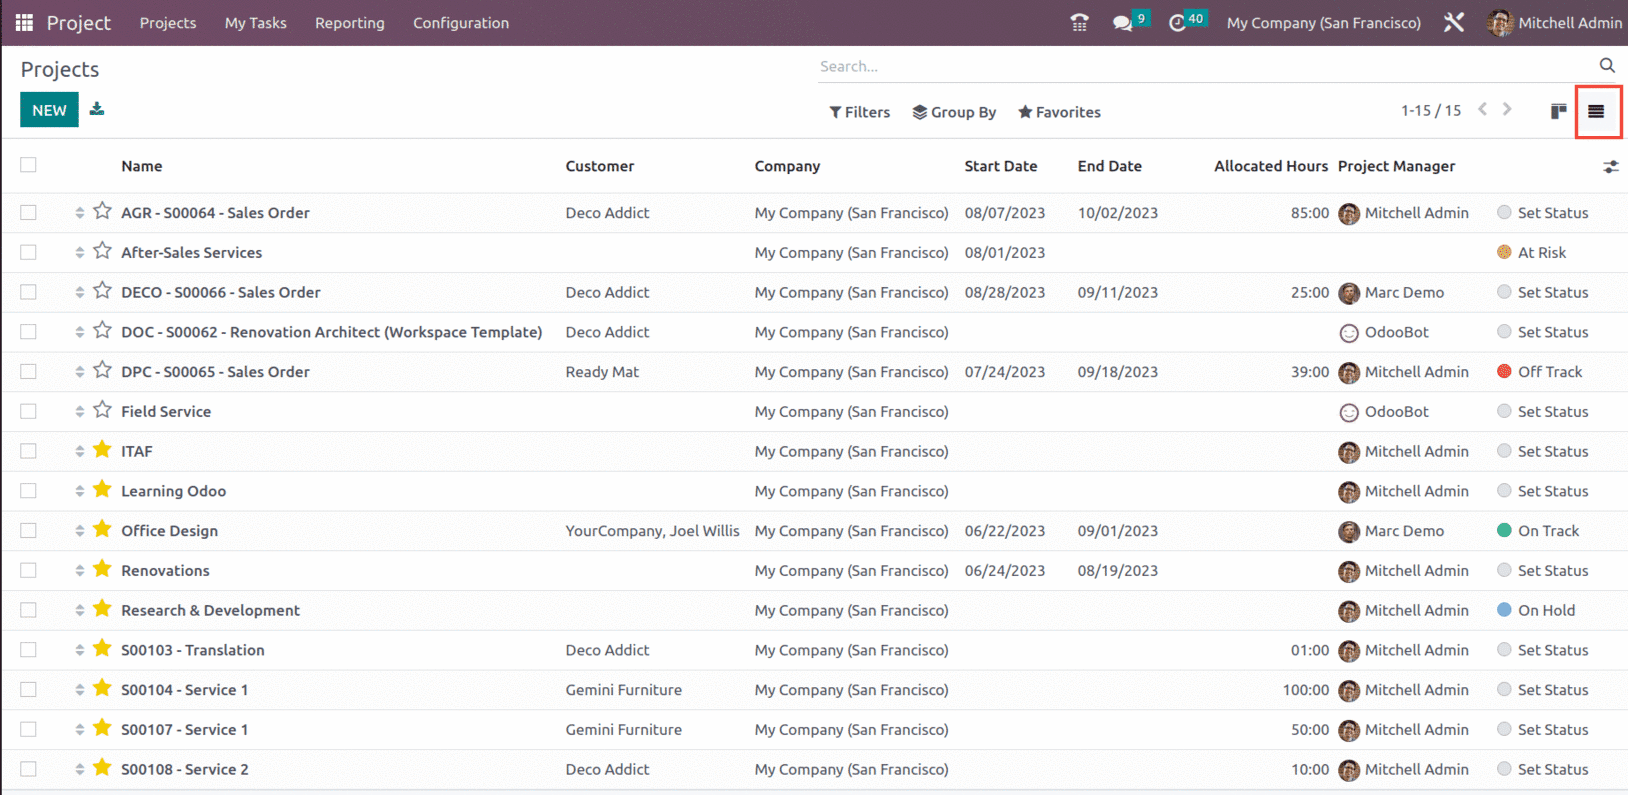
The List view. This view is useful for displaying several records in a single view. It appeared as a Tree, or list-like structure, with a set of rows and columns. Each row represents a database table record.
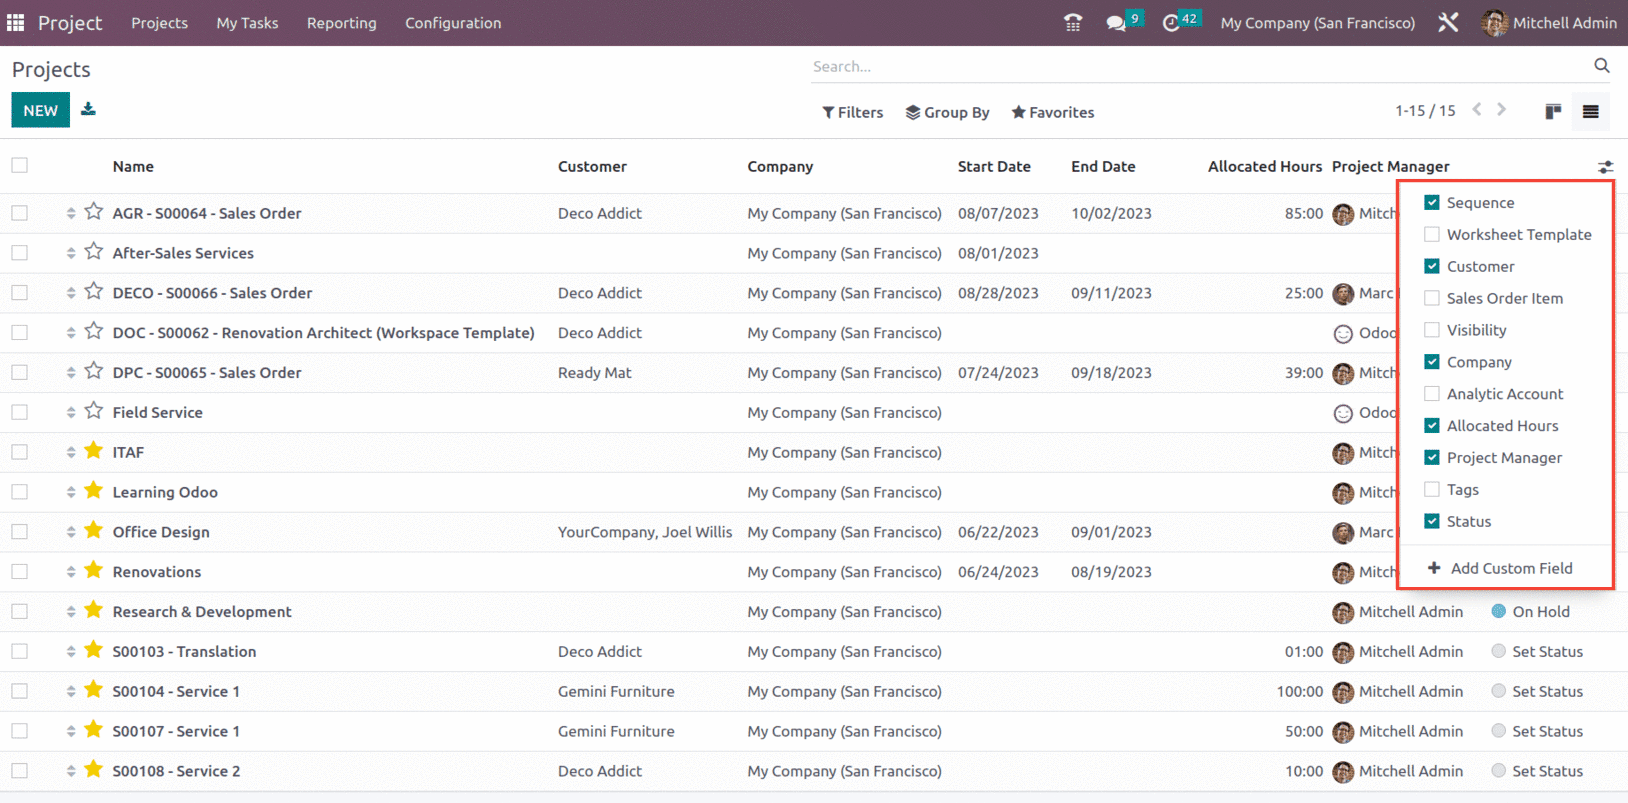
The List view of the project provides details such as Name of the project, Customer, Company, Start Date, End Date, Allocated hours, Project manager, Status, and other details as shown below.
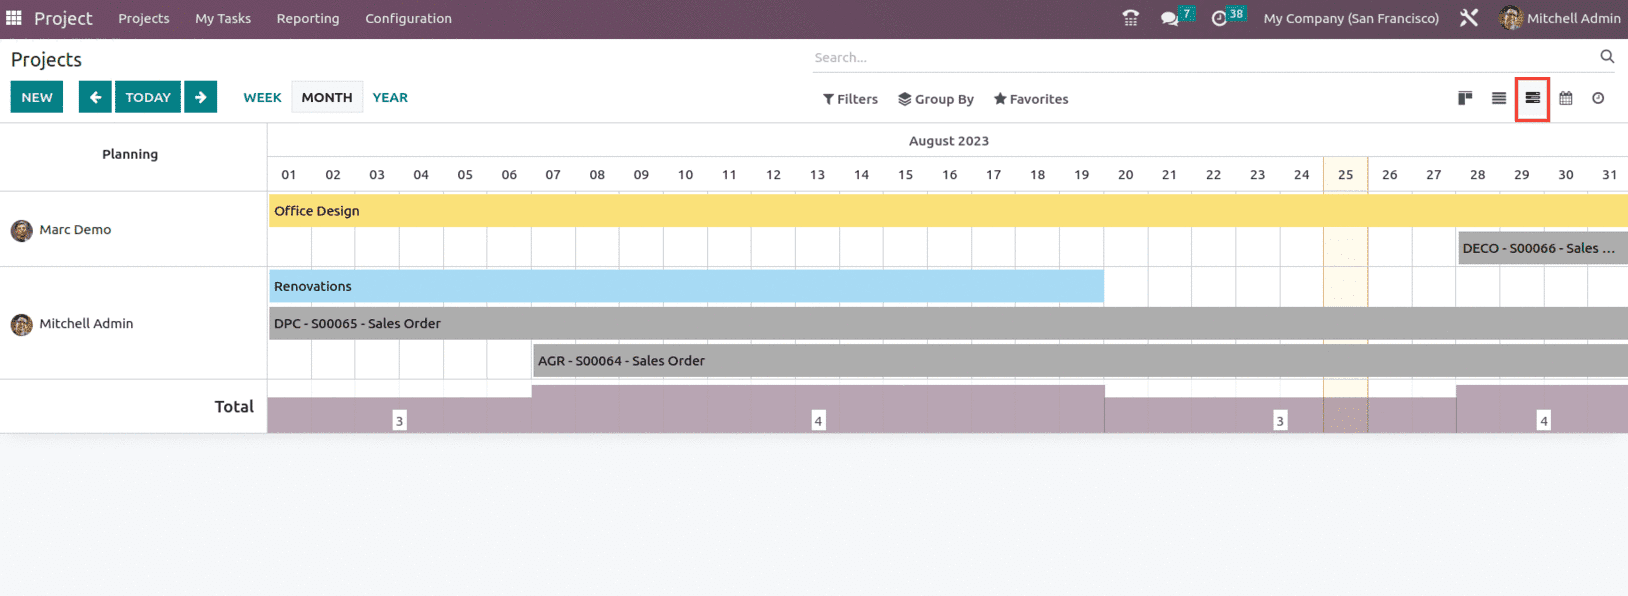
The next type of view is the Gantt view. A Gantt chart is a graphical representation of a project and all of the tasks involved with it. Each bar on the graph represents the time it will take to finish the assignment.
The Gantt view's main representation view is planning. Therefore, you may use it to plan your project, production, or anything else. It can also be used as an analytical report. It also seems more attractive and user-friendly.
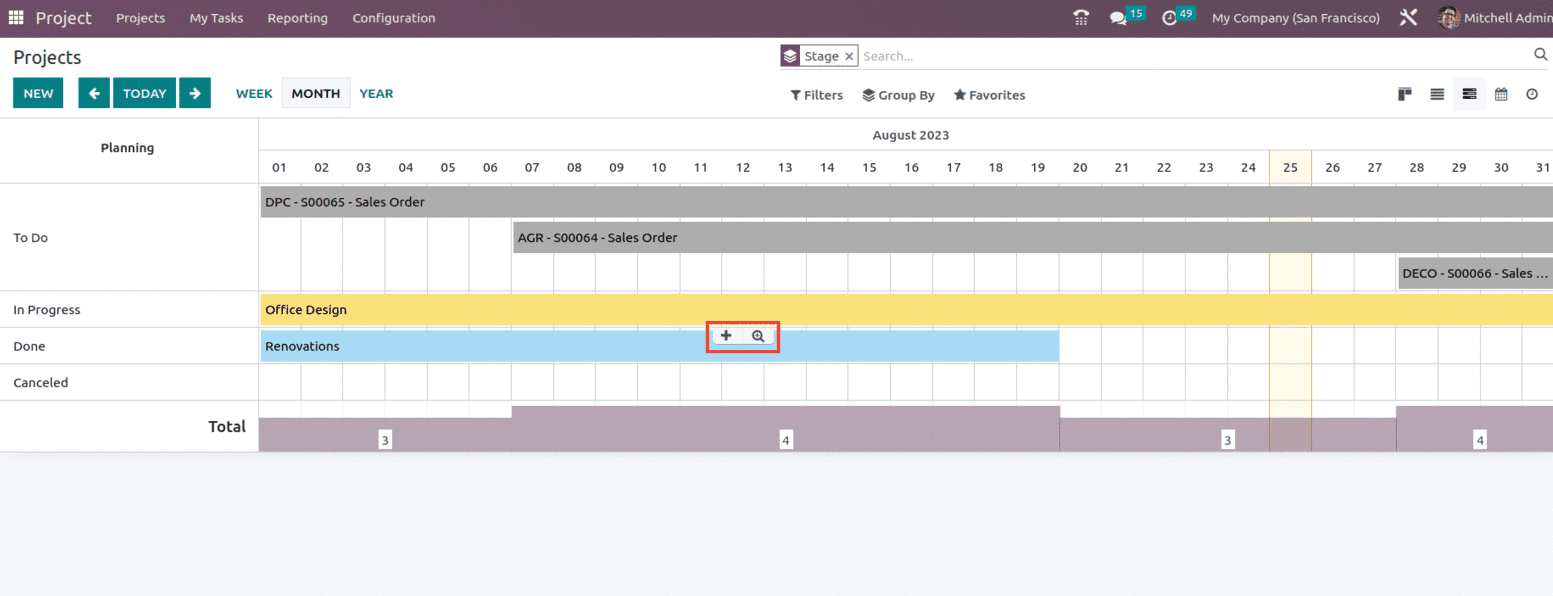
Within the Gantt view, it is possible for the user to Filter the info by Day, Week, Month, and Year. Along with that, it is also possible for the user to create a new project or plan the project accordingly, as shown below.
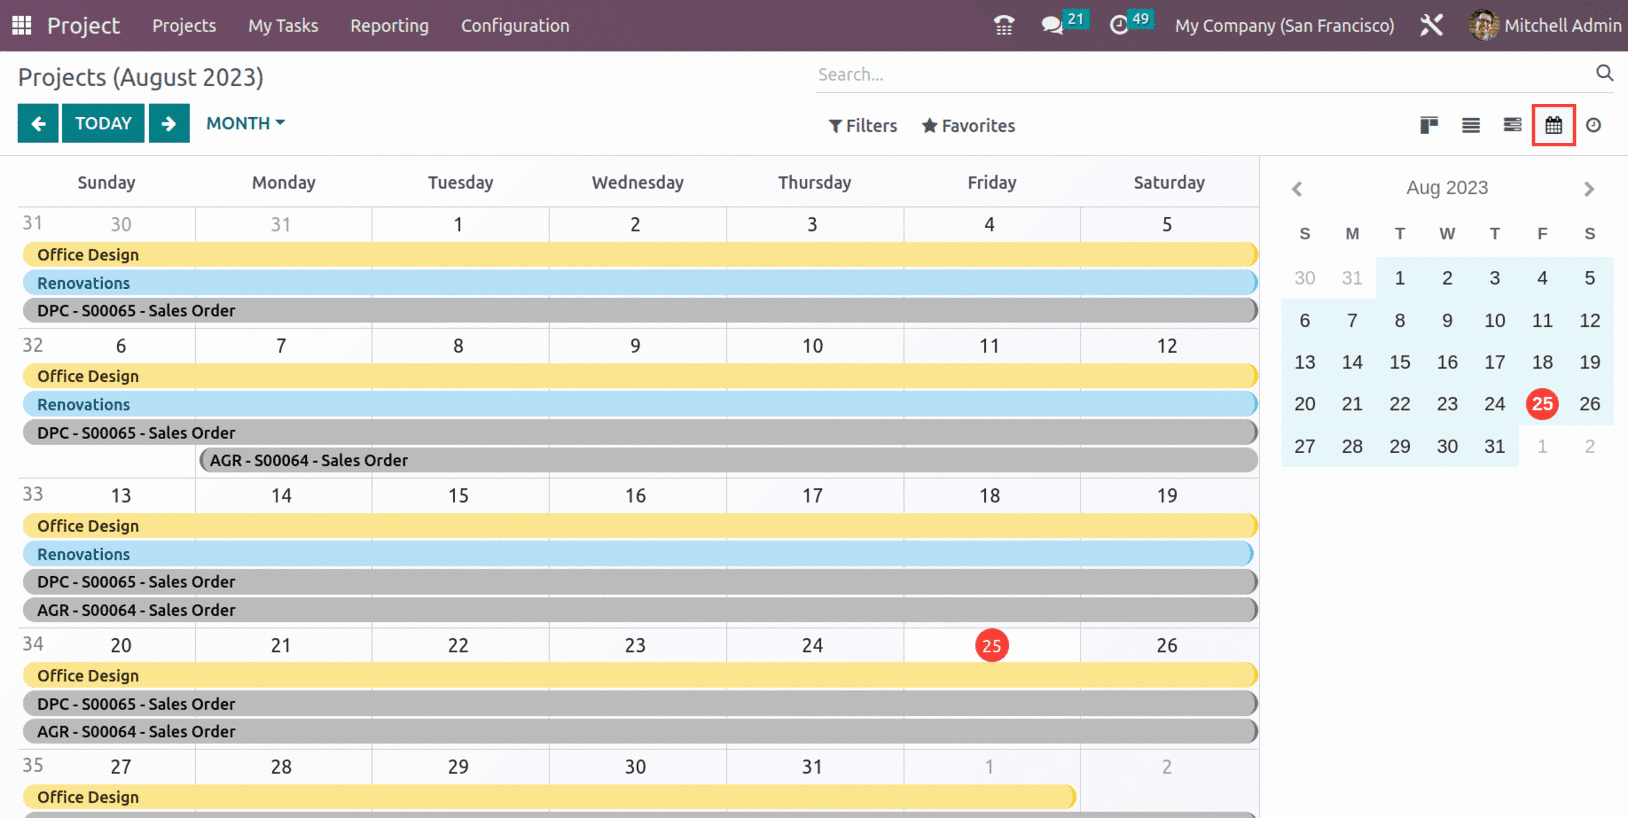
The next view that can be seen in the Project dashboard is the Calendar view. The calendar view is essential in any organization. This allows things to be done in a methodical manner and keeps employees up to date.
As its name suggests, this view type displays the data from a calendar type. As a result, it may be seen as a month, week, or day. In the application section, this view is most commonly used to establish appointments, plan days, To-do lists, and so on. The calendar view displays the data in a timeline/schedule format.
Now, if we check the Project, within the Project itself, the user can view different sets of views such as Kanban, List, Gantt, Calendar, Map, Pivot, Graph, and Activity.
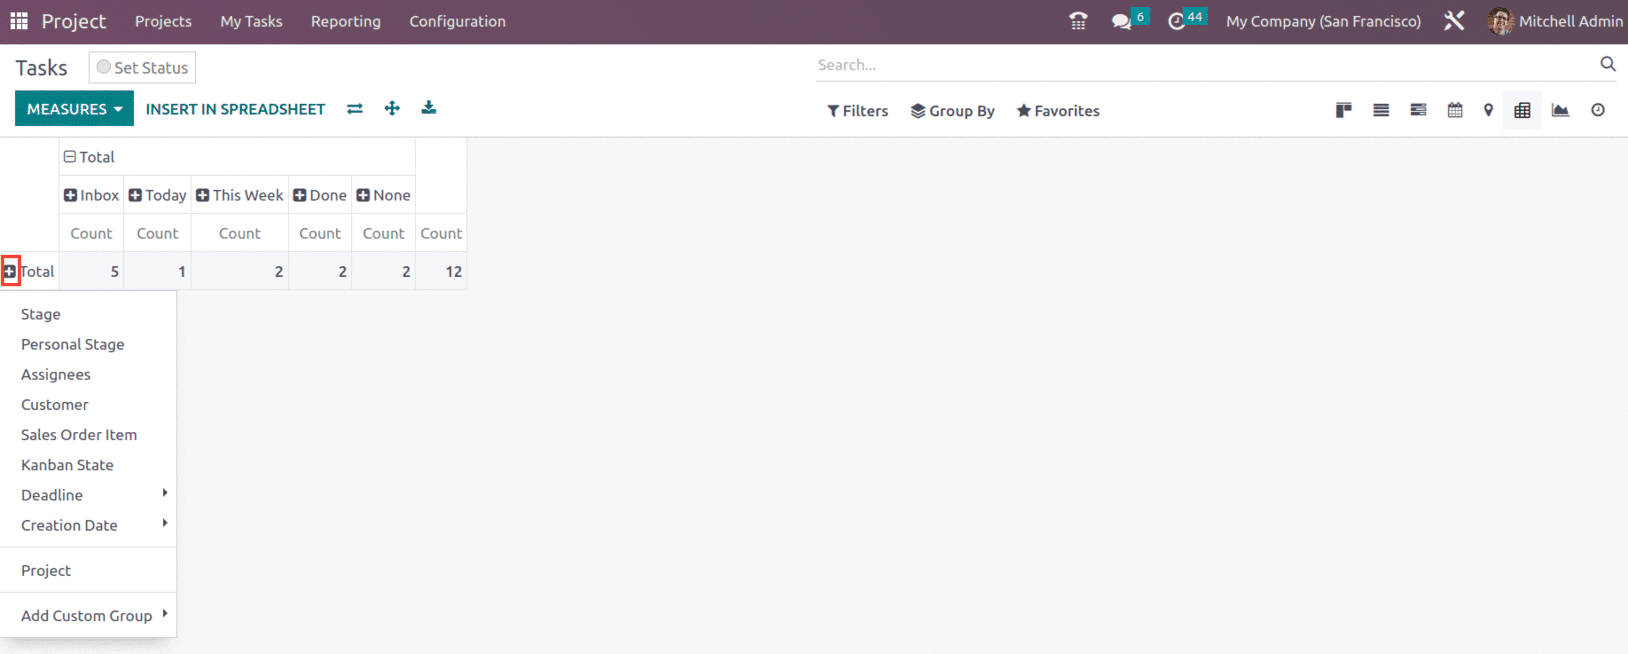
The next set of views is the Pivot view. It allows the end-user to analyze the operations and which provides different choices to filter reports based on certain fields used in the model. and also allows us to obtain the filtered report.

In this view, the plus button next to the total option displays all of the fields associated with that model. Furthermore, if you pick one of the fields, the filtered report presentation is displayed based on the field you selected.
The next set of views is the Map view, Map views are view types in Odoo Enterprise that display data on a geographical map. Any model with a location field, such as a partner or an event, may have a map view built.
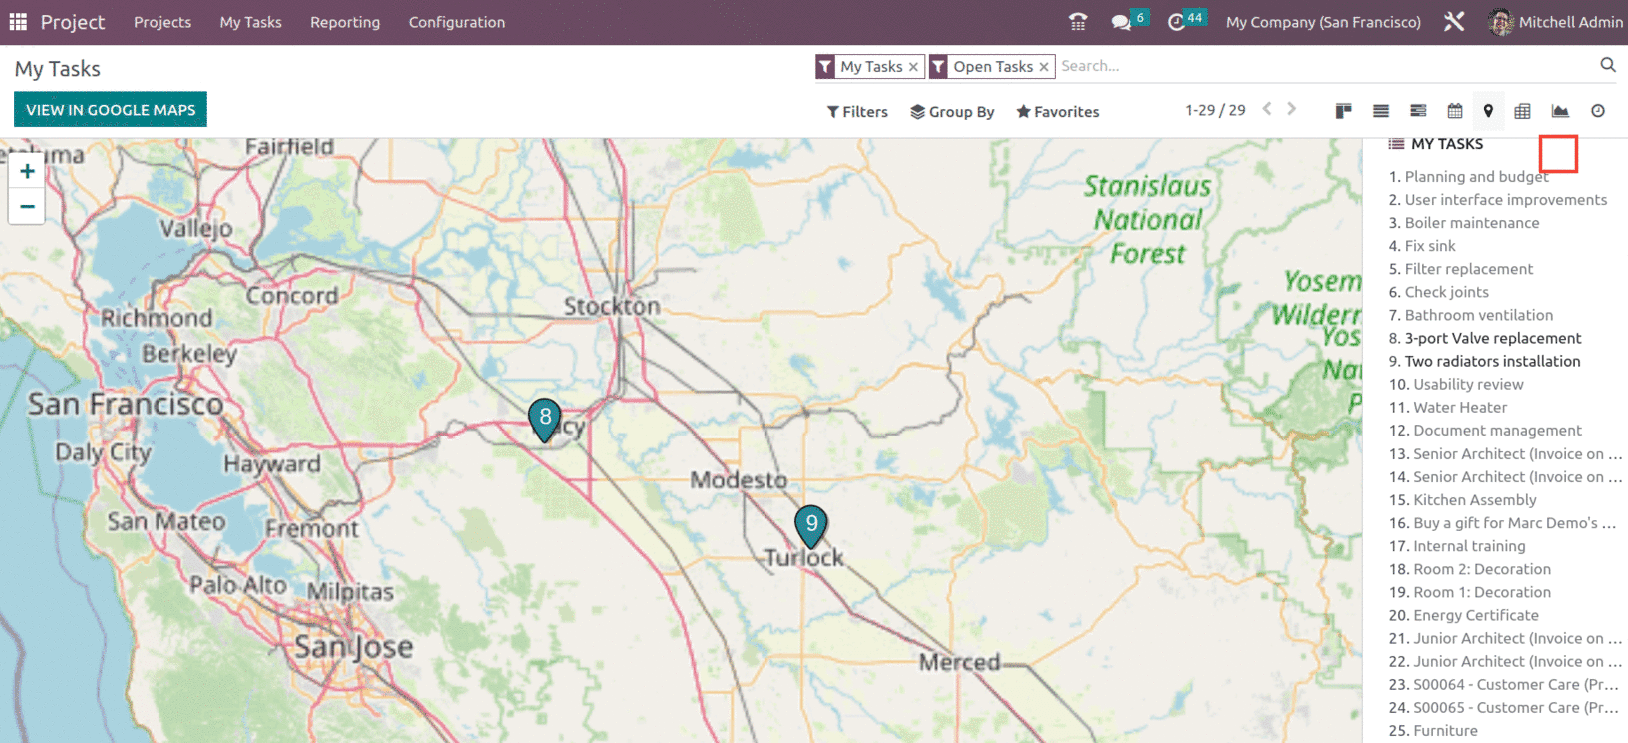
These map views are excellent for presenting a geographical representation of data, allowing users to see and analyze data more intuitively. The user can also connect to Google Maps, as shown above.
To read more about important basic views in Odoo 16, refer to our blog What are the Basic Views in Odoo 16