We all know that Odoo is an open-source ERP solution that can include almost every area of enterprise and business. In this blog, We are going to discuss how to set up a Dynamic dashboard in Odoo. A dashboard in Odoo is a graphical user interface that displays information and data in a visual format. It allows you to get a quick overview of your business operations and make data-driven decisions.
To create a dynamic dashboard in Odoo, you can use the "Odoo Dynamic Dashboard" module, which is available in the Odoo App Store. With this module, you can create a dashboard with customizable widgets that display various types of information, such as graphs, charts, and tiles. You can also set up filters to display specific data on the dashboard, and you can customize the layout of the dashboard to suit your needs.
The main features of this connecter are:
1.Can configure new charts and tiles.
2.Can create Dynamic Menu easily.
3.Can add background and font color for tiles and an option for selecting FontAwsome icons.
4.Chart typed: Bar, line, radar, Pi, Doughnut, and option to select chart sizes.
Let's see how to create Dynamic Dashboard:
Step 1: Install Odoo Dynamic Dashboard from the Odoo app store.
Download the app from the Odoo store using the link above and install it.

Step 2: Open the Dashboard in the Odoo.
On starting, we can see two buttons, ‘Add Block’ and ‘Add Graph’. With the help of these two buttons, we can create new blocks and graphs correspondingly.
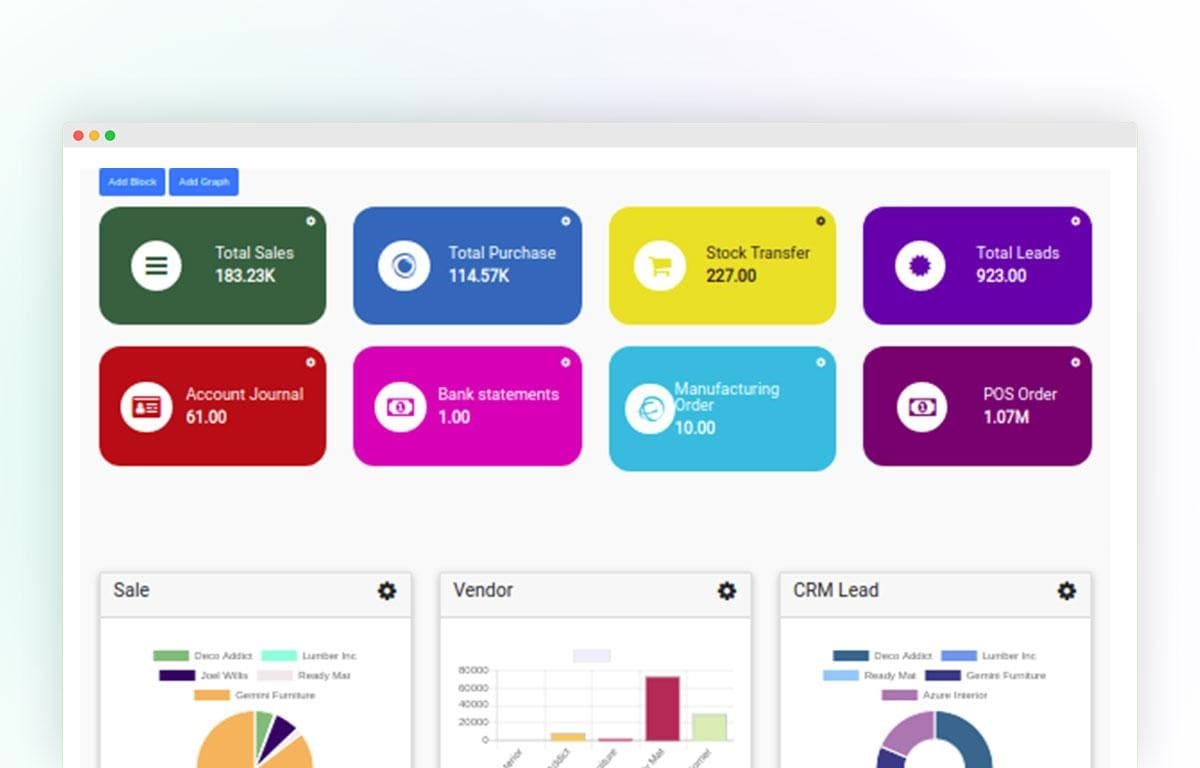
Step 3: Configure Block and Graph
To configure Block click the gear icon on the upper right corner.
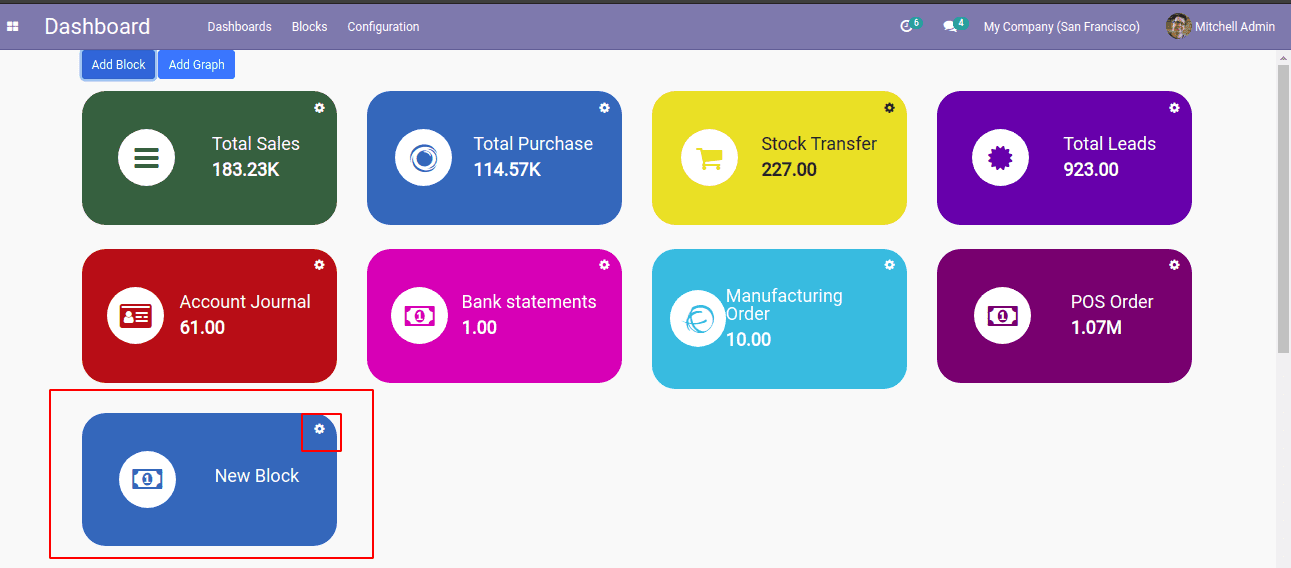
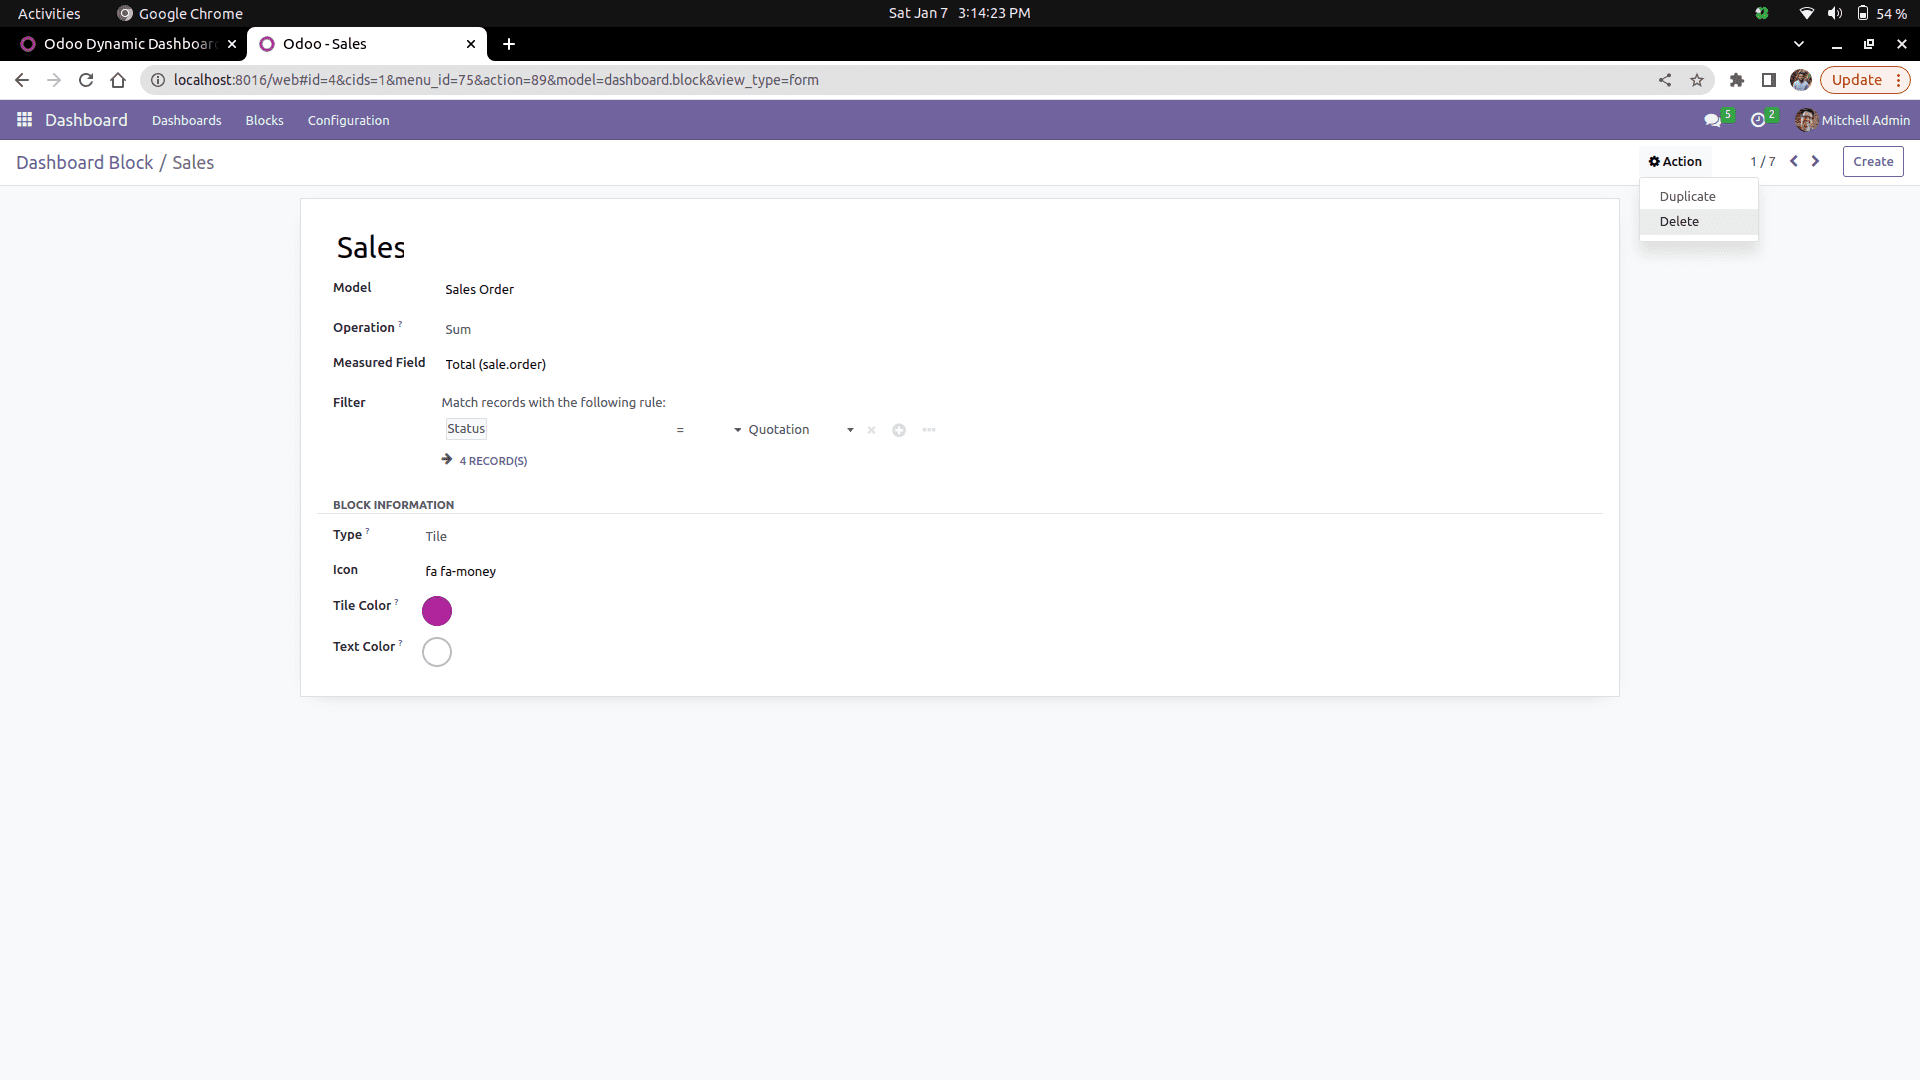
A new form will be opened, as shown below.
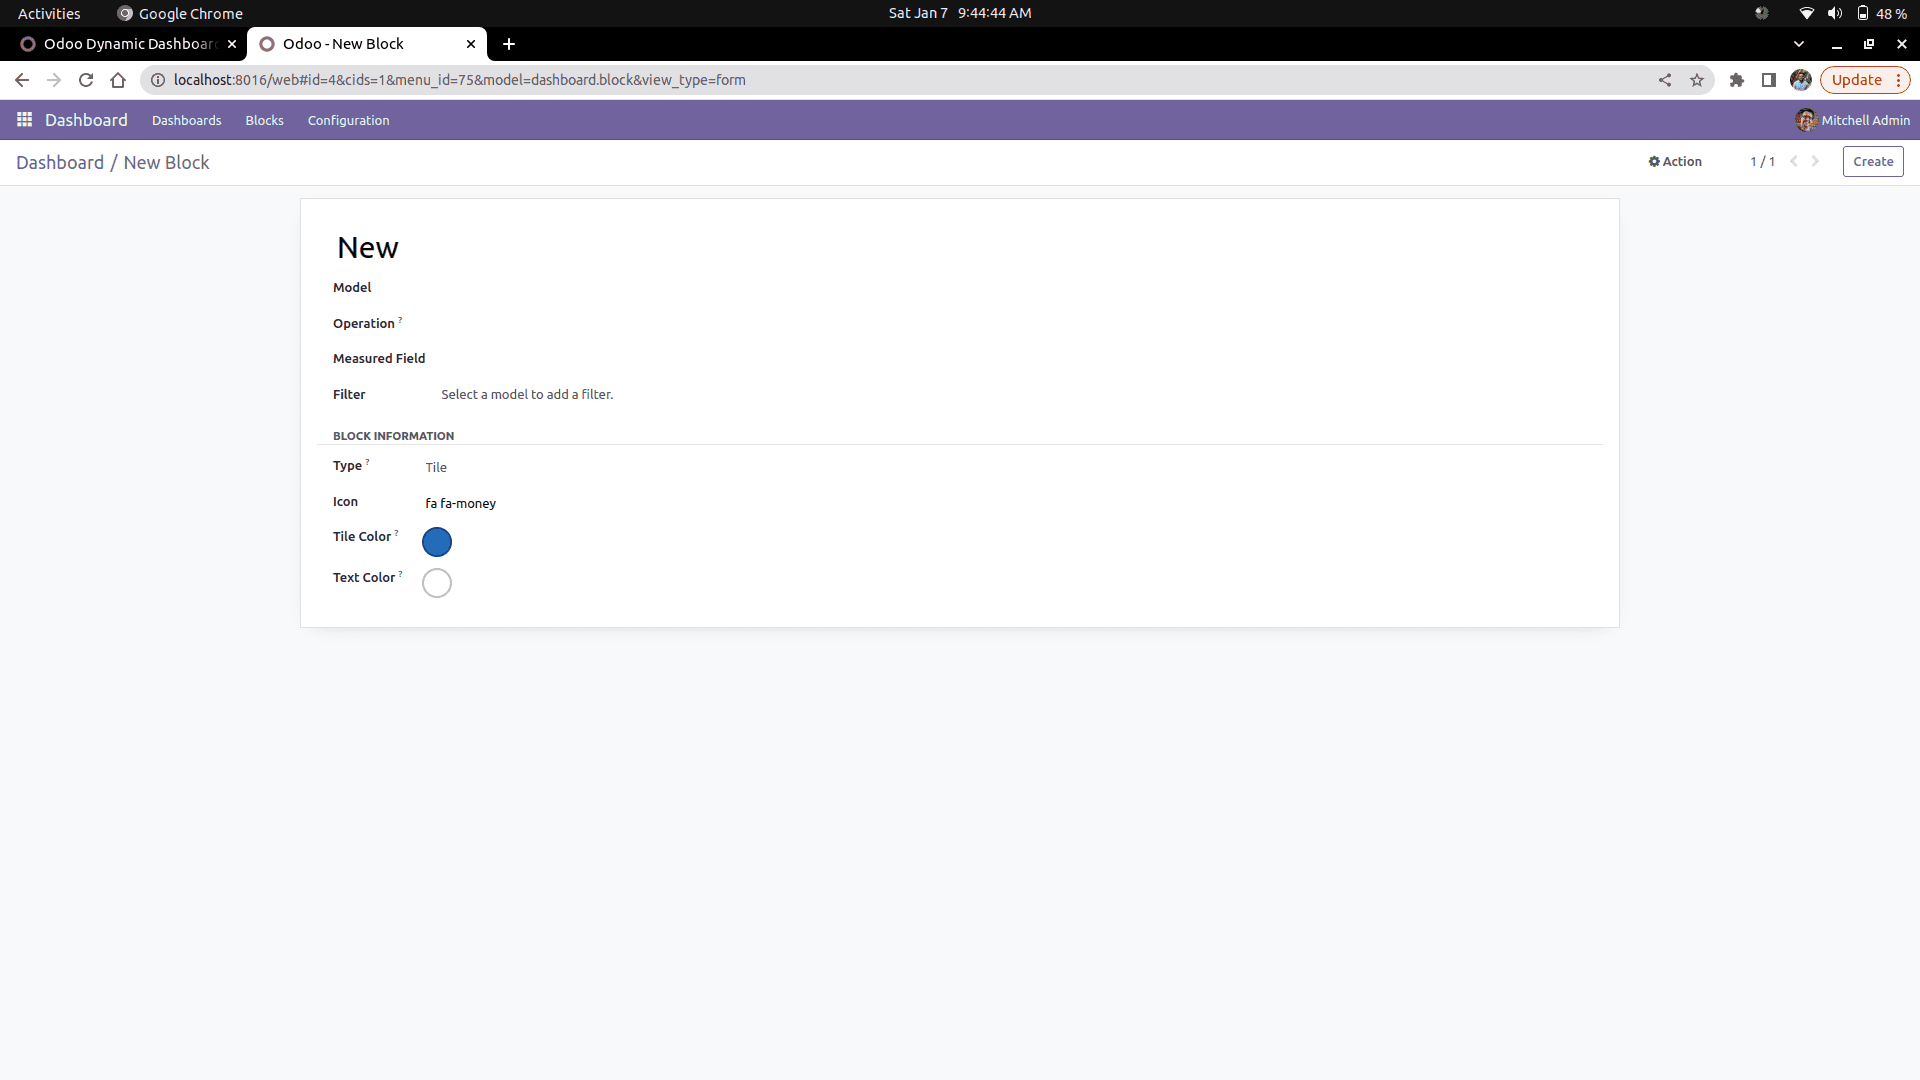
By using this form, we can customize the dashboard tile.
We can select the models to be shown in the tile using the ‘Model’ field. All the models in our Odoo will be listed in the area, and we can select any one of them for our tile. Tile operation that needs to bring values for tile can be selected from the ‘Operation’ field. There are three operations. Sum, Average, and Count. We can select the field to be shown in the tile from ‘Measured fields.’ All fields in the selected models will be listed in the area. We can select any one of them. We can also give filters to the data to be shown in the tile using the ‘Filter’ field. We can find the number of records under the filter field, and the external link will open a wizard with all the records.
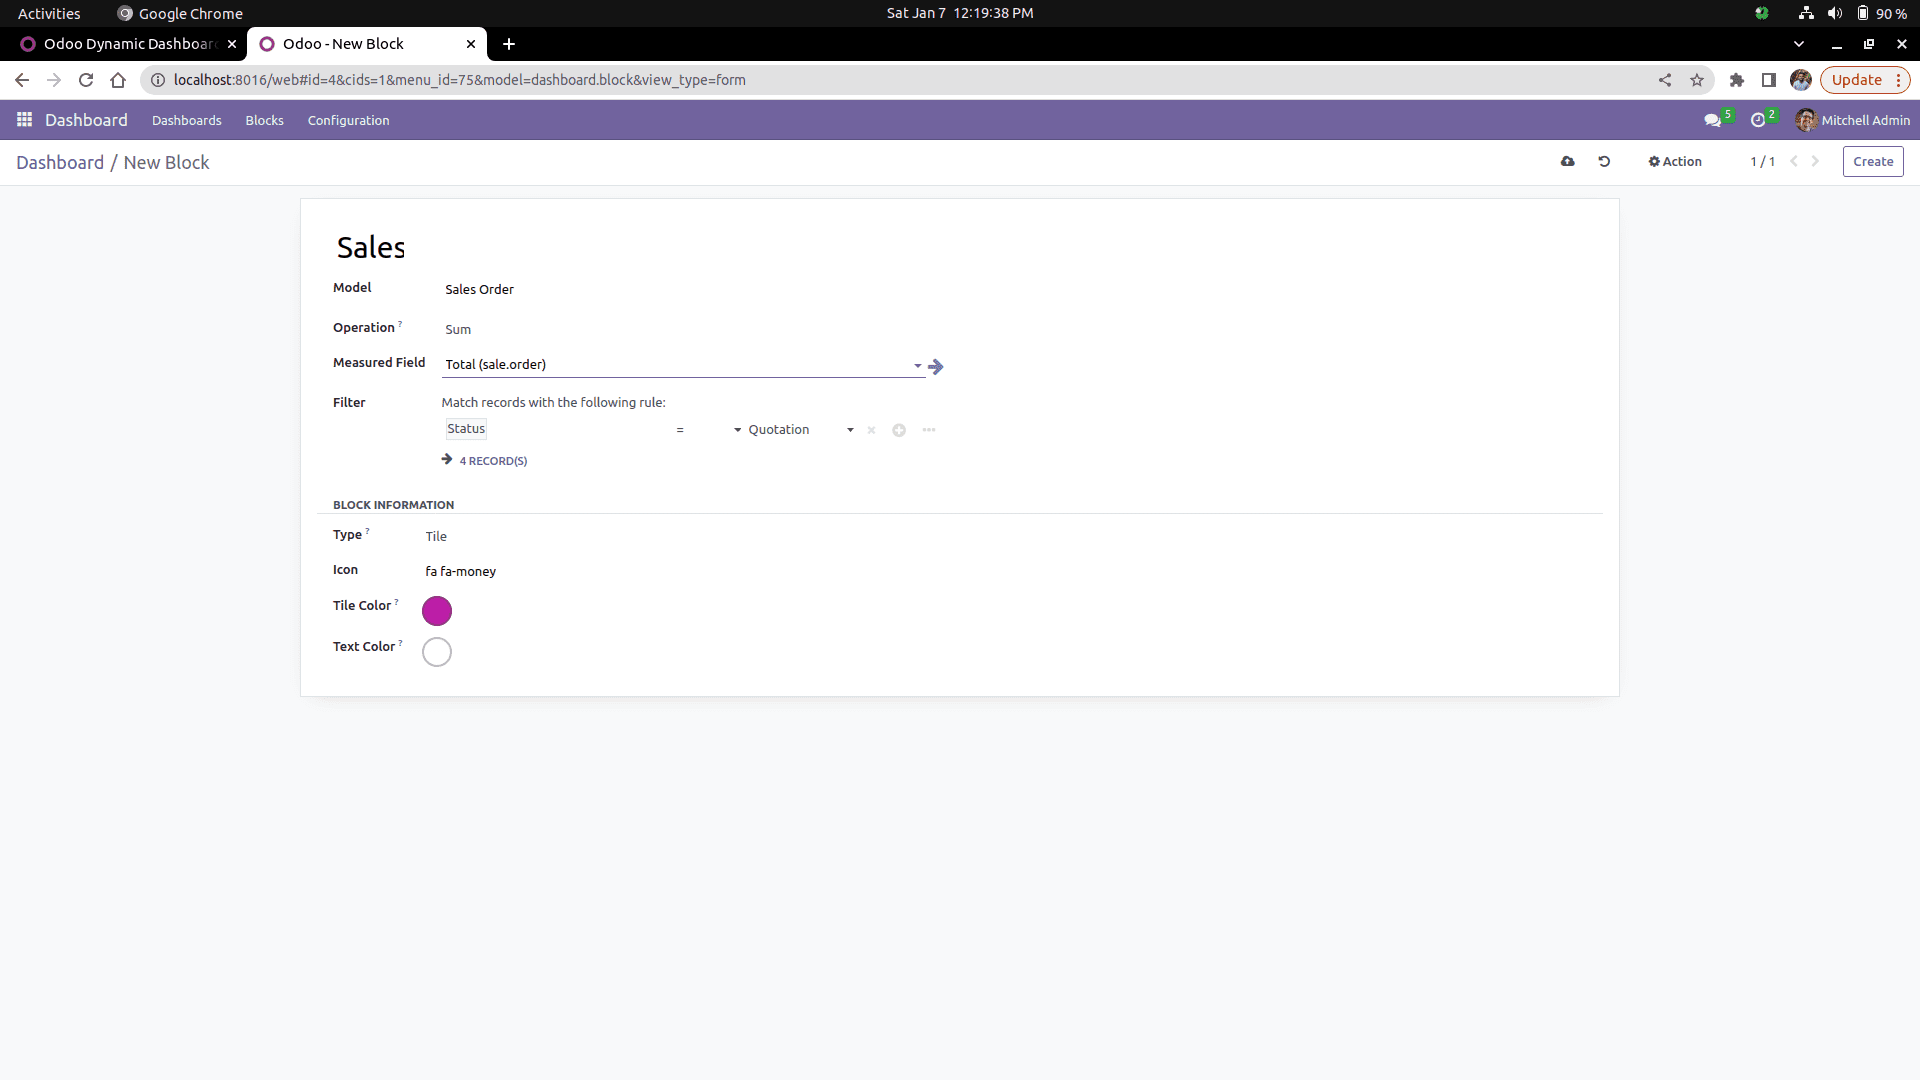
In the Block Information tab, we can set the type of block, whether Tile or Chart. And also can customize the tile color and font color.
We can configure the charts using the gear icon in the upper right corner.
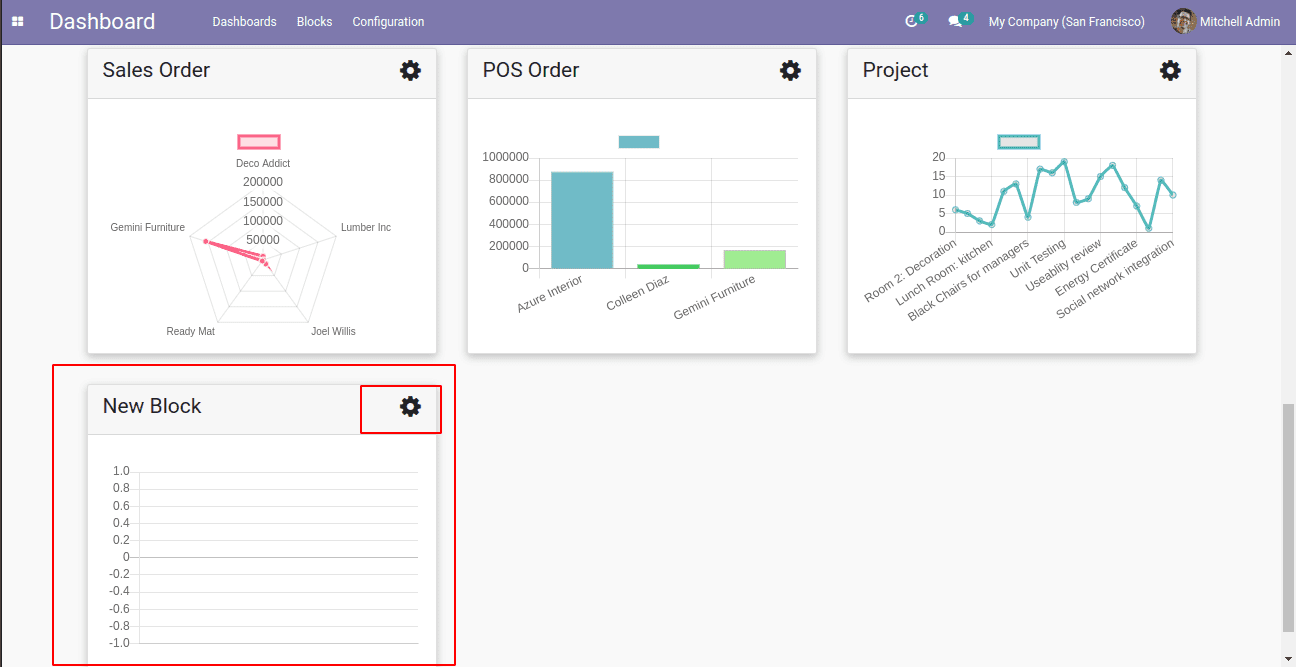
In the form, when we select the type chart, we can see chart customization options. We can select different types of charts like line, bar, pie, doughnut, and radar. Also can choose different graph sizes like small, medium, and large.
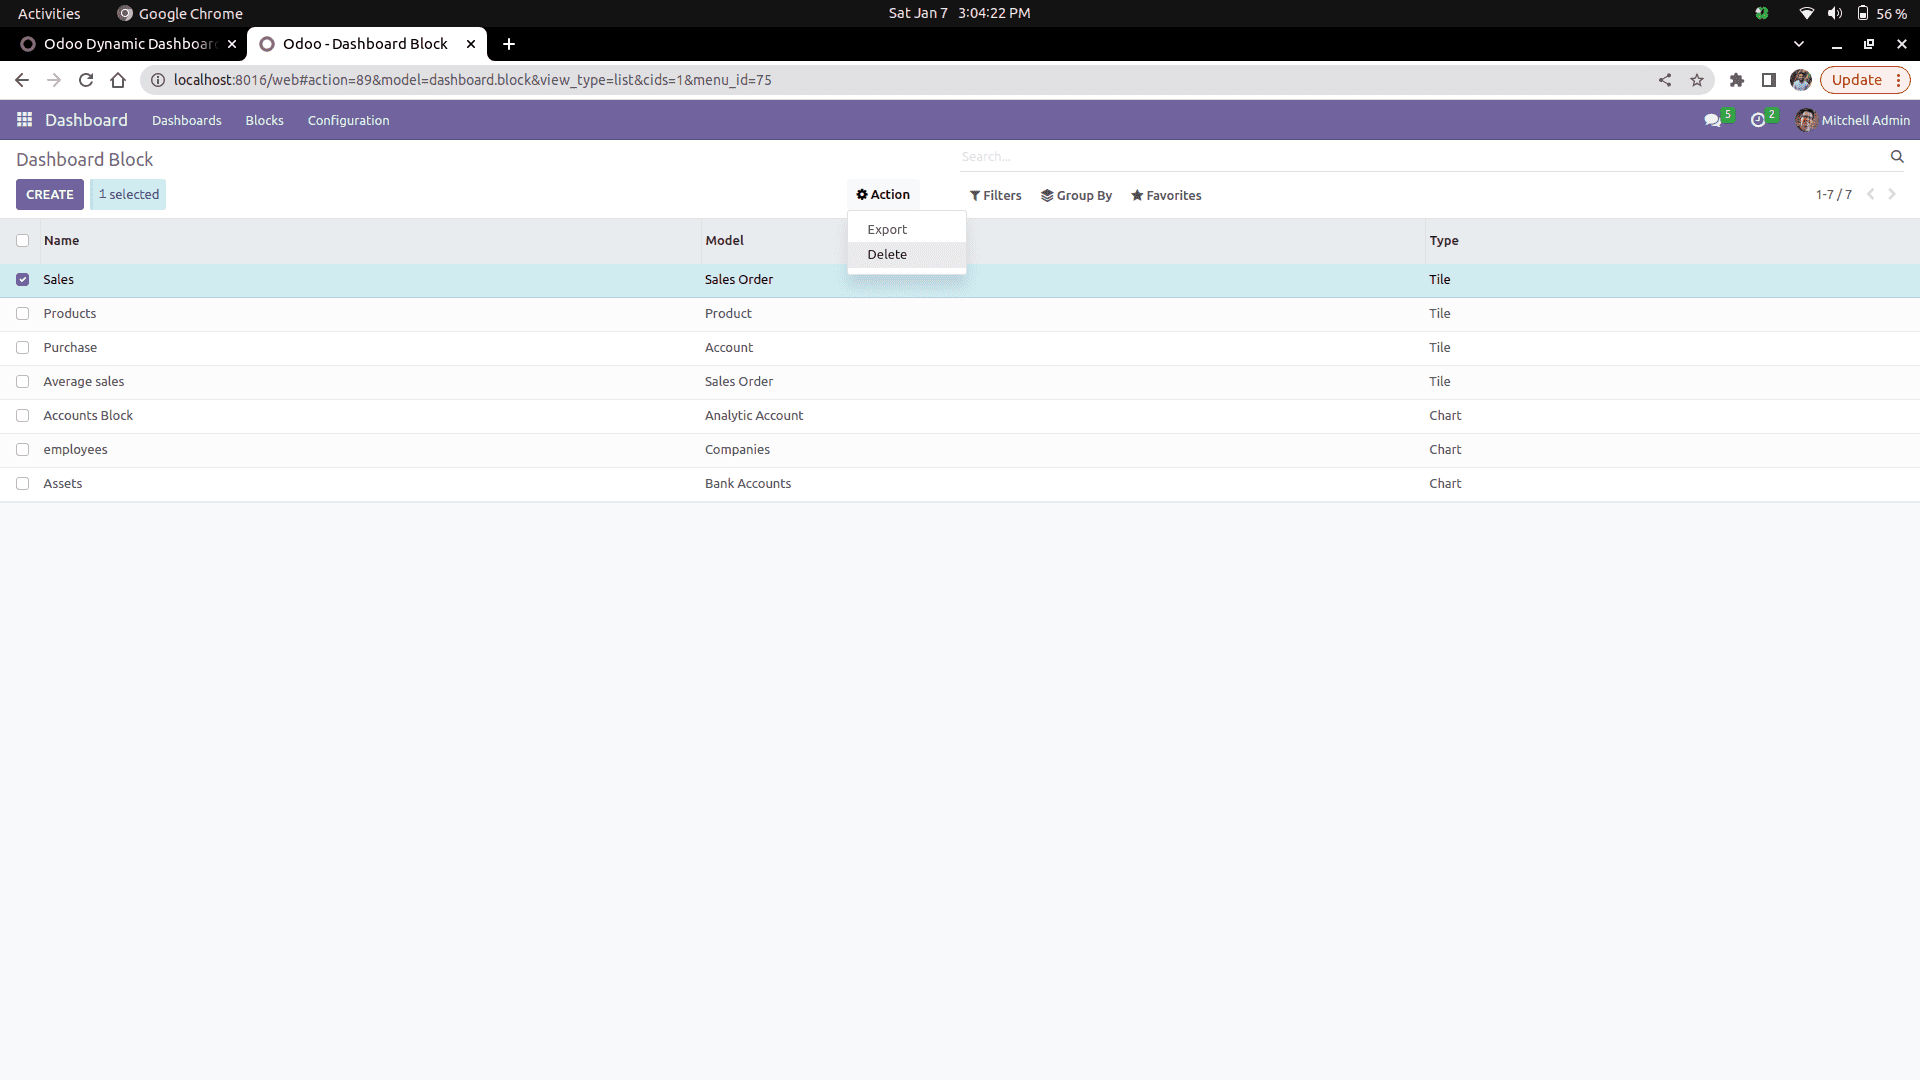
In the Blocks Menu, we can see all the created blocks as a list view, which will redirect to the corresponding form view of the block that can edit the configuration of the blocks.
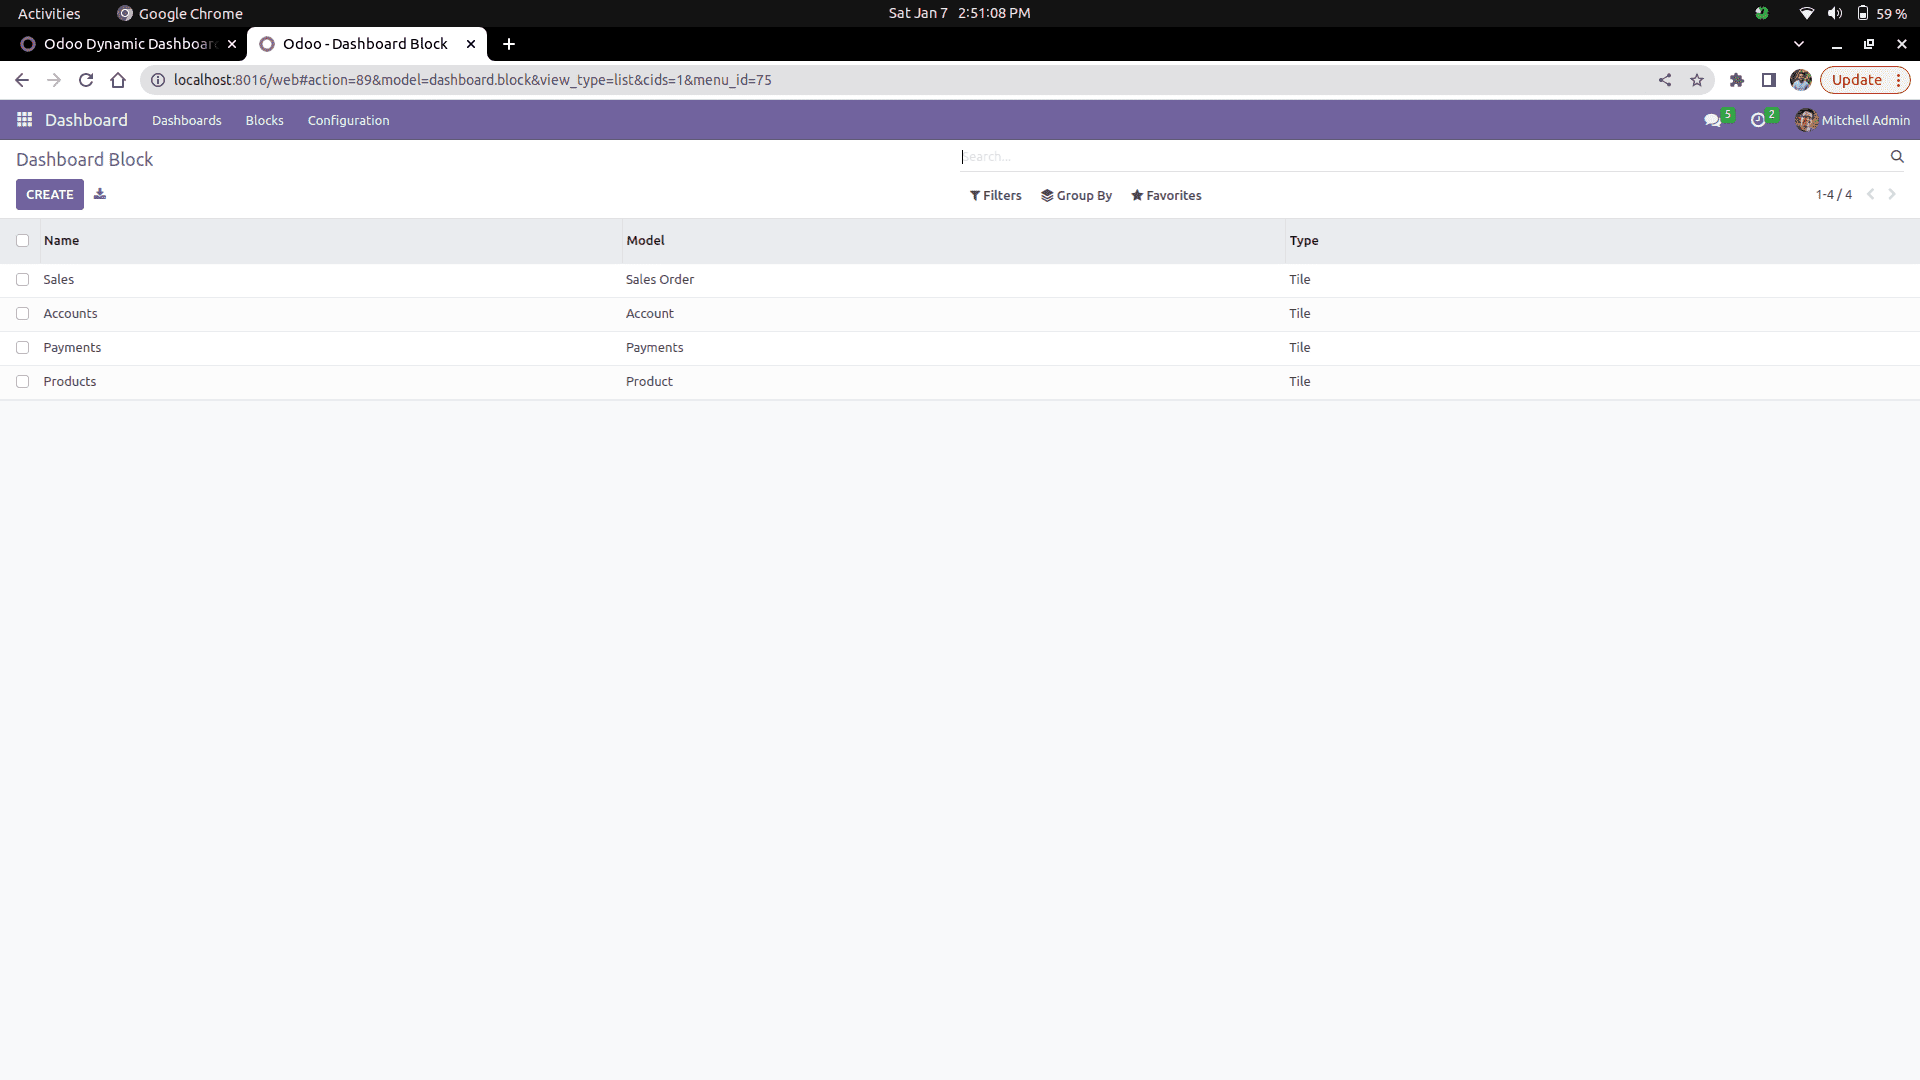
From this list view, we can delete the blocks by the ‘delete’ button inside the action button. The ‘action’ button will make visible when any one of the lines are selected.
We can also delete the blocks from the form view. There is a ‘Delete’ button Inside the ‘action’ button on the upper right side of the form view.
This is how we can configure the Dynamic dashboard in Odoo.