Every organization wants to know its progress and needs to present its growth before boards and authorities. A report can help here. Odoo offers a variety of reports, including PDF, Pivot, Graph, and more.
Custom modules also allow you to customize your reports. As with regular Odoo views, reports are created using HTML/QWeb. Report Actions and Report Templates are used to generate reports for your actions.
Odoo has a default layout. Like web.external_layout. web.internal_layout etc.
You can also create new report layouts using custom reports. This blog will help you create a new report layout in Odoo.
To create a new external custom layout, you need to create a template.
Add an XML file to your view or report directory.
<template id="custom_report_external_layout">
<t t-call="web.html_container">
<t t-if="not o" t-set="o" t-value="docs" />
<t t-set="company" t-value="company_id" />
<div class="header">
<div style="border-top: 1px solid black;">
<img t-if="o.company_id.logo" t-att-src="image_data_uri(o.company_id.logo)" alt="Company Logo" class="float-left" />
<div style="font-size:14px;text-align:right;" class="float-right">
<div>
<strong t-field="o.company_id.partner_id.name" />
<span t-field="o.company_id.partner_id" t-options="{"widget": "contact", "fields": ["address"], "no_marker": true}" />
<span t-field="o.company_id.partner_id.website" />
</div>
</div>
</div>
</div>
<div class="footer">
<div class="text-center" style="border-top: 1px solid black;">
<ul class="list-inline">
<li t-if="o.company_id.phone">E-mail: <span t-field="o.company_id.email" />
</li>
</ul>
</div>
</div>
</t>
</template>
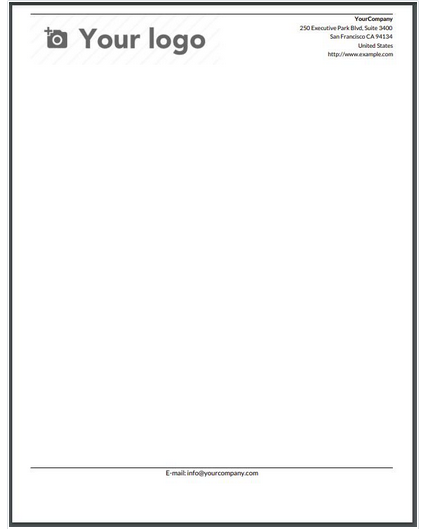
The template above adds the company logo, company name, and website to the report header. And the company email will appear in the footer.
All the information you need is in the documentation. You can pass more information from Python to the template as needed.
Here I created a custom template called "custom_report_external_layout".
You can create multiple custom templates and call them in your reports as needed.
The report looks like this:

In summary, a Report is an easy way to analyze big data. For efficient analysis, reports should have a simple and structured layout. You can customize the report layout according to your needs.