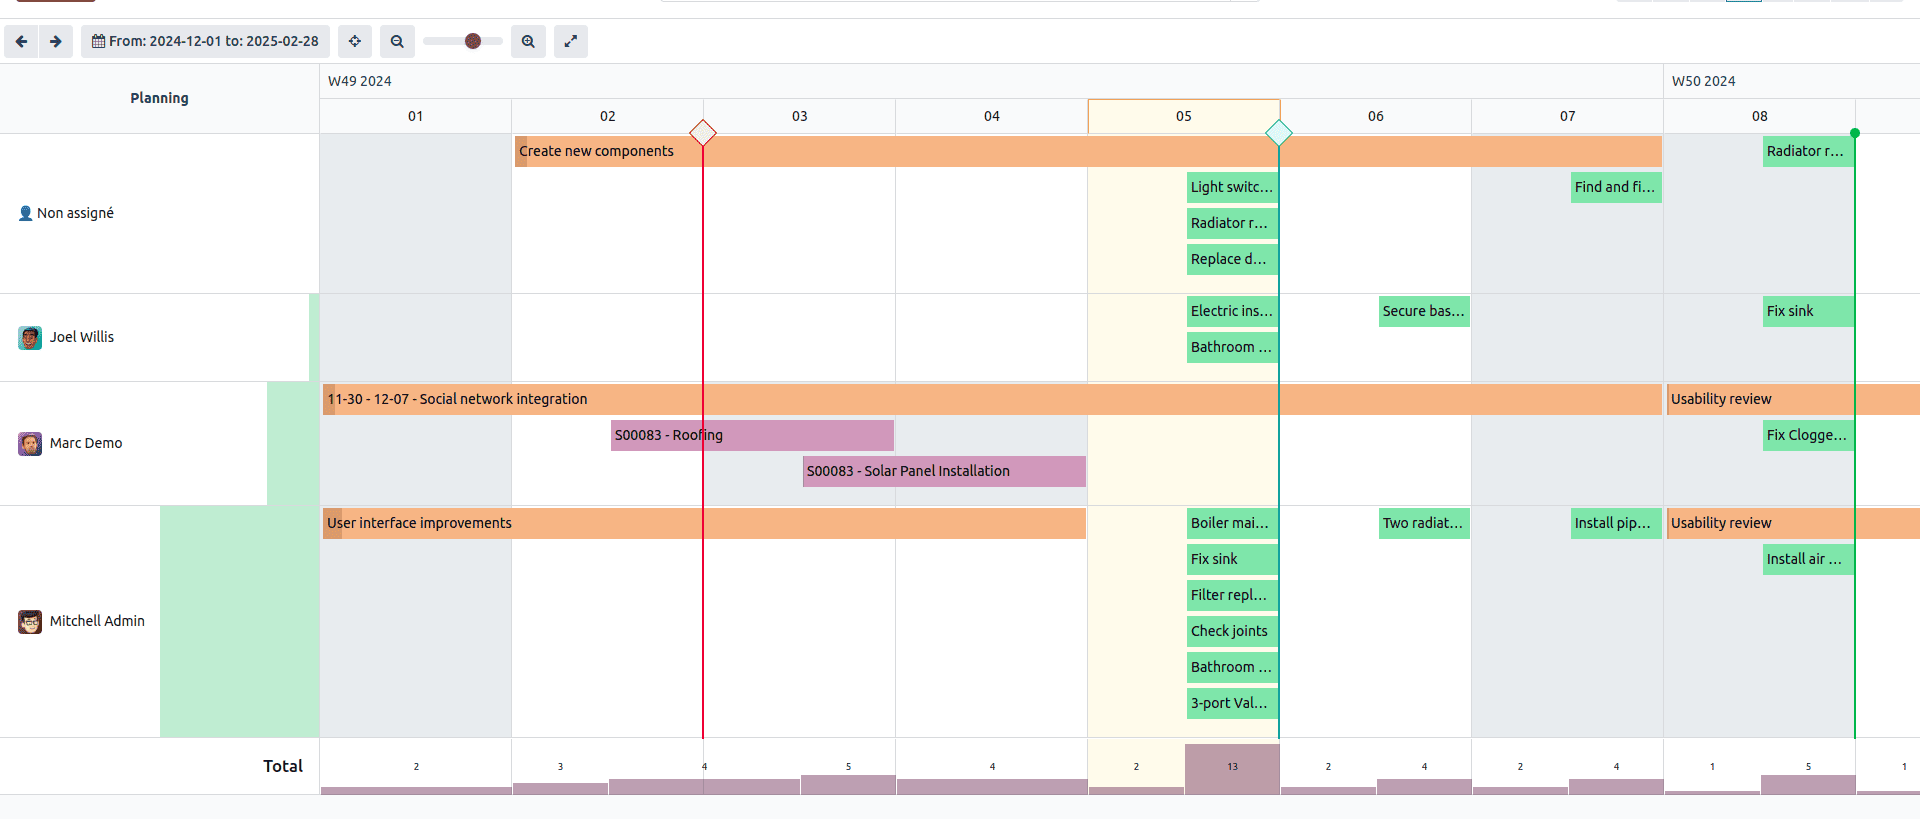
Odoo is a versatile platform that offers various view types like tree, form, kanban, calendar, and graph. Each of these views is tailored to meet specific requirements, helping users visualize data effectively. Among these is the Gantt view, a powerful tool designed for planning, scheduling, and managing timelines efficiently.
Understanding the Gantt View in Odoo
The Gantt view is a horizontal bar chart visualization, typically used to represent schedules and timelines. It allows businesses to track tasks, production schedules, and other time-sensitive activities. This feature is part of Odoo's Enterprise edition and relies on the web_gantt module, which can be installed via the Apps menu.
A Gantt view provides a clear overview of tasks or events, complete with grouping, filtering, and progress tracking options. Its visual appeal and ease of use make it an indispensable tool for project managers and schedulers.
Features of the Gantt View
The Gantt view in Odoo offers the following benefits:
* Interactive Timeline: Allows users to adjust start and end dates directly on the chart.
* Grouping and Filtering: Organize data by categories or filters for better clarity.
* Multiple Time Scales: Switch between day, week, month, and year views to see a detailed or broader picture.
* Progress Tracking: Visualize task completion with progress indicators.
* Customizable Colors: Differentiate tasks or categories using colors.
With these features, the Gantt view not only provides visibility into schedules but also enables users to optimize resource allocation and streamline workflows.

Attributes for Creating a Gantt View
When creating a Gantt view, you’ll use the following attributes:
* String: The name of the Gantt view.
* Date Start / Date Stop: Specifies the timeline of each task.
* Default Group By: Groups data by a specific field, such as employees or projects.
* Progress: Indicates the percentage of task completion.
* Default Scale: Defines the initial time scale (day, week, month).
* Scales: Lists available time scales for the view.
* Precision: Controls how time intervals are displayed (hour, minute, etc.).
* Color: Adds visual distinction to bars based on criteria.
By using these attributes, you can create a highly customized and functional Gantt view that suits your business needs.
Example: Comprehensive Gantt View in Odoo 18
Let’s walk through an example that utilizes all the Gantt view attributes.
Step 1: Define the Model
First, define a model in Python that includes fields for start and stop dates, grouping criteria, and progress tracking. Here’s an example:
from odoo import fields, models
class ProjectTask(models.Model):
   _name = 'project.task'
   _description = 'Project Tasks'
   name = fields.Char(string="Task Name", required=True)
   start_date = fields.Date(string="Start Date", required=True)
   end_date = fields.Date(string="End Date", required=True)
   progress = fields.Float(string="Progress", default=0.0)
   assigned_to = fields.Many2one('res.users', string="Assigned To")
   project_id = fields.Many2one('project.project', string="Project")
   color = fields.Integer(string="Color Index")
This model includes fields for task name, start and end dates, progress, assigned user, and project association. It also features a color field for customizing bar colors.
Step 2: Define the Gantt View in XML
Create an XML file that specifies the Gantt view. The <gantt> tag is the core element for defining this view.
<odoo>
   <record id="view_project_task_gantt" model="ir.ui.view">
       <field name="name">project.task.view.gantt</field>
       <field name="model">project.task</field>
       <field name="arch" type="xml">
           <gantt
               string="Project Tasks"
               date_start="start_date"
               date_stop="end_date"
               default_group_by="project_id"
               progress="progress"
               default_scale="week"
               scales="day,week,month,year"
               precision="{'day': 'hour:full', 'week': 'day:full', 'month':
                           'day:full', 'year': 'day:full'}"
               color="color">
               <field name="name"/>
               <field name="assigned_to"/>
               <field name="project_id"/>
               <field name="progress"/>
           </gantt>
       </field>
   </record>
   <record id="action_project_task_gantt" model="ir.actions.act_window">
       <field name="name">Gantt Tasks</field>
       <field name="res_model">project.task</field>
       <field name="view_mode">list,form,gantt</field>
   </record>
   <menuitem id="menu_project_task_gantt" name="Project Gantt"
       action="action_project_task_gantt"/>
</odoo>
Key Features of this Gantt View:
* Date Start/Stop: The start_date and end_date fields determine the timeline of tasks.
* Default Group By: Tasks are grouped by project_id, allowing you to see tasks per project.
* Progress Tracking: The progress field shows task completion as a percentage.
* Default Scale and Scales: Users can toggle between day, week, month, and year views.
* Precision: Time intervals are displayed in hours for detailed tracking.
* Color: Different colors represent tasks based on the color field.
Step 3: Test and Use the Gantt View
After implementing the above configurations, navigate to the corresponding menu in Odoo to access the Gantt view. Tasks will appear as horizontal bars with their start and end dates plotted along the timeline. You can:
* Drag and drop tasks to adjust their schedules.
* Use the progress bar to visualize task completion.
* Filter tasks by project, user, or other criteria.

By using the Gantt view in Odoo 18, businesses can improve their planning processes and streamline project management. The flexibility of attributes and customization options ensures the view aligns with diverse business needs. Start creating your own Gantt view today and unlock its potential for efficient scheduling and resource allocation.
To read more about How to Create Gantt View in Odoo 17, refer to our blog How to Create Gantt View in Odoo 17.