Dashboards play a crucial role in Odoo by providing a comprehensive and visually appealing overview of key business data. They allow users to monitor critical metrics, track performance, and make informed decisions efficiently. With the release of Odoo 18, creating dashboards has become even more streamlined, thanks to enhanced tools and improved user experience. Odoo is a powerful and flexible ERP system that provides various ways to display and interact with data. In Odoo 18, views play a crucial role in defining how users see and manage records within different modules. These views help enhance user experience by offering structured and visually appealing layouts.
In this blog, we will explore the process of creating a custom dashboard in Odoo 18, covering everything from the basic setup to advanced customization. Whether you are a developer or a business user, this guide will help you build dynamic dashboards tailored to your specific needs. Let’s dive in!
In Odoo 18, client actions are used to render dashboards. These actions are typically triggered through menu items, allowing users to access interactive and dynamic dashboard views.
Defining the Client Action
To render a custom dashboard, we need to define a client action in the ir.actions.client model. This action links the dashboard to a specific JavaScript component via a tag.
<record id="crm_dashboard_action" model="ir.actions.client">
  <field name="name">CRM Dashboard</field>
  <field name="tag">crm_dashboard_tag</field>
</record>
<menuitem name="Dashboard" id="crm_dashboard"
         sequence="0" action="crm_dashboard_action"
         parent="crm.crm_menu_root"/>
* ‘name’ field: Defines the display name of the dashboard in Odoo.
* ‘tag’ field: Links the JavaScript file with the client action.
When the "Dashboard" menu item is clicked, it triggers crm_dashboard_action, which then connects to the JavaScript file via the specified tag (crm_dashboard_tag).
Creating the JavaScript Component
Next, we create a JavaScript component that will handle the rendering of the dashboard. Create a JavaScript file in static/src/js/dashboard.js:
/** @odoo-module **/
import { registry } from "@web/core/registry";
import { Component } from "@odoo/owl";
const actionRegistry = registry.category("actions");
class CrmDashboard extends Component {}
CrmDashboard.template = "my_module.CrmDashboard";
// Register the component with the action tag
actionRegistry.add("crm_dashboard_tag", CrmDashboard);
* The JavaScript file imports Odoo's Owl framework to define a dashboard component.
* The actionRegistry.add() method connects the component to the crm_dashboard_tag, ensuring it is triggered when the action is called.
* The component uses an XML template to define the dashboard’s UI.
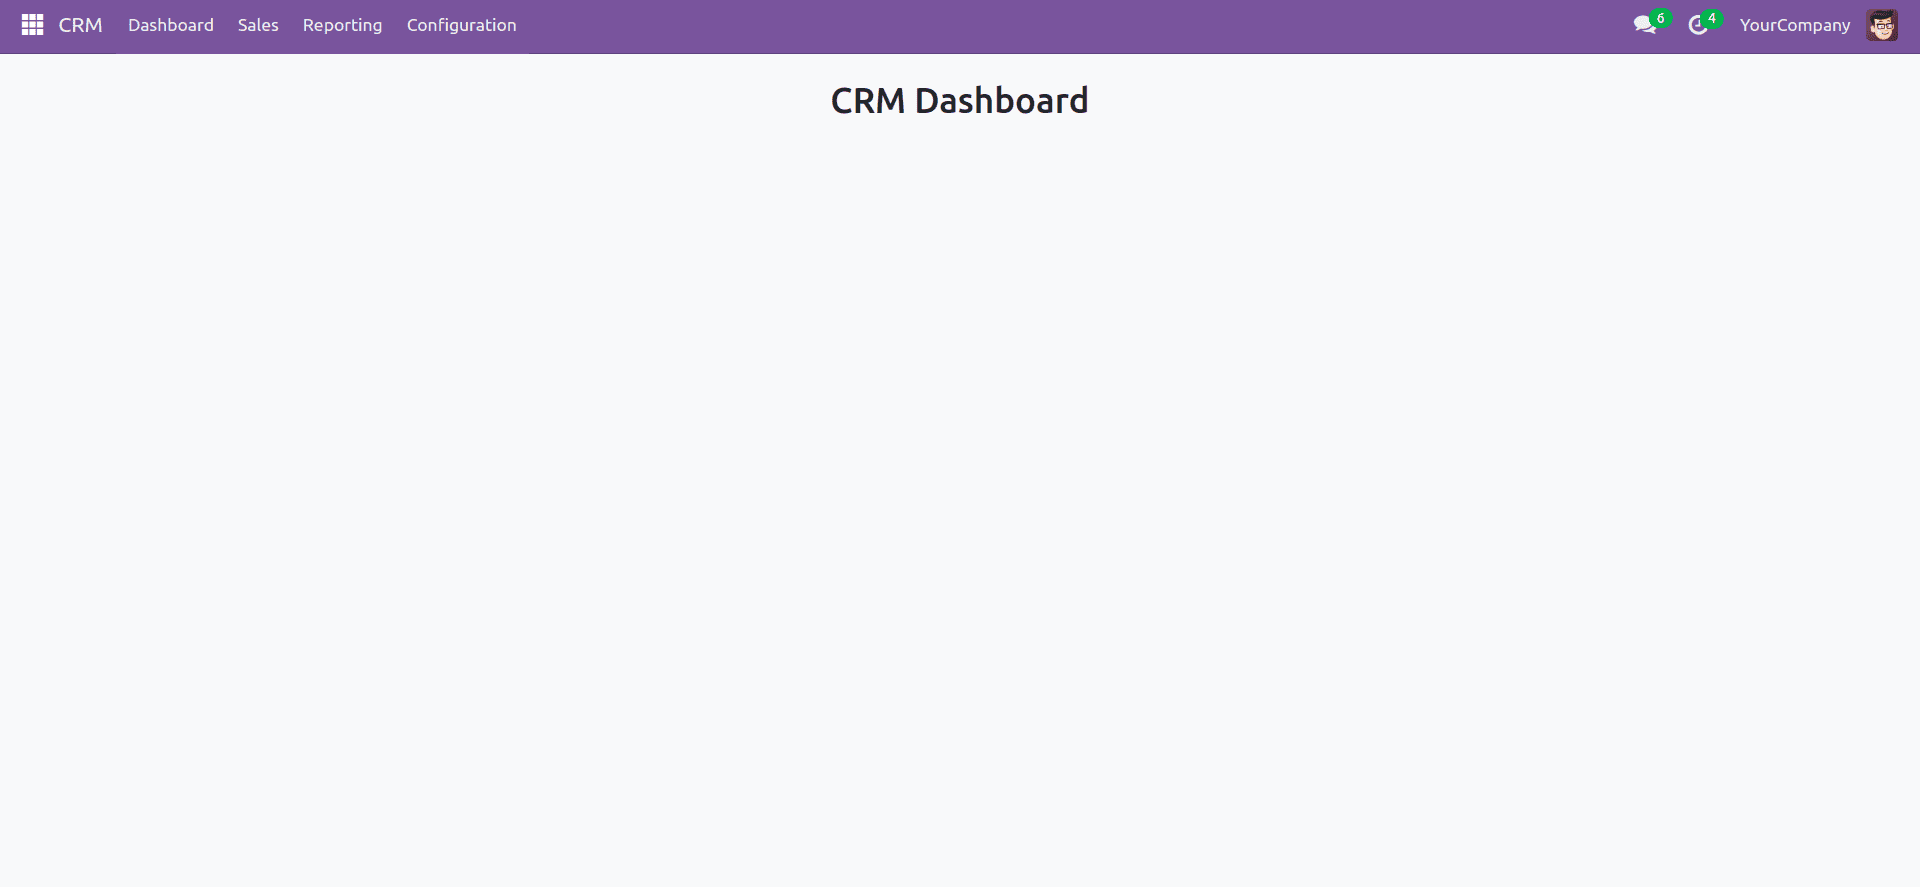
At this stage, the user interface will display a blank dashboard view.
Creating the Dashboard Template
To display content inside the dashboard, we need to create an XML template. Create an XML file in static/src/xml/dashboard.xml:
<?xml version="1.0" encoding="UTF-8" ?>
<templates>
   <t t-name="my_module.CrmDashboard">
       <div>
           <div>
               <center>
                   <h1 style="margin:20px;">CRM Dashboard</h1>
               </center>
           </div>
       </div>
   </t>
</templates>
* The template defines a simple heading ("CRM Dashboard") centered on the page.
* This template is linked to the JavaScript component through the t-name="my_module.CrmDashboard" attribute.
Adding Files to the Manifest
To ensure the JavaScript and XML files are loaded correctly, they must be included in the module’s __manifest__.py file:
'assets': {
   'web.assets_backend': [
       'my_module/static/src/js/dashboard.js',
       'my_module/static/src/xml/dashboard.xml',
   ],
},
This ensures that the dashboard assets are properly loaded in the Odoo backend.
After completing these steps, you will have a functional blank dashboard integrated into Odoo 18. You can now expand it by adding widgets, charts, and other interactive components to enhance usability.
Adding Tiles to the Odoo Dashboard
Now let's add tiles to the Odoo dashboard and fetch data dynamically using ORM calls in JavaScript.
HTML Structure for Tiles:
<div class="row main-section" style="margin-left: 120px;">
   <!-- Lead Tile-->
   <div id="leads" class="col-md-4 col-sm-6 tot_tasks oh-payslip"
        style=" overflow: hidden; padding-top: 30px;">
       <div class="oh-card" style="box-shadow:2px 4px 8px 2px rgba(0,0,0.3,0.2);
       display: flex; justify-content: center;" role="button">
           <div class="oh-card-body"
                style="padding: 5px 5px; float: left; width: 100%;
                 height: auto; box-sizing: border-box; margin: 0;">
               <div class="stat-widget-one">
                   <div class="stat-icon bg-mauve-light d-flex justify-content-left align-items-left">
                       <div style="background:#ff4d94; width:65px; text-align: center;">
                           <i class="fa fa-tasks text-mauve"
                              style="font-size:50px;"/>
                       </div>
                       <div class="stat_content" style="
                         text-align: center; font-weight: bold;
                         padding-top: 20px; padding-left: 80px;">
                           <div class="stat_count_lead"
                                style="font-size: 17px;">
                               <span id="templates">
                                    <div id="my_lead"/>
                               </span>
                           </div>
                           <div class="stat-head"
                                style="font-size: 14px;">My Leads
                           </div>
                       </div>
                   </div>
               </div>
           </div>
       </div>
   </div>
   <!-- Opportunity Tile-->
   <div id="opportunity" class="col-md-4 col-sm-6 tot_tasks oh-payslip"
        style=" overflow: hidden; padding-top: 30px;">
       <div class="oh-card" style="box-shadow:2px 4px 8px 2px rgba(0,0,0.3,0.2);
       display: flex; justify-content: center;" role="button">
           <div class="oh-card-body"
                style="padding: 5px 5px; float: left; width: 100%;
                 height: auto; box-sizing: border-box; margin: 0;">
               <div class="stat-widget-one">
                   <div class="stat-icon bg-mauve-light d-flex justify-content-left align-items-left">
                       <div style="background:yellow; width:65px; text-align: center;">
                           <i class="fa fa-trophy  text-mauve"
                              style="font-size:50px;"/>
                       </div>
                       <div class="stat-content" style="
                         text-align: center; font-weight: bold;
                         padding-top: 20px; padding-left: 80px;">
                           <div class="stat_count_opp"
                                style="font-size: 17px;">
                               <span id="templates">
                                    <div id="my_opportunity"/>
                               </span>
                           </div>
                           <div class="stat-head"
                                style="font-size: 14px;">My Opportunity
                           </div>
                       </div>
                   </div>
               </div>
           </div>
       </div>
   </div>
   <!-- Expected Revenue -->
   <div id="expected_revenue"
        class="col-md-4 col-sm-6 tot_tasks oh-payslip"
        style=" overflow: hidden; padding-top: 30px;">
       <div class="oh-card" style="box-shadow:2px 4px 8px 2px rgba(0,0,0.3,0.2);
       display: flex; justify-content: center;" role="button">
           <div class="oh-card-body"
                style="padding: 5px 5px; float: left; width: 100%;
                 height: auto; box-sizing: border-box; margin: 0;">
               <div class="stat-widget-one">
                   <div class="stat-icon bg-mauve-light d-flex justify-content-left align-items-left">
                       <div style="background:#bf80ff;; width:65px; text-align: center;">
                           <i class="fa fa-usd  text-mauve"
                              style="font-size:50px;"/>
                       </div>
                       <div class="stat-content" style="
                         text-align: center; font-weight: bold;
                         padding-top: 20px; padding-left: 80px;">
                           <div class="stat_count_ex_rev"
                                style="font-size: 17px;">
                               <span id="templates">
                                    <div id="revenue"/>
                               </span>
                           </div>
                           <div class="stat-head"
                                style="font-size: 14px;">Expected
                               revenue
                           </div>
                       </div>
                   </div>
               </div>
           </div>
       </div>
   </div>
</div>
Fetching Data using JavaScript ORM Call:
/** @odoo-module **/
import { registry } from "@web/core/registry";
import { useService } from "@web/core/utils/hooks";
import { Component } from  "@odoo/owl";
const actionRegistry = registry.category("actions");
class CrmDashboard extends Component {
  setup() {
        super.setup();
        this.orm = useService('orm');
        this._fetch_data();
  }
  async _fetch_data(){
     let result = await this.orm.call("crm.lead", "get_tiles_data", [], {});
     document.getElementById('my_lead').innerHTML = `<span>${result.total_leads}</span>`;
     document.getElementById('my_opportunity').innerHTML = `<span>${result.total_opportunity}</span>`;
     document.getElementById('revenue').innerHTML = `<span>${result.currency}${result.expected_revenue}</span>`;
  }
}
CrmDashboard.template = "my_module.CrmDashboard";
actionRegistry.add("crm_dashboard_tag", CrmDashboard);
Fetching Data from the Model (crm.lead):
from odoo import models, api

class CrmLead(models.Model):
   _inherit = 'crm.lead'
   @api.model
   def get_tiles_data(self):
       company_id = self.env.company
       leads = self.search([('company_id', '=', company_id.id),
                            ('user_id', '=', self.env.user.id)])
       my_leads = leads.filtered(lambda r: r.type == 'lead')
       my_opportunity = leads.filtered(lambda r: r.type == 'opportunity')
       currency = company_id.currency_id.symbol
       expected_revenue = sum(my_opportunity.mapped('expected_revenue'))
       return {
           'total_leads': len(my_leads),
           'total_opportunity': len(my_opportunity),
           'expected_revenue': expected_revenue,
           'currency': currency,
       }
As you can see, the get_tiles_data() function retrieves data from the crm.lead model, fetching the total number of leads, opportunities, and expected revenue for the logged-in user within their company.
The final dashboard output will display tiles summarizing key CRM metrics, including the total number of leads, opportunities, and expected revenue.
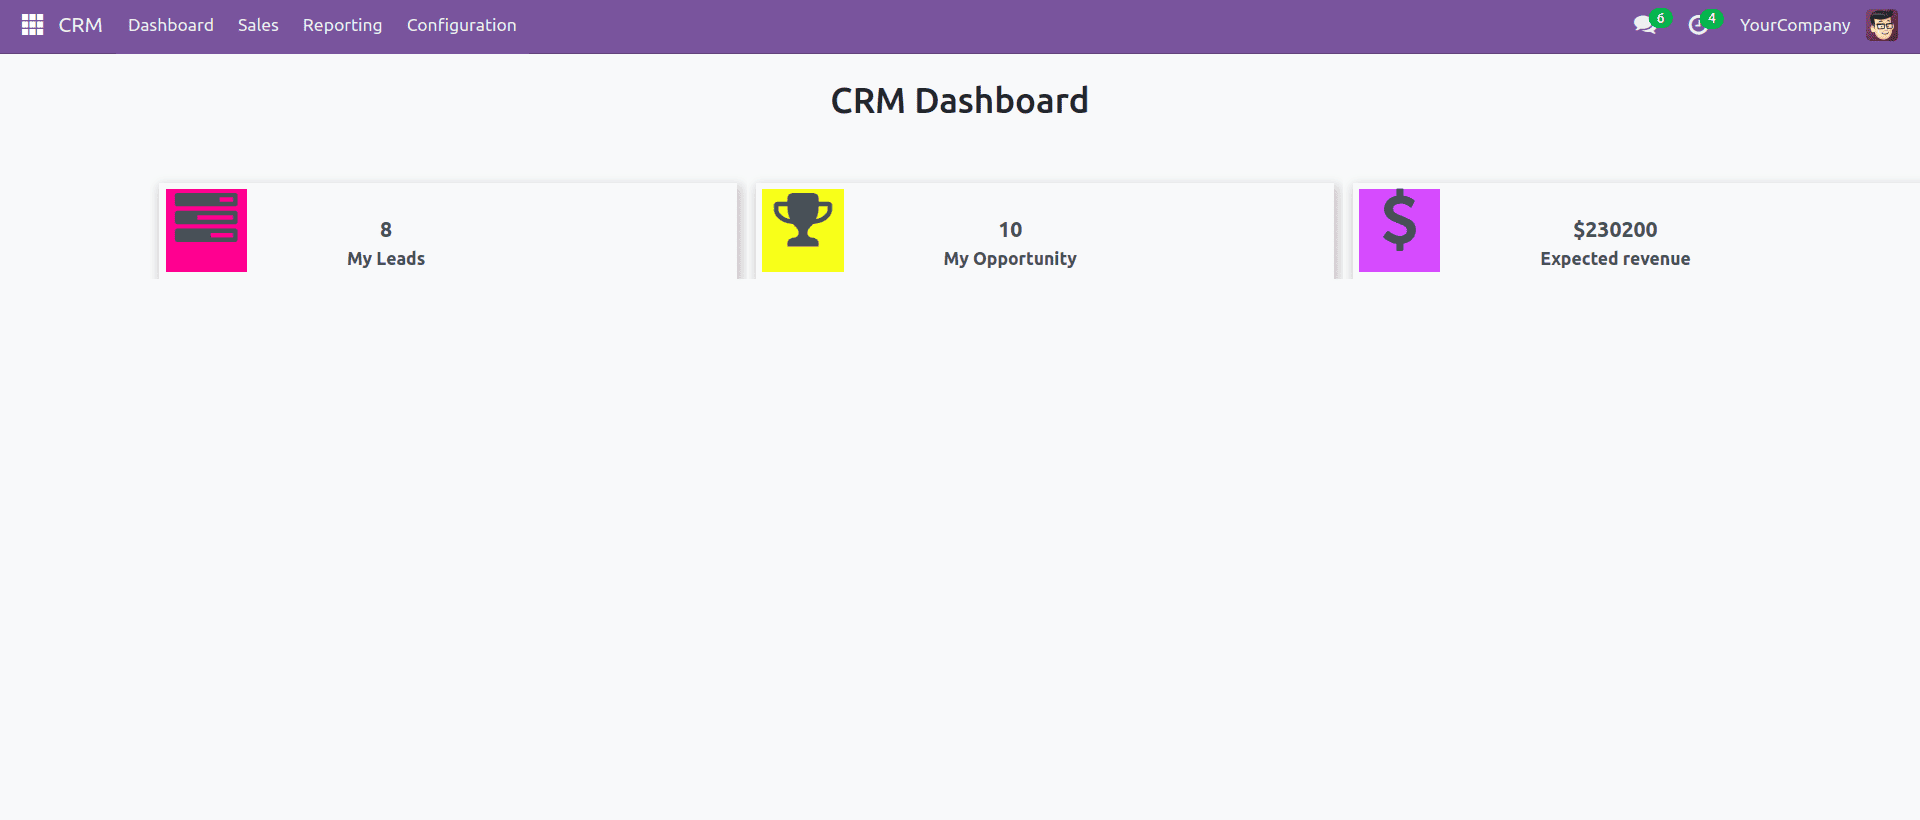
This is a simple dashboard that provides key CRM insights using dynamic tiles. You can further enhance it with additional graphical elements, charts, or other customizations based on your specific needs.
To read more about how to create a Dashboard in Odoo 17, refer to our blog, How to Create a Dashboard in Odoo 17.