Pandas is a popular open-source Python library used extensively in data manipulation, analysis, and cleaning. It provides powerful tools and data structures, particularly the DataFrame, which enables users to work with structured data effortlessly.
If you're new to Pandas and want to get a grasp of its basics, check out our blog on Pandas . In this blog, I'll be delving into the world of data cleaning using Pandas.
When we talk about data cleaning with Pandas, we're essentially talking about tidying up messy data. Data cleaning in Pandas involves getting rid of mistakes, like missing bits of information or repeating the same thing too many times. Bad data like empty cells, data in wrong format, wrong data, duplicates in your data set is to be corrected by data cleaning.
import pandas as pd
import numpy as np
data = {
       'Duration': [120, 120, 120, 120, 120, 120, 60, 45, 30,45, 60, 60,60, 450, 60, 45, 60, 60, 45, 120, 45],
'Date': ["'2023/01/01'", "'2023/01/02'", np.nan , "'2023/01/04'", "'2023/01/05'", "'2023/01/06'", "'2023/01/07'", "'2023/01/08'", "'2023/01/09'", "'2023/01/10'", "'2023/01/11'", "'2023/01/12'", "'2023/01/12'", "'2023/01/13'", "'2023/01/14'", "'2023/01/15'", "'2023/01/16'", np.nan, "'2023/01/18'", '2023/01/19', "'2023/01/20'"],
        'Pulse': [90, 127, 95, 159, 117, 102, 110, 104, 109, 98, 103, 100, 100, 106, 104, 98, 98, 100, 90, 103, 97],
        'Maxpulse': [130, 145, 135, np.nan, 148, np.nan, 136, 134, 133, 124, 147, 120, 120, 128, 132, 123, 120, 120, 112, 123, 125],
        'Calories': [282.1, 250.0, 300.0, 282.4, np.nan, 300.0, 374.0, np.nan, 195.1, 269.0, 329.3, 250.7, 250.7, 345.3, 379.3, 329.0, 215.2, 300.0, np.nan, 323.0, 243.0]
        }
# Create a DataFrame
df = pd.DataFrame(data)
Output :
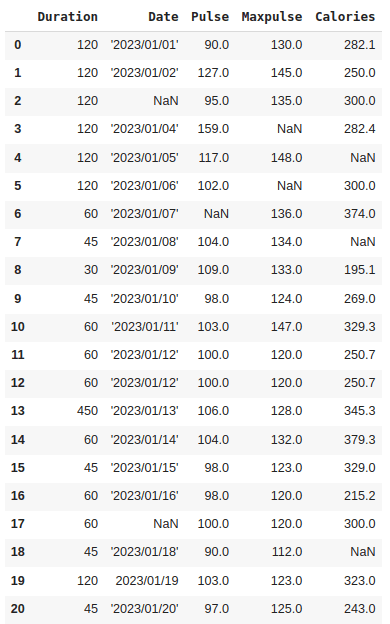
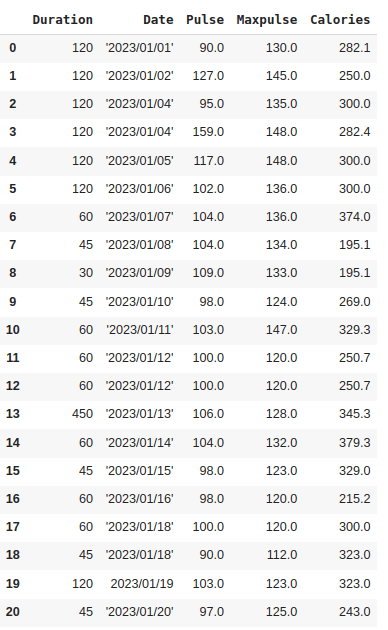
In this blog, we'll use this dataset to show you how data cleaning works. It will help us demonstrate the process and techniques involved in cleaning up and preparing data for analysis.
The data set contains some empty cells ("Date" in row 2 and 17, ‘Pulse’ in row 6, “Maxpulse” in 3 and 5 and "Calories" in row 4,7 and 18), wrong format ("Date" in row 19), wrong data ("Duration" in row 13) and duplicates (row 11 and 12). Now, let's explore how to address these issues within the dataset.
Handling Missing Values
In Pandas, handling missing data or cleaning empty cells is an essential part of data preprocessing. Pandas represents missing data as NaN (Not a Number) or None. To identify missing values, you can use the isna() or isnull() method.
1. Dropping Missing Values
Dropping rows that include empty cells is one method of handling empty cells.
missing_values = df.isnull() # or df.isna()
Output:
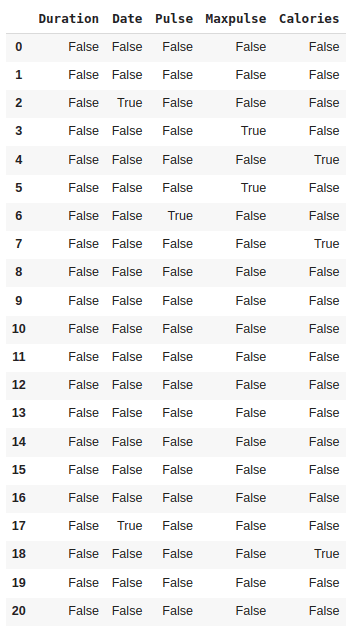
This output displays True in the cells where the original DataFrame df had null values and False where the values were not null.
To remove rows or columns with missing values, you can use the dropna() method.
new_df = df.dropna()
Output:
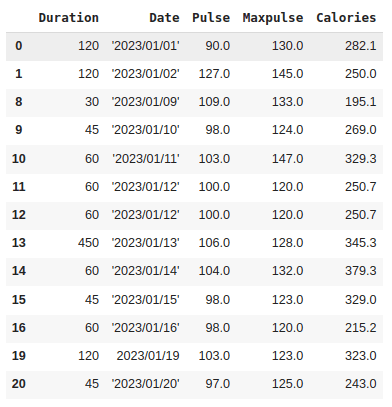
In this case, rows 2, 3, 4, 5, 6,7, 17 and 18 with empty values are removed.
2. Filling Missing Values
You can fill missing values with a specific value using fillna().
df_filled = df.fillna(value=0) # Replace NaN with 0
Output:
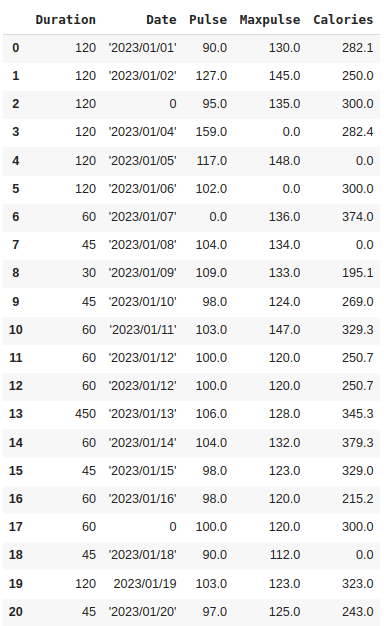
Here, all the empty values are replaced with 0.
3. Imputation
Imputation involves replacing missing values with a calculated statistic (e.g., mean, median, mode) from the data.
Mean:
# Replace missing values with mean
mean_value = df['Pulse'].mean()
df['Pulse'].fillna(mean_value, inplace=True)
Output:
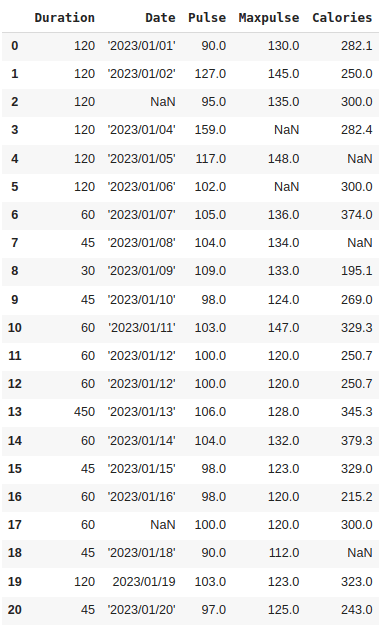
Here, the empty value in ‘pulse’ (row 6) is filled with the mean value.
Median:
x = df["Pulse"].median()
df["Pulse"].fillna(x, inplace = True)
Output:
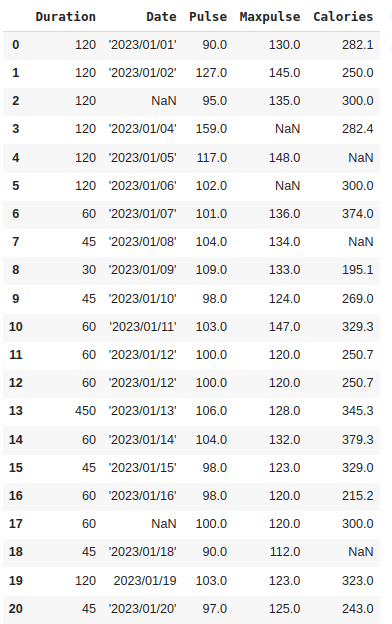
Mode:
x = df["Pulse"].mode()[0]
df["Pulse"].fillna(x, inplace = True)
Output:
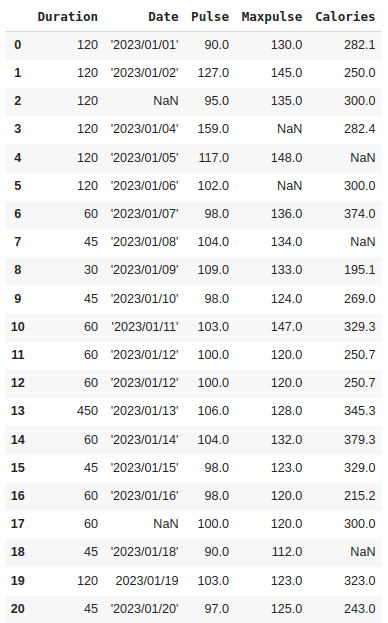
4. Forward Fill:
ffill() (forward fill) method can be used to fill missing values using the previous values.
df_ffill = df.ffill()
Output:
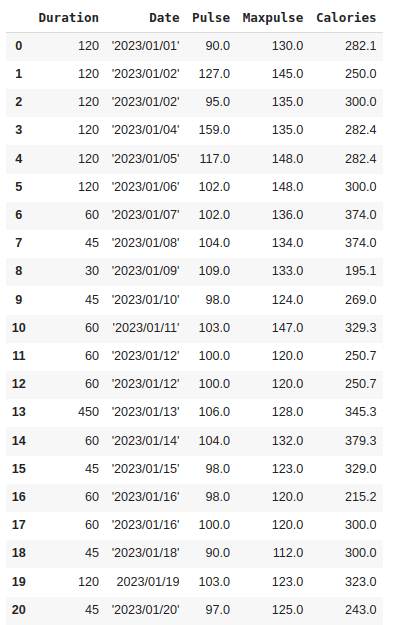
6. Backward Fill:
bfill() (backward fill) method can be used to fill missing values using the following values.
Output:
Cleaning Wrong Data Formats:
Incorrect data formats, such as mismatched data types, missing values, or inconsistent representations, can hinder analysis and produce inaccurate results. So we can either remove the row that contains data with wrong formats or we can convert it to the correct format.
In our data set, we have a wrong value in the ‘Date’ column in row 19.
The 'Date' column has a mixed format (some are strings wrapped with quotes, and some are not), which needs to be unified into a consistent format. To correct the wrong format, you can use the pd.to_datetime() function.
df['Date'] = pd.to_datetime(df['Date'])
Output:
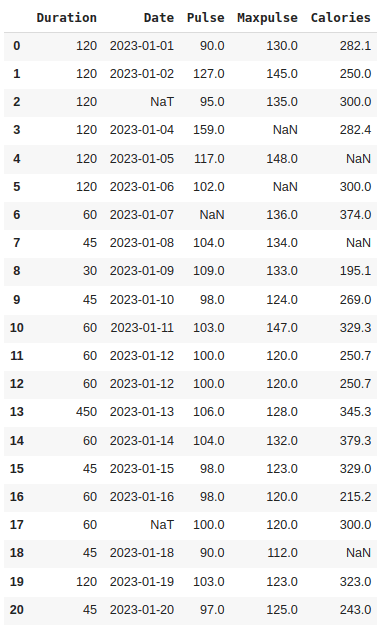
The pd.to_datetime() function converts the 'Date' column to datetime format, handling any errors or mixed formats by coercing them to NaT (Not a Time) values. This results in a consistent datetime format for the 'Date' column in the DataFrame. We can see ‘NaT’ in row 2 and 17, ie. empty value. To deal with empty values, you can just delete the entire row.
df.dropna(subset=['Date'], inplace = True)
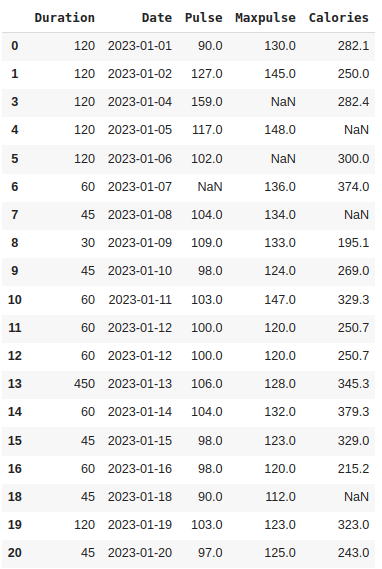
Row 17 is removed.
Eliminating Duplicates
Duplicate rows in a dataset refer to rows that contain the exact same values across all columns. In our dataset, we have duplicate rows, ie. row 11 and 12. To check whether our dataset contains duplicate rows, we can use the duplicated() function. It will return True for every row that is a duplicate, otherwise False.
df.duplicated()
Output:

To remove duplicates, we can use the drop_duplicates() function.
df.drop_duplicates(inplace = True)
Output:
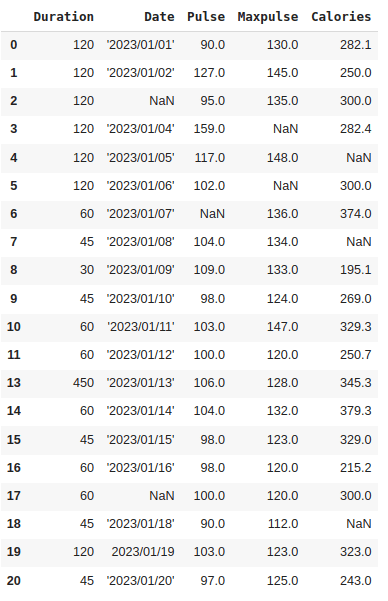
Here, one among the duplicate rows, that is, row 12 is removed.
Handling Wrong Data:
Wrong data isn't just empty cells or incorrect formatting; it can simply be inaccurate, like if someone input "299" instead of "2.99".
Upon examining our dataset, you'll notice that in row 13, the duration is 450, whereas for all the other rows, the duration ranges between 30 and 60. While it's not necessarily incorrect, considering this dataset represents someone's workout sessions, it's reasonable to deduce that this individual didn't exercise for 450 minutes.
A method to rectify inaccurate values is by replacing them with alternative correct values. In our case, the erroneous entry is likely a typographical error, and the intended value should be "45" instead of "450". Consequently, we could easily replace the value in row 13 with "45".
df.loc[13, 'Duration'] = 45
Output:
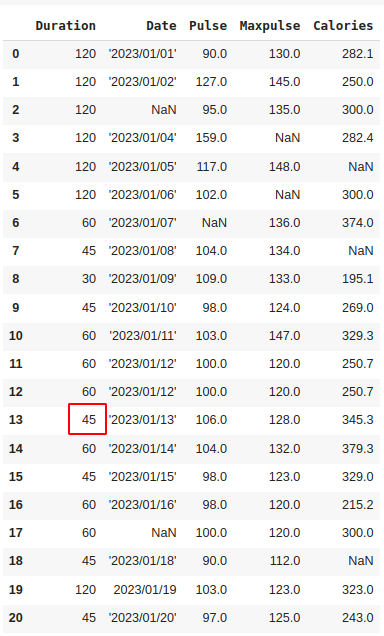
The value of ‘Duration’ in row 13 is replaced with 45. So this is easily possible as ours is a small dataset. But if it is a large dataset, this way is not possible. In that case, we can create rules by setting some boundaries for values in each column.
for x in df.index:
  if df.loc[x, "Duration"] > 120:
    df.loc[x, "Duration"] = 120
It checks each value in the "Duration" column. If the value is greater than 120, the code updates that value to be 120.
Output:
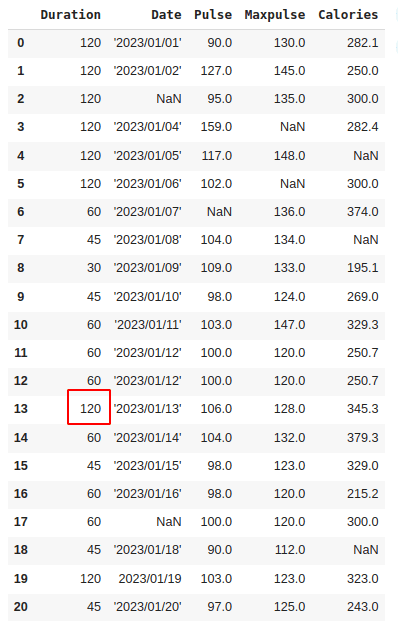
If you want the row to be removed by setting a rule:
for x in df.index:
  if df.loc[x, "Duration"] > 120:
    df.drop(x, inplace = True)
Output:
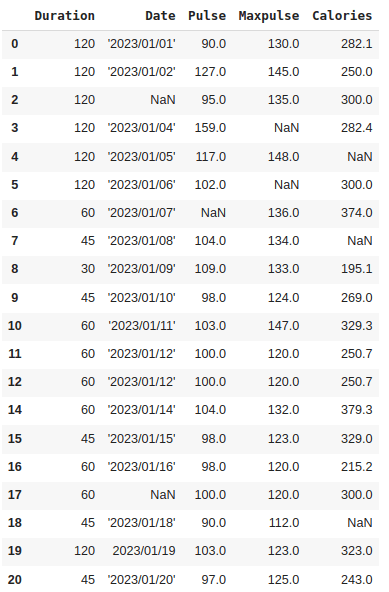
Here, row 13 is removed.
Throughout this blog, we've delved into various techniques and methods that Pandas offers to effectively clean and preprocess datasets.
By leveraging Pandas' robust functionalities, we've addressed common data issues such as missing values, incorrect formats, wrong data entries, and duplicates. Understanding how to handle these discrepancies ensures the data is accurate, consistent, and ready for meaningful analysis or model building. If you would like to read more about Pandas and Pandas in python refer to our previous blog.