An extensive account of a company's procurement activity during a certain time period, a purchase report offers a thorough summary of purchases, their origin, and their timing. Through the analysis of expenditure trends, budget optimization, and supplier negotiations, it supports strategic decision-making. It also provides information on the performance of vendors, assisting companies in identifying trustworthy suppliers and those who fall short of expectations. By finding obstacles and inefficiencies in the purchasing process, purchase reports also improve productivity and operational efficiency. Businesses should commit to regular updates to ensure data is current and correct if they want to benefit from purchase reports fully. Insights on a company's purchasing patterns, vendor performance, and any procurement bottlenecks may be obtained through a comprehensive study.
A dynamic report management section of the Odoo 17 Purchase Management module enables users to create graphical and analytical reports on each buying process. With the help of this tool, users may easily analyze data and come to better business decisions. To facilitate effective analysis and decision-making, the platform offers a dedicated “Reporting” menu with a “Purchase Analysis” window, as shown below.
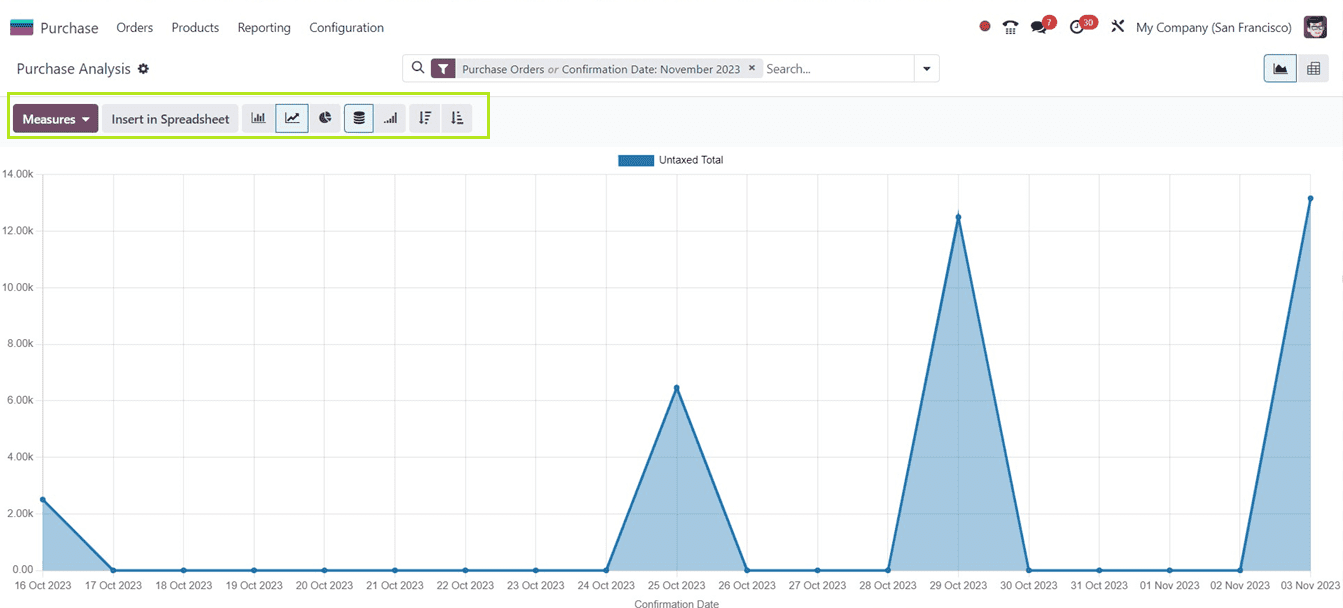
The Line graph shows the purchases' untaxed totals according to the dates of confirmation. You can see the Confirmation dates on the X-axis and the Untaxed Amount on the Y-axis.
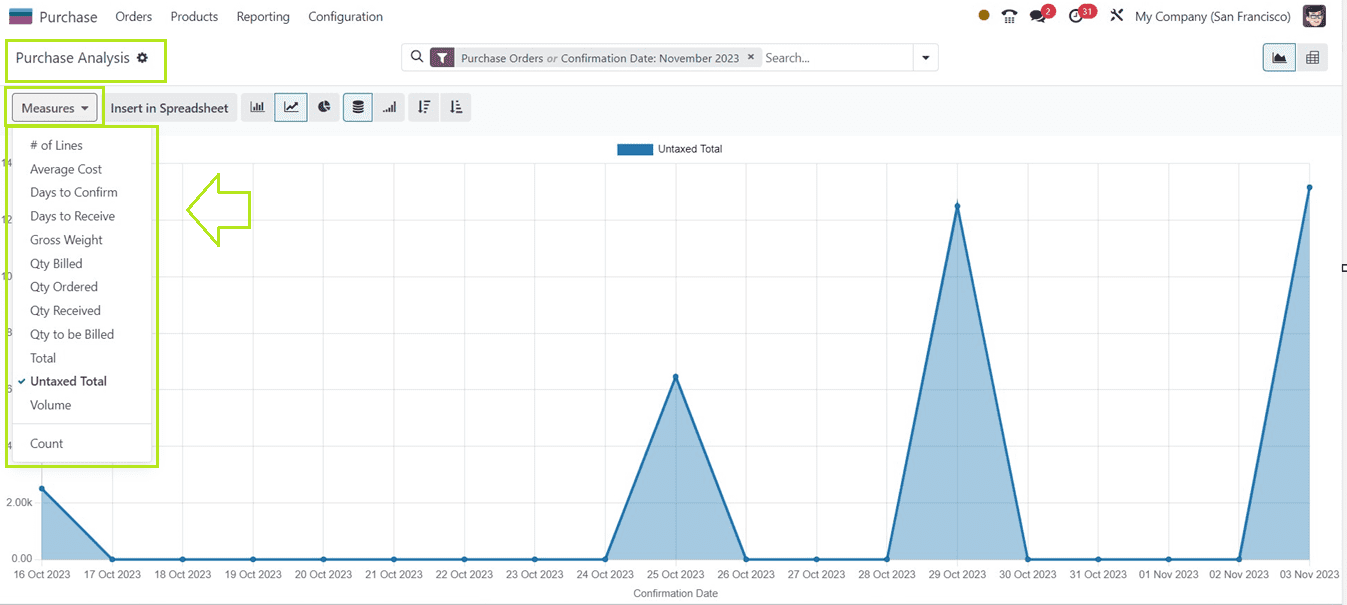
Measures
The “Measures” button will give you various reporting parameters to customize the reporting parameters according to your company’s perspectives, including “Average Cost,” ”Days to Confirm,” “Days to Receive,” ‘Gross Weight,” “Quantity Billed,’ “Quantity Ordered,’ ‘Quantity Received,” “Total,’ “Untaxed Total,” “Volume,” “Count” etc.
Advanced Search Bar and Filter Options
Odoo has included an advanced search bar in its user interface, providing a comprehensive filter and sorting parameter in a compact area like a webpage mega menu. Clicking on the search bar will open a window display containing some “Filters,” “Group By” options, “Comparison,” and “Favorites” options as illustrated below.
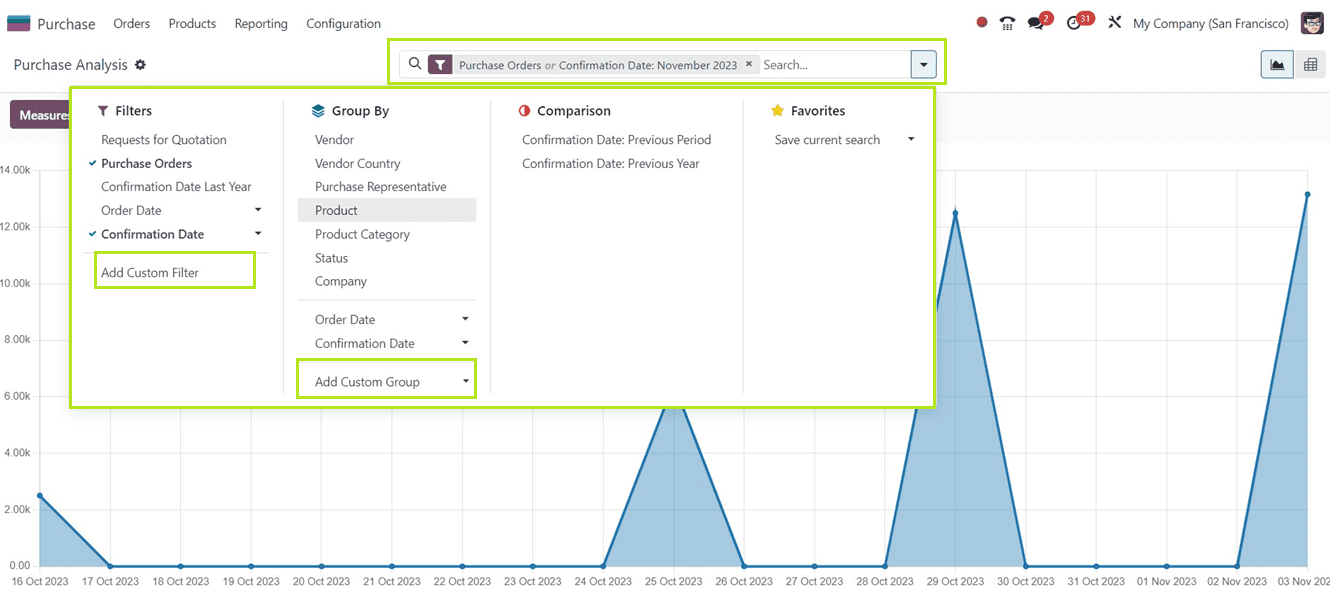
The purchase reporting platform's users can filter results based on a number of criteria, such as Request for Quotation, Purchase Orders, Confirmation Date Last Year, Order Date, and Confirmation Date. With the “Add Custom Filter” section, you can create customized filters according to your requirements.
Inside the “Group By” section, users may create unique grouping choices. The reports can be sorted by the following criteria: company, product category, status, order date, confirmation date, vendor, vendor country, purchase representative, and and so on. Additionally, you can create customized groups using the “Add Custom Group” button.
You can compare the current report with “Previous Period” and “Previous Years” by utilizing the “Comparison” option that appears when you use the filter Confirmation Date. Also, you can mark important data in the “Favorites” section.
Depending on your convenience, you can change the graphic reports to Bar Charts, Line Charts, Stacked, Cumulative, and Pie Charts. The Line and Bar charts can be arranged either descendingly or descendingly. The screenshot below will show the pie chart view of the report data.
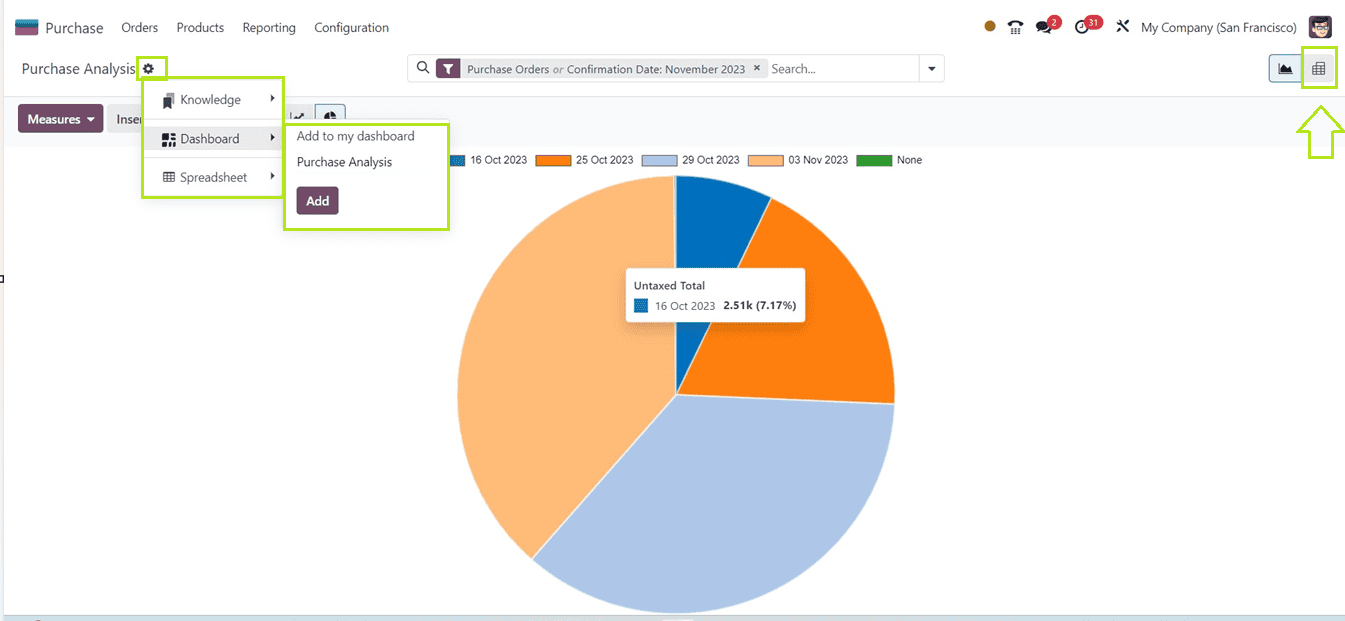
Using the ”Knowledge” button provided inside the “Action” menu at the top of the window, you can create insightful articles, notes, or any documents using the report view with the help of the Odoo Knowledge Module interface. Additionally, you can also make dashboards and spreadsheets using the report data with the “Dashboard” and “Spreadsheet” buttons respectively.
Pivot View
Clicking on the “Pivot” icon will display the pivot view of the purchase report, as shown below.

Changes to the crucial report parameters stated in the above section can be made using the "Measures" button. The "Insert In Spreadsheet" option facilitates the incorporation of report data into a spreadsheet, you may turn the report into a spreadsheet and alter the purchase reports to suit your needs and conduct a clear analysis of them. You can flip the pivotal axis, Expand the view, and Download the Excel file of the report using the “Filip axis,” “Expand All,” and “Download xlsx” buttons, respectively.
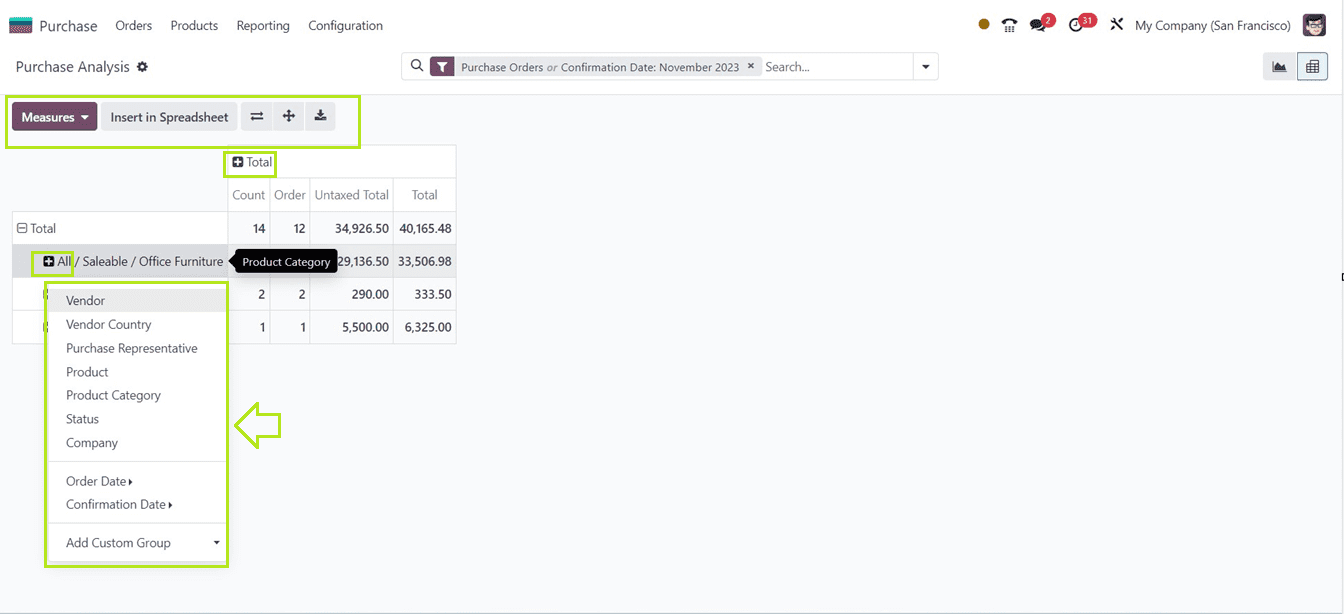
Expanding the table with more data is made easier by using the plus icon provided on the pivotal columns. I have expanded the pivotal columns for a clear view of the purchase analysis as shown below.
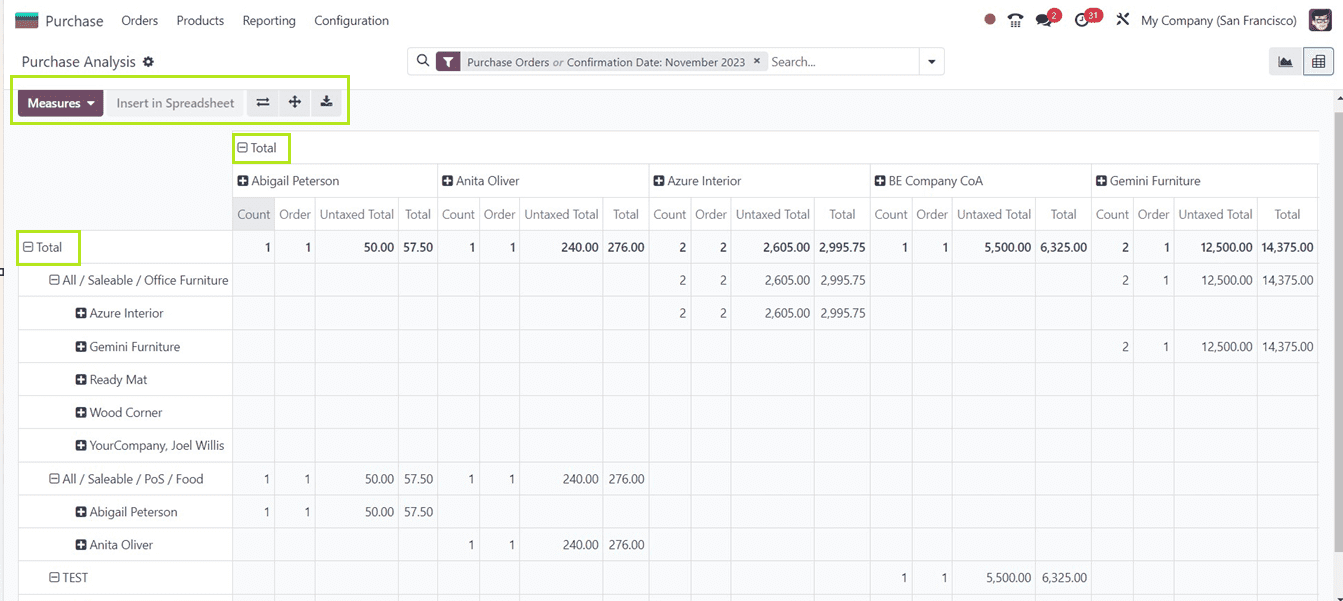
These are the functionalities included in the Purchase Reporting window of the Odoo 17 Purchase Module. This report analysis helps customers make better conclusions, develop business approaches to increase business growth, and efficiently assess their company's purchasing data.
To read more about the overview of Odoo 17 sales reports, refer to our blog An Overview of Odoo 17 Sales Reports