One useful method for finding performance problems and improving your application is code profiling in Odoo. It entails examining several facets of code execution, such as memory usage, program complexity, and execution time.
Profiling assists in identifying code bottlenecks and identifying locations where performance is being adversely affected. You may improve your Odoo application's speed and efficiency and, eventually, the user experience by using profiling techniques.
Let's examine the efficient use of code profiling in Odoo.
Typical methods for profiling include:
* Graphing techniques
* Methods of logging
* Monitoring the execution of code
The "Enable Profiler" option in Odoo 17 allows you to enable profiling. Profiling can be turned on directly through code or through the User Interface.
Both the user interface and code can be used to activate the profiler.
Turn it on from the user interface.
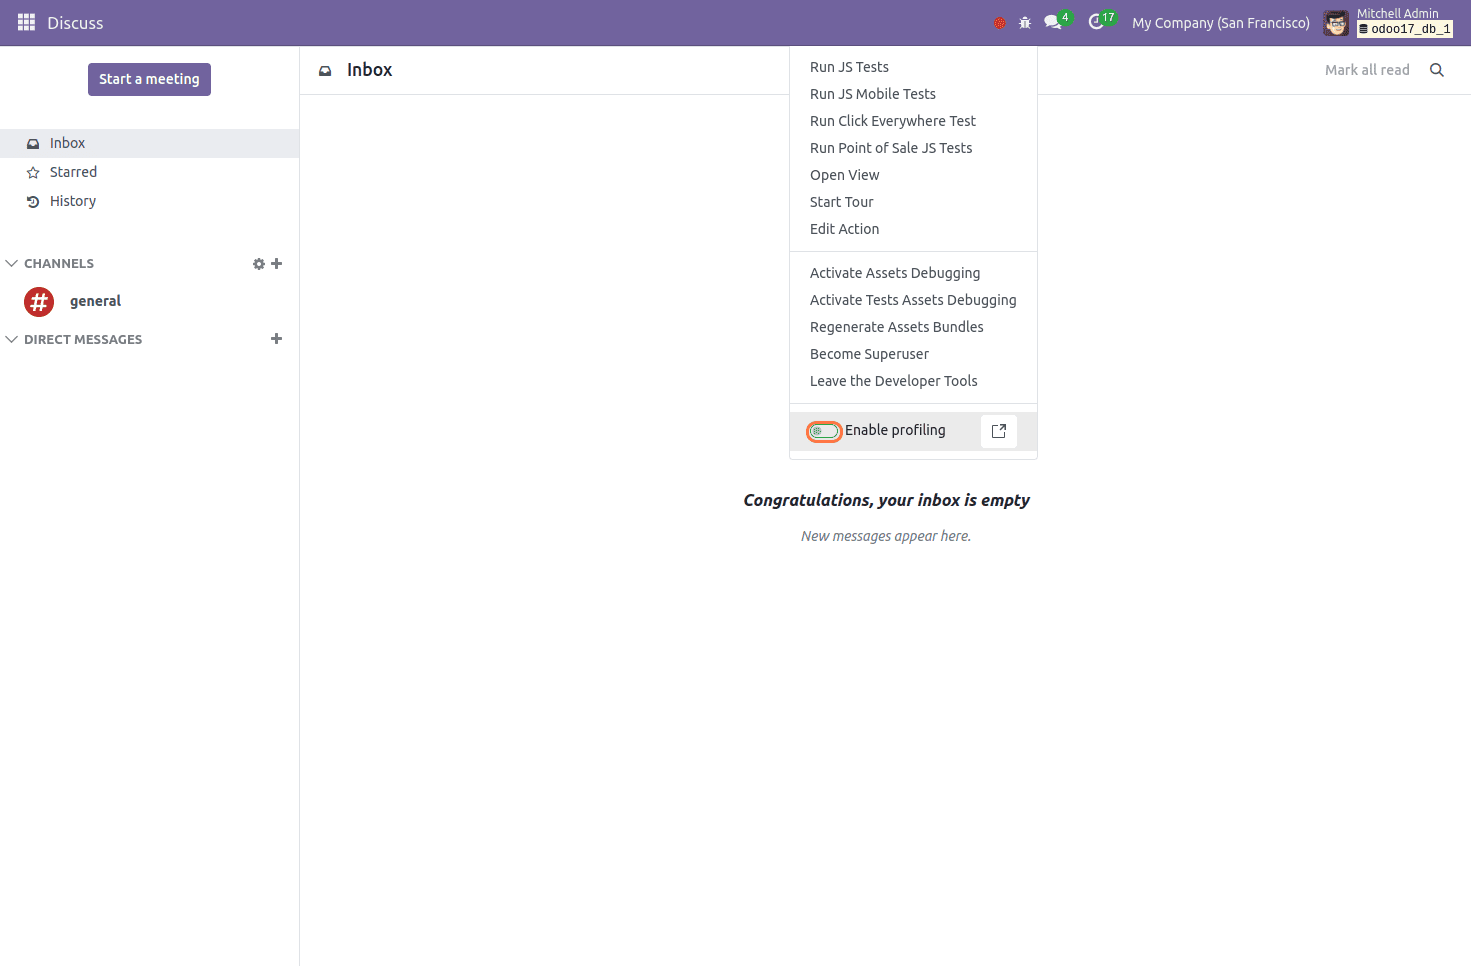
1. Developer mode must be enabled.
2. From the debug icon in the Systray, activate the profiling mode.
This button provides the functionality to adjust the start and end times of the profiling process. When clicked, it triggers the appearance of a wizard, allowing users to modify the time settings as needed, ensuring greater flexibility and accuracy in managing profiling durations.
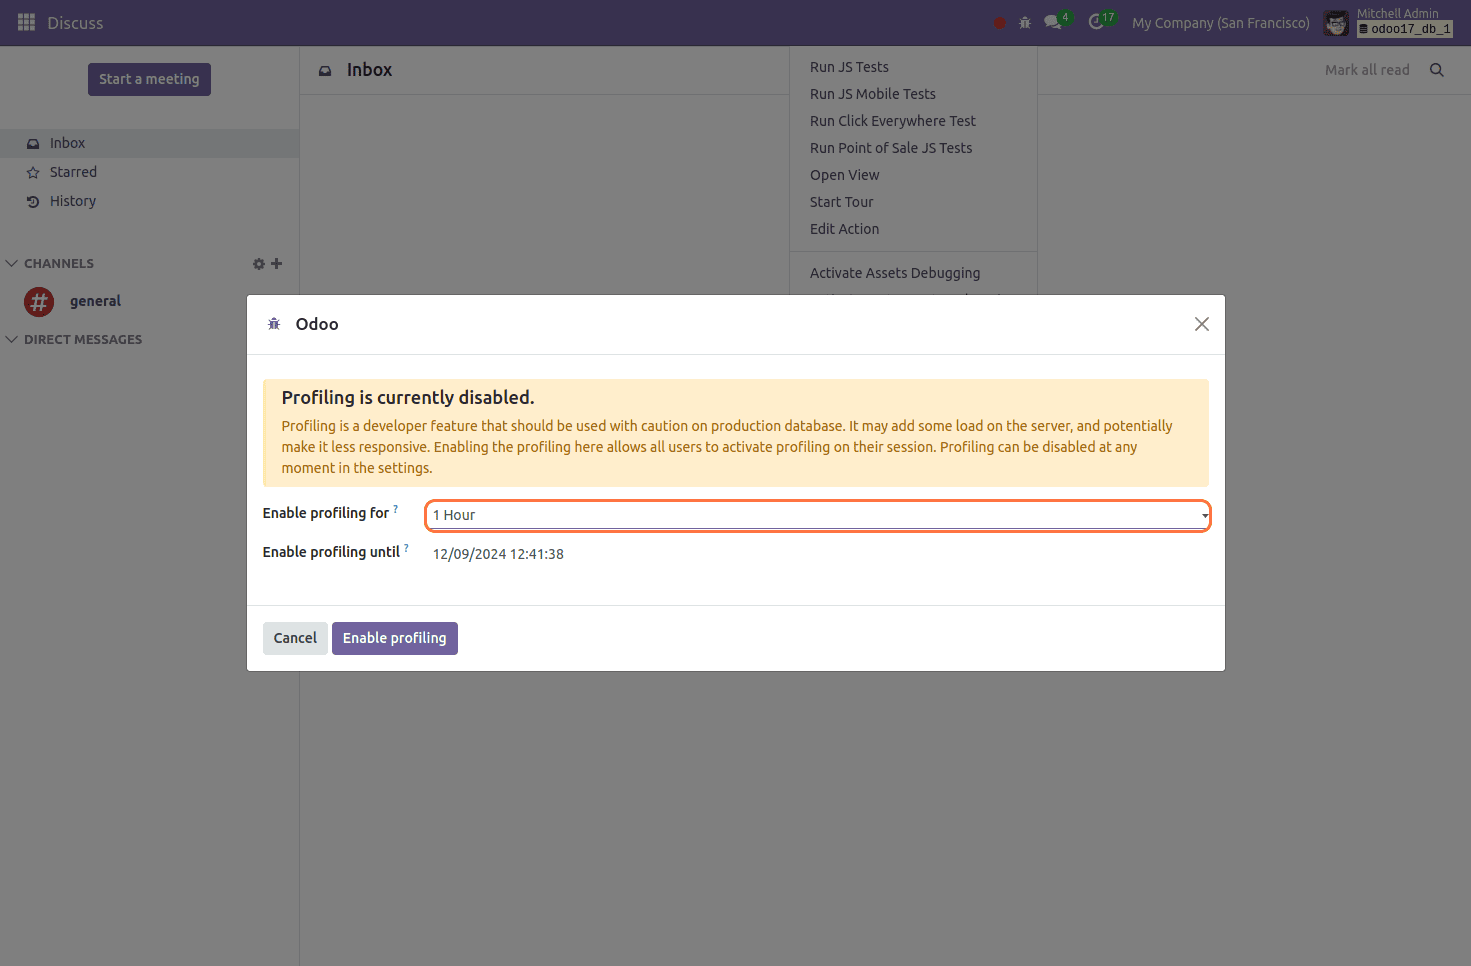
This enhancement simplifies the process of database profiling, making it more efficient and user-friendly. Users can enable the profiler at any point during their session, allowing them to monitor and analyze database performance seamlessly. This ensures better tracking of queries and system activities, leading to improved optimization and troubleshooting.
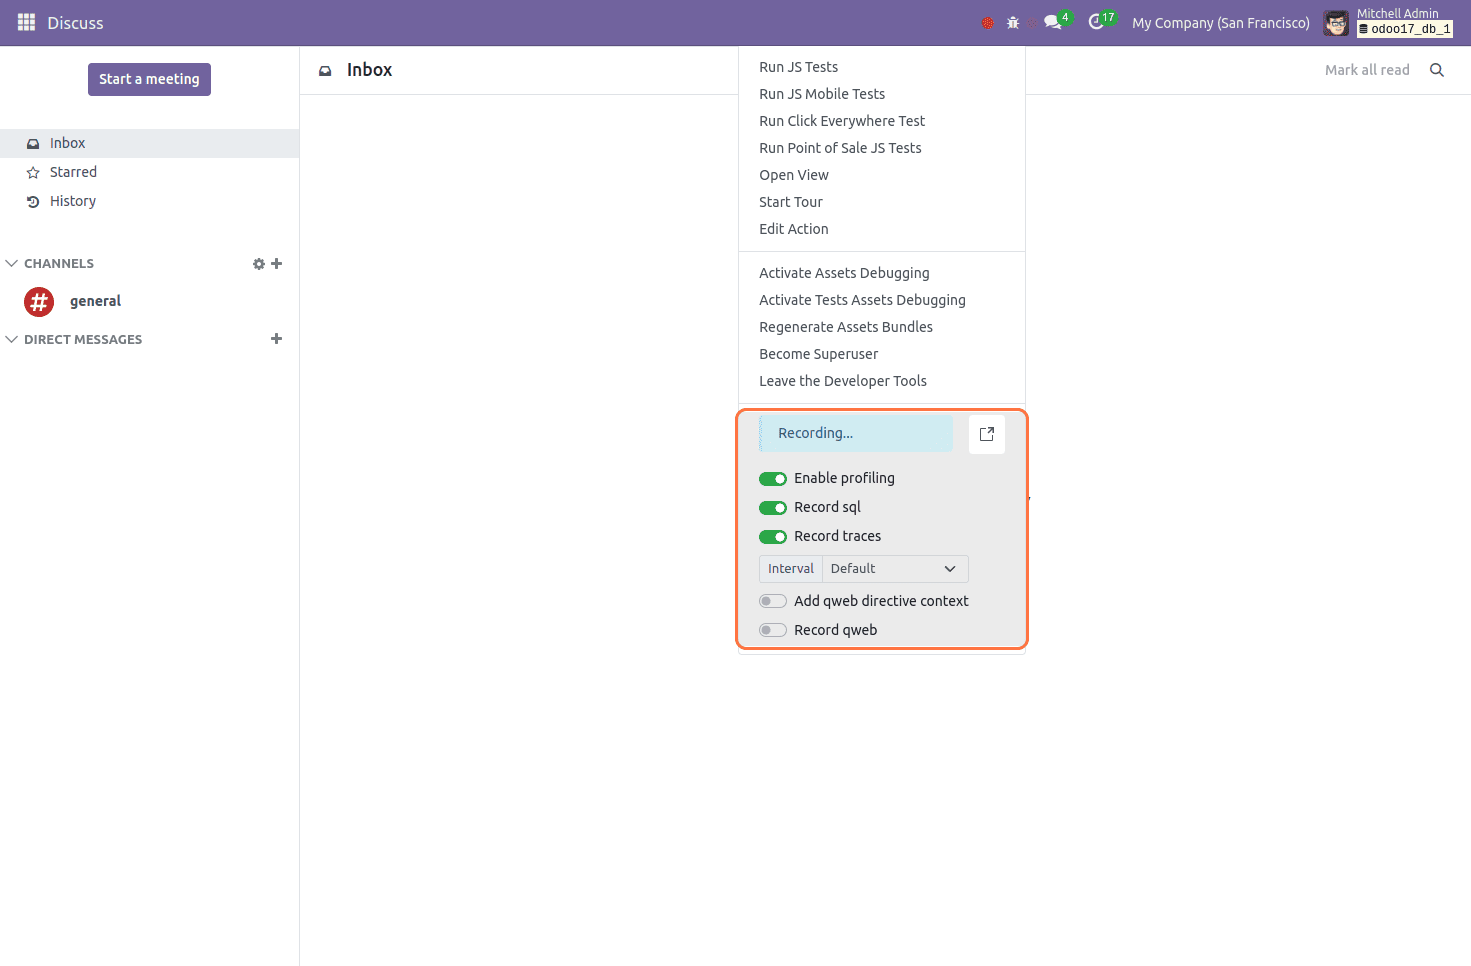
Following activation, the profiler keeps track of and logs comprehensive details about every request sent to the server, which are then saved as "ir.profile" entries. The active profiling session, which starts when the profiler is enabled and lasts until it is turned off, is where these recordings are grouped together.
Examining Profiler Outcomes
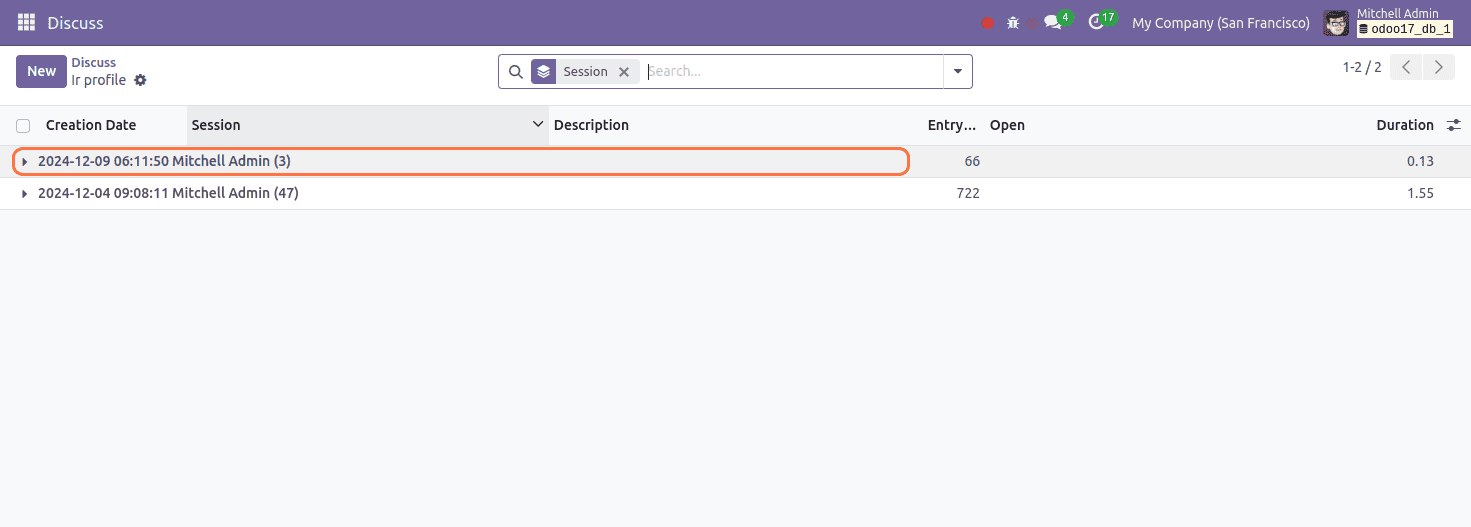
To view the profiling results, open the external link for "ir.profiler," and then enter the debug mode. This will show the profiling data, which includes the session, creation date, number of entries, and duration, in the list view of the "ir.profile" model.
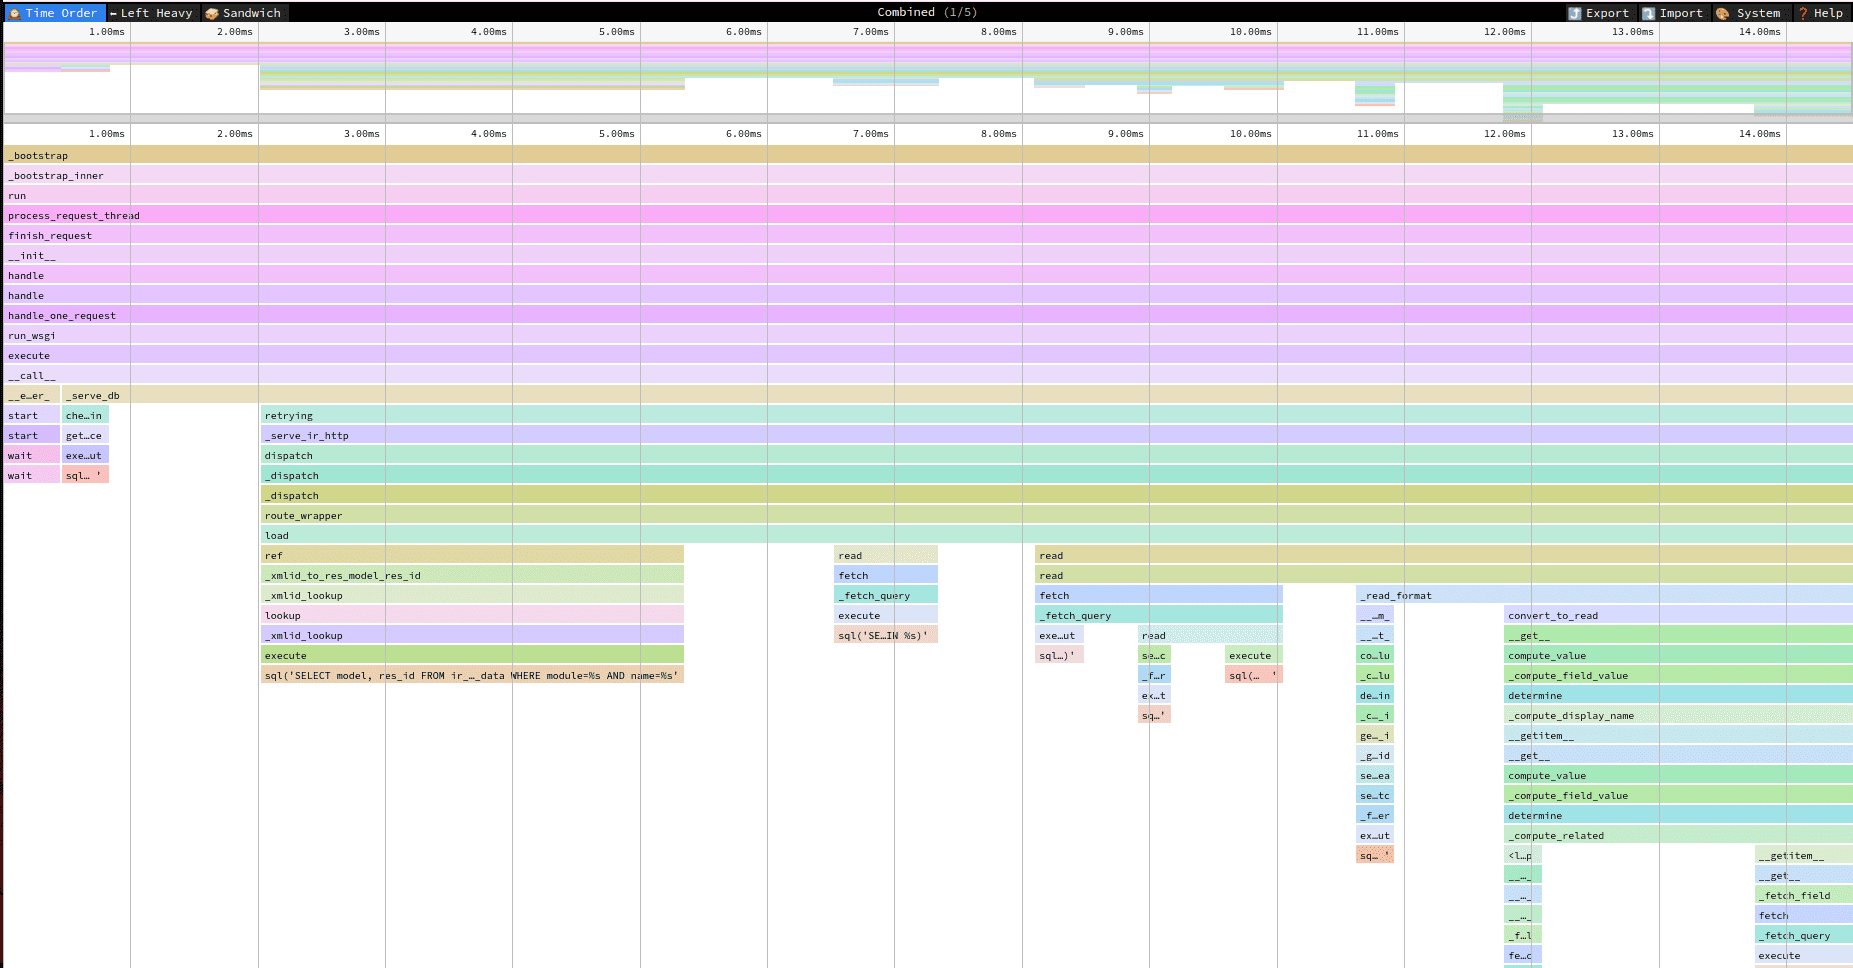
As part of the profiling data, we can also produce a Speedscope report.
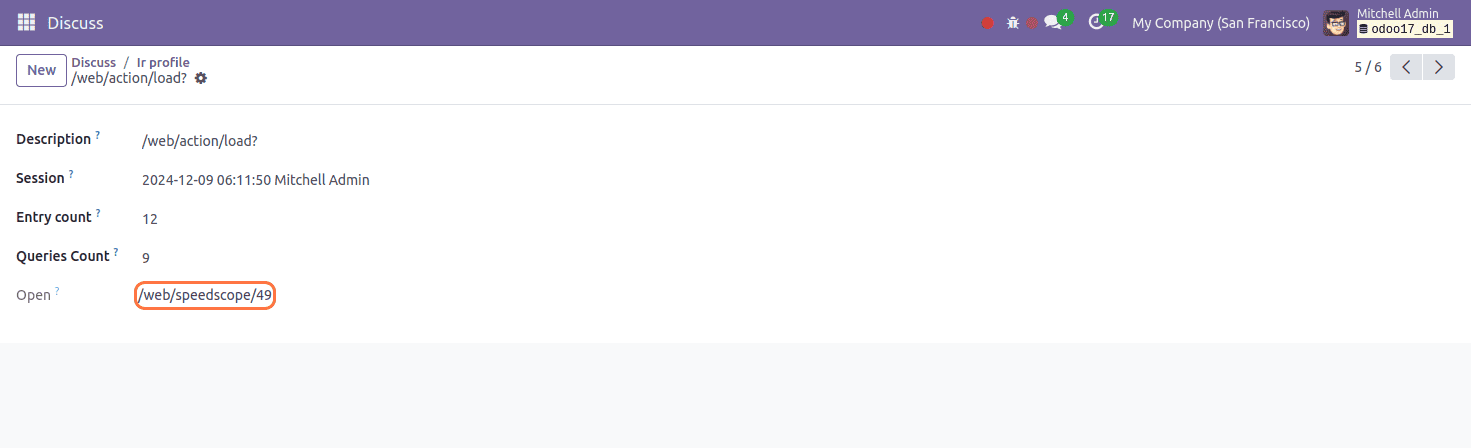
Speedscope outputs generated by the profiler provide a comprehensive and visually intuitive representation of profiling data. These insights enable you to analyze the performance of your code, understand its execution flow, and pinpoint potential bottlenecks. By leveraging this detailed visualization, you can efficiently identify areas for optimization, improve code efficiency, and enhance overall system performance.
Apart from profiling, other approaches like method graphing, tracking code execution, and logging methods can also be used to evaluate code performance.
To read more about An Overview of Code Profiling in Odoo 16, refer to our blog An Overview of Code Profiling in Odoo 16.