In Odoo 18, the Sales module's Reports tab provides an efficient way to assess your organization's sales performance. This feature enables businesses to analyze sales data over specific time periods, such as daily, weekly, monthly, or annually, offering insights that can help drive productivity and overall sales success. By accessing the Reporting tab, users can open the Sales Analysis window, which presents sales metrics that can guide strategic decision-making to promote business growth.
Sales Analysis
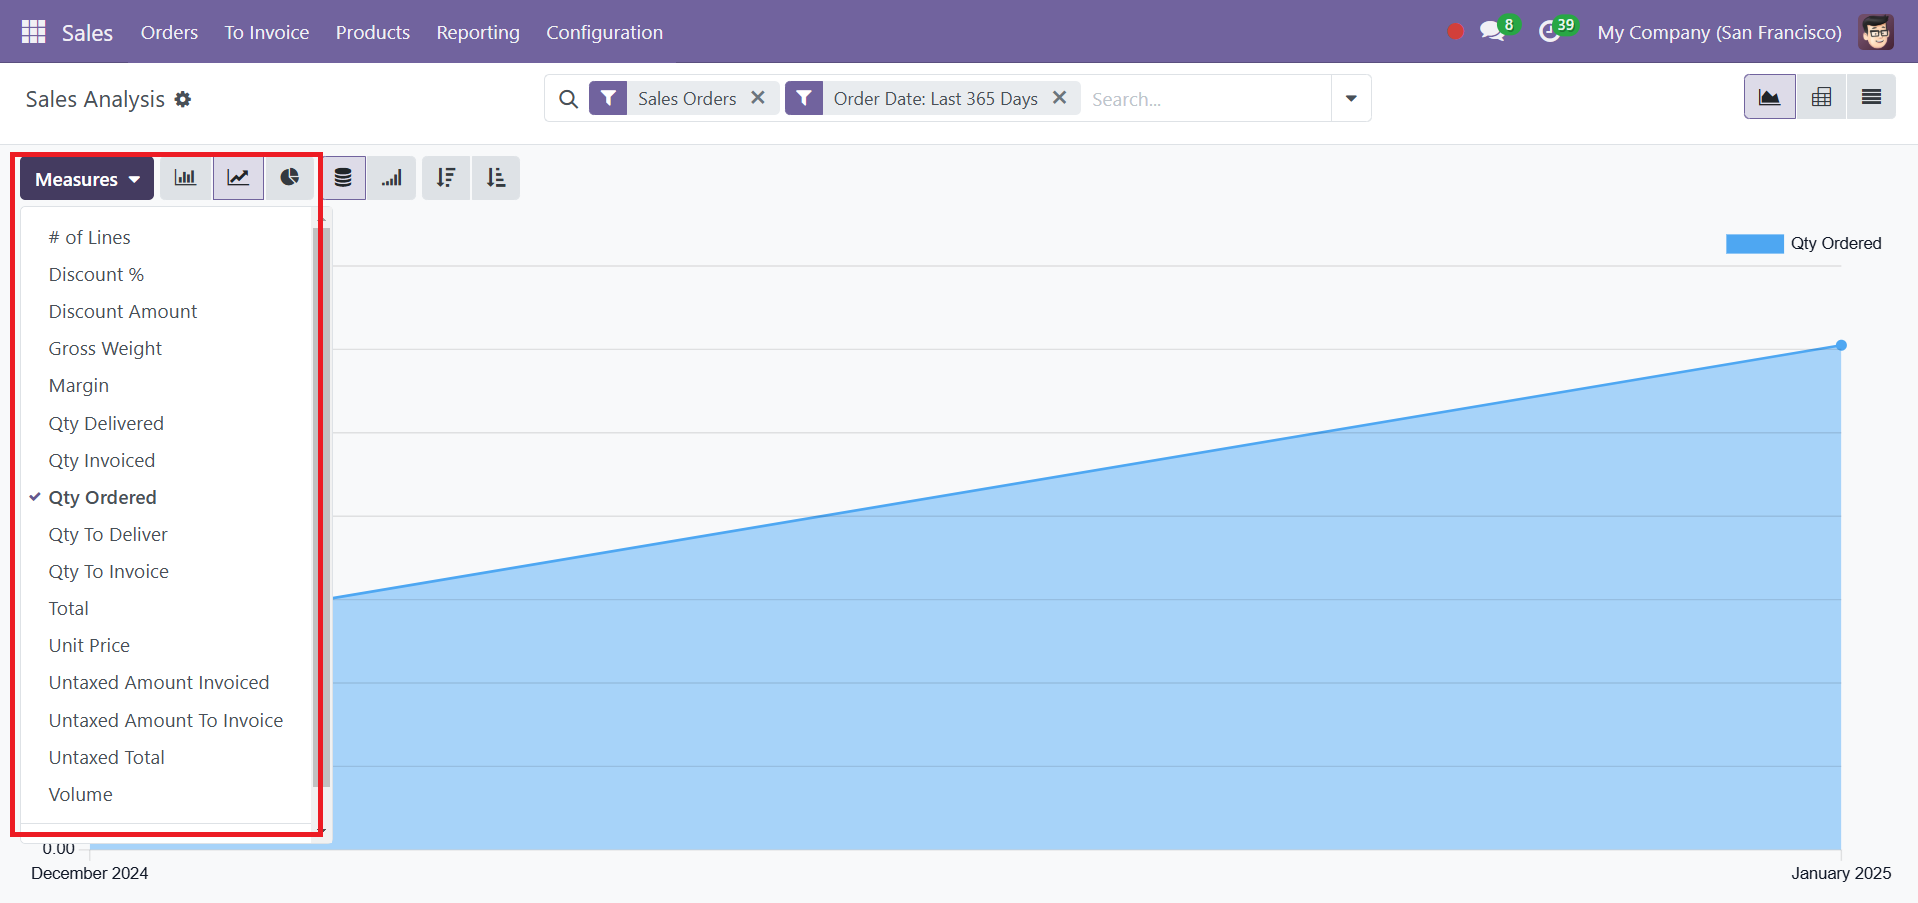
Within the Sales Analysis view, you can utilize the Measures option to select specific categories of data from a dropdown list for analysis.
The view can also be customized using the icons at the top right corner of the window. For example, you can toggle between Graph and Pivot views.
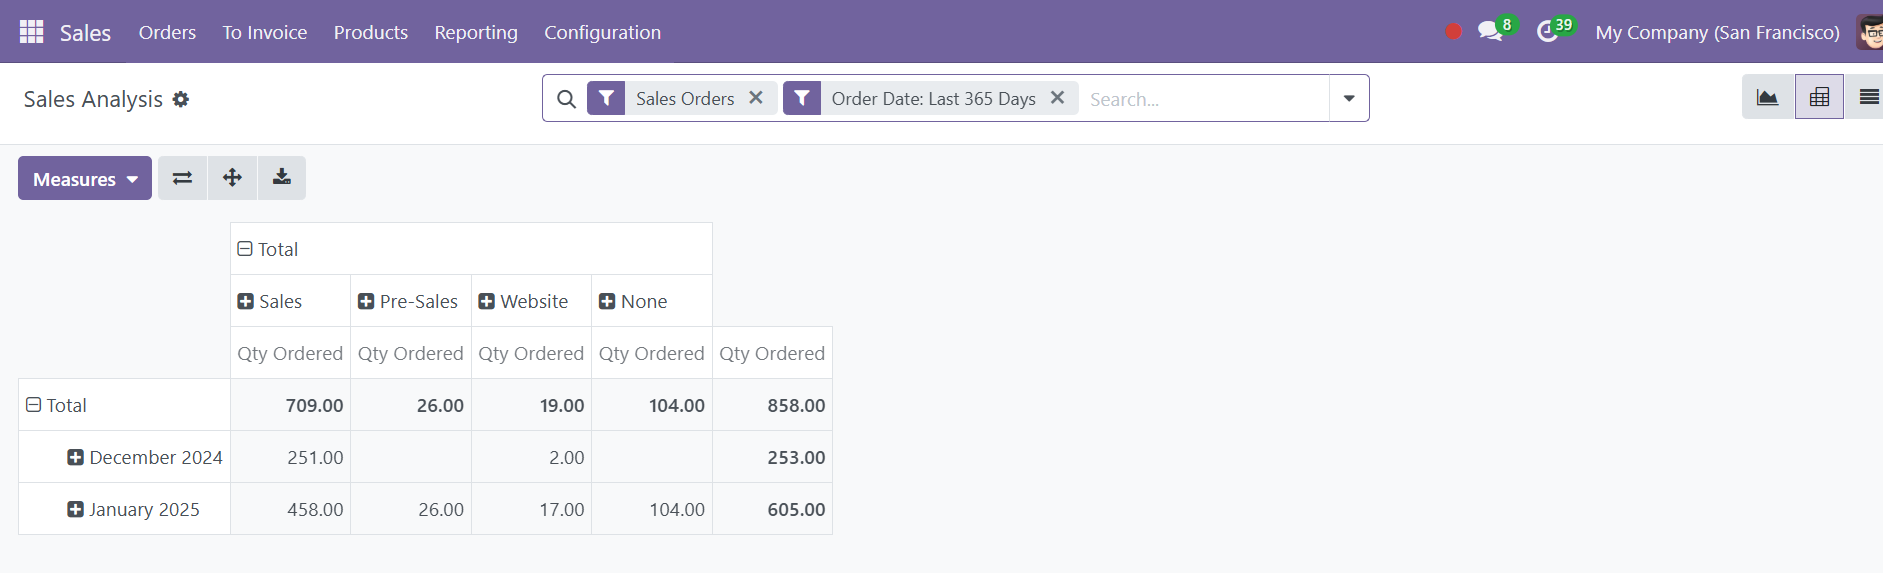
The Pivot view displays your sales report in a tabular format, making it easier to analyze detailed data. Additionally, the Flip Axis icon allows you to switch the axes for better visualization, while the Download xlsx feature lets you export the data to an Excel sheet. The Expand all option enables you to drill down into the details of the records for in-depth analysis.
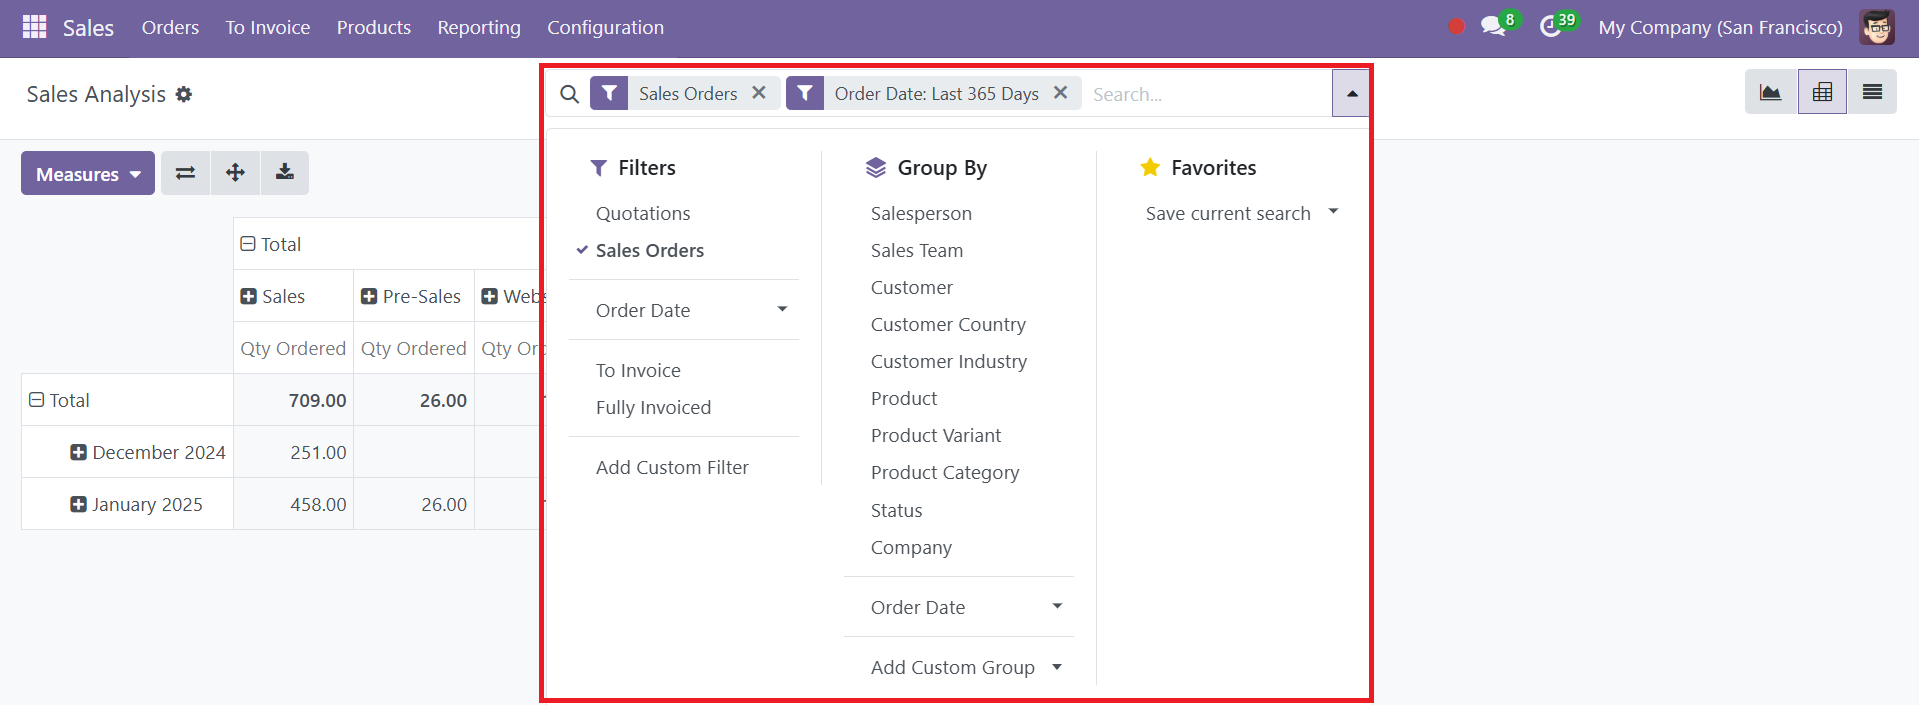
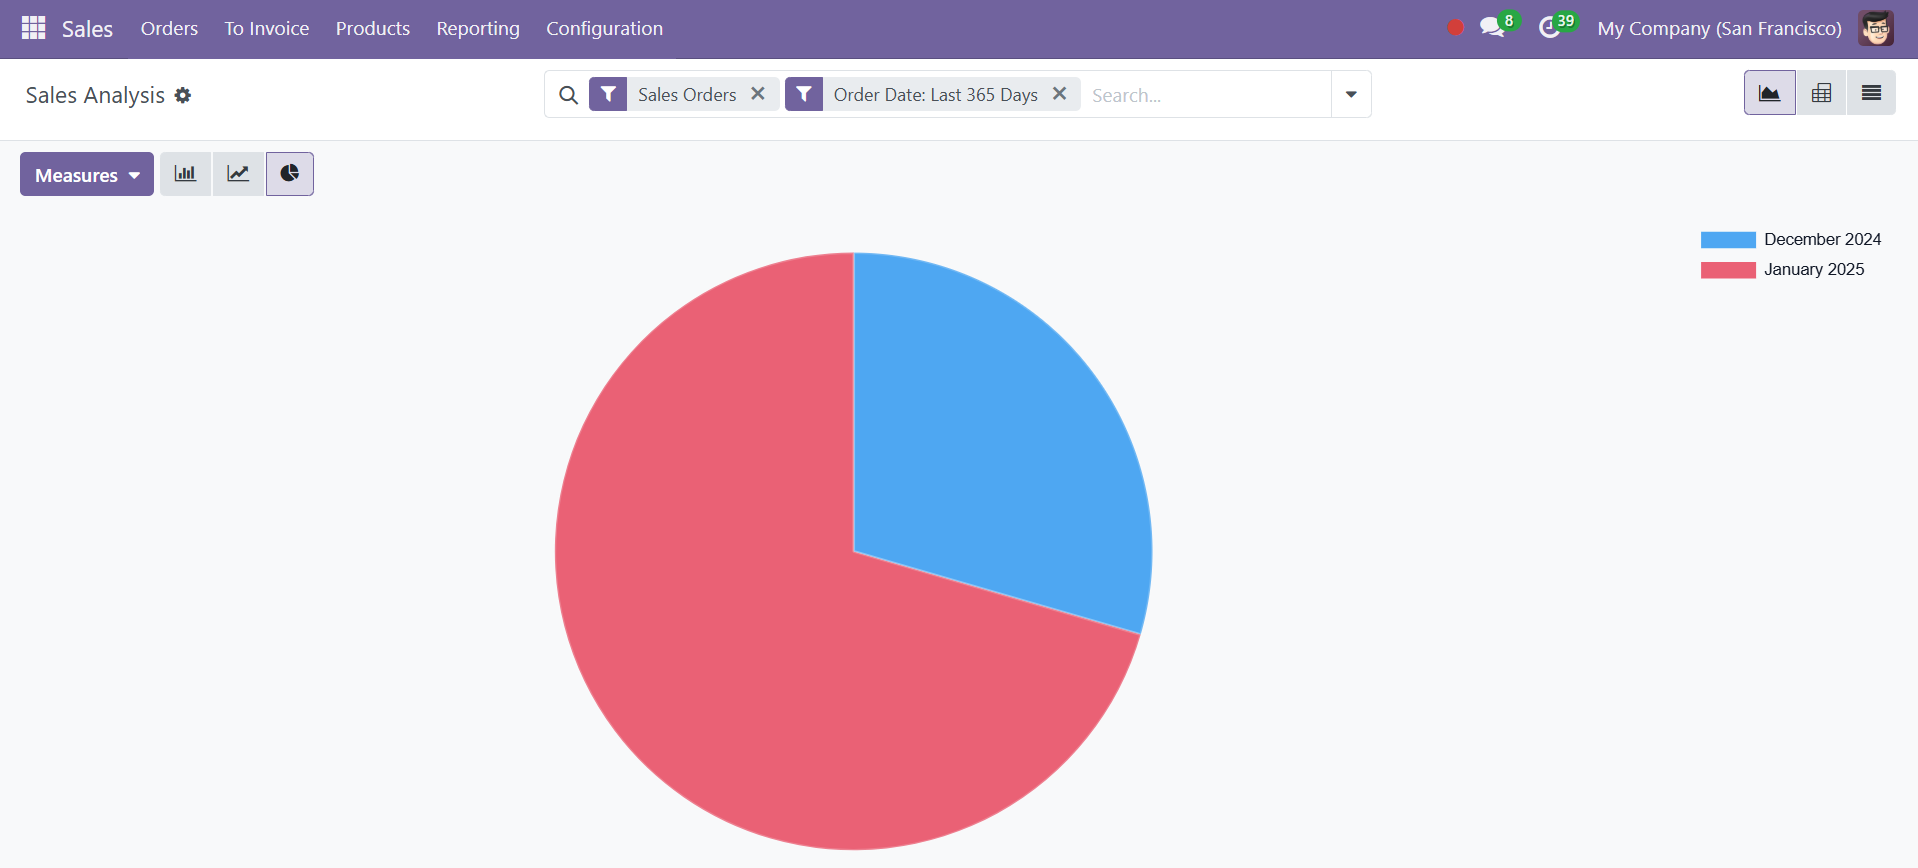
Filters further enhance reporting capabilities by allowing you to generate sales reports based on Order Date, with options to filter data for specific days, weeks, months, or years. The reports can be visualized in both Pivot and Graphical forms. The Graphical view offers three types of charts: Bar Chart, Line Chart, and Pie Chart, each of which provides unique perspectives to better understand sales trends and patterns.
The Odoo 18 Sales module not only simplifies the management of sales activities but also serves as a powerful tool for micromanaging quotes. Its advanced reporting and visualization features ensure seamless sales operations while offering actionable insights to support the growth and success of your business.
Sales Analysis by Salespersons
The Sales Analysis by Salespersons feature in Odoo allows businesses to evaluate the performance of individual sales representatives, enabling better monitoring, strategizing, and decision-making. This analysis provides insights into how each salesperson contributes to the overall revenue and helps identify areas for improvement or rewards.
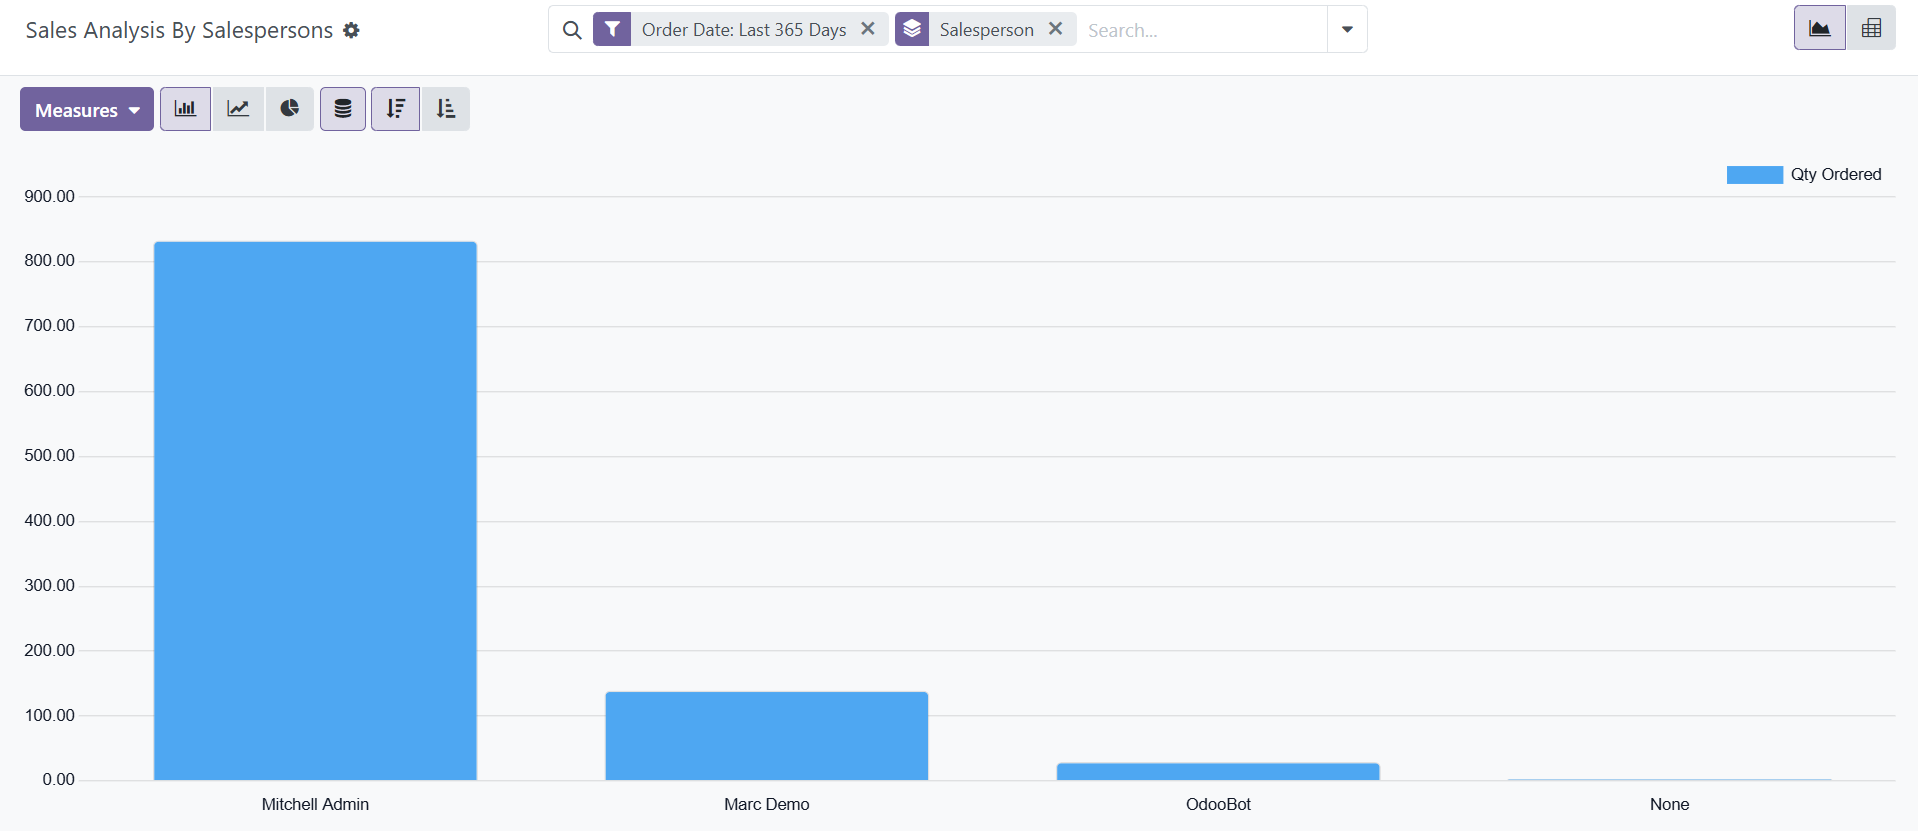
To access this feature, navigate to the Sales module and select the Reporting tab. In the Sales Analysis By Salespersons window, you can customize the data to focus on specific salespersons. Use the Group By option and select the Salesperson option to display data segmented by individual sales representatives. Additional filters such as date ranges or specific sales orders can further refine the analysis.
The results can be viewed in both Graphical and Pivot formats. The Graphical view offers a visual representation of the sales performance by salesperson, available as:
● Bar Chart: Displays sales figures per salesperson in an easy-to-read format, ideal for comparing performance across individuals.
● Line Chart: Shows trends in sales performance over time for each salesperson, highlighting growth or decline.
● Pie Chart: Breaks down the proportion of total sales contributed by each salesperson, offering a clear view of their relative impact.
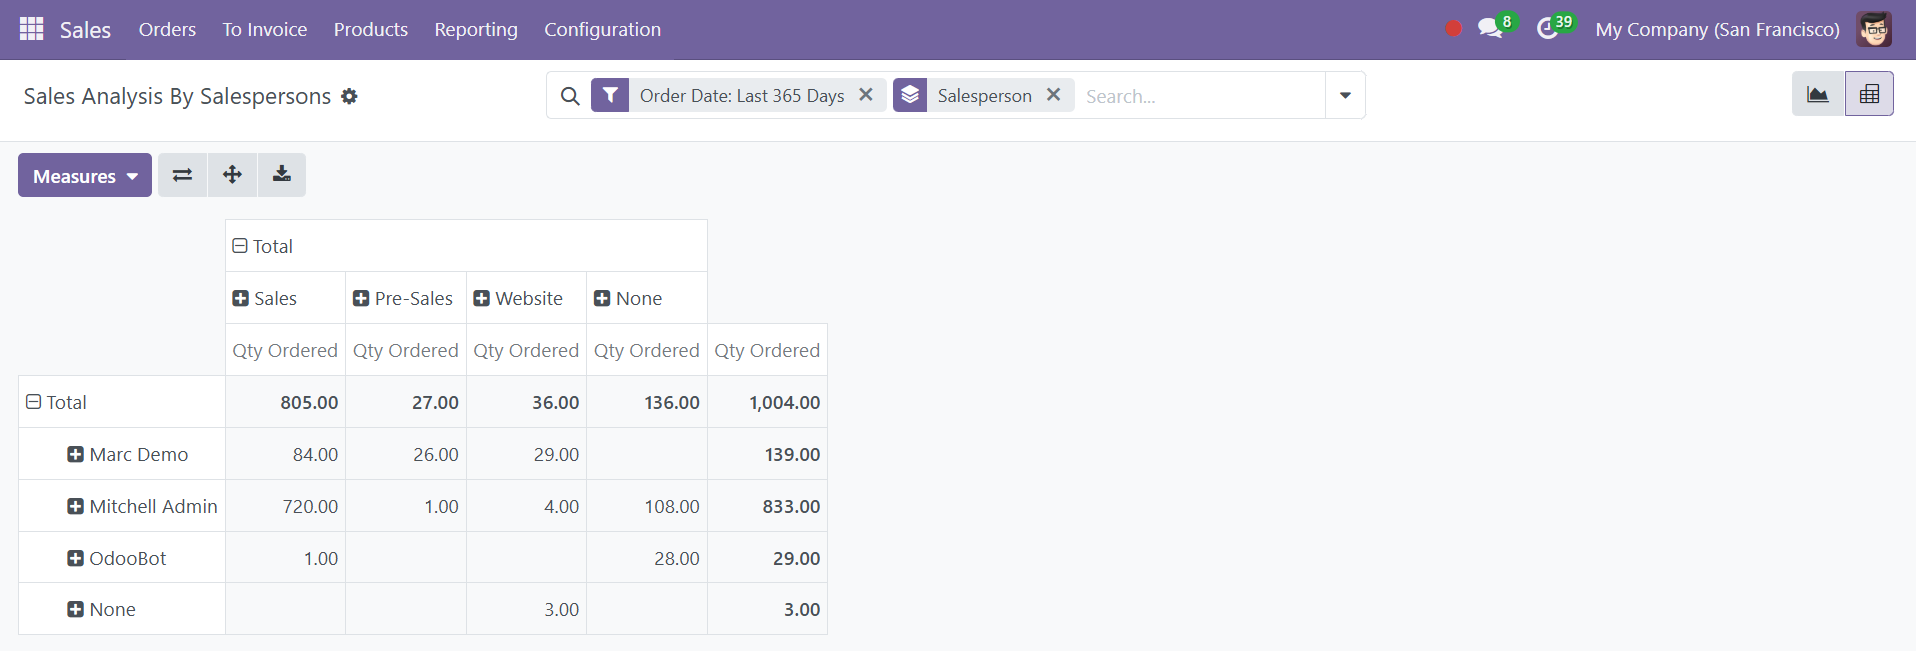
The Pivot view provides a detailed tabular representation of sales performance, including metrics like total sales, revenue, and order quantities for each salesperson. This view is especially useful for in-depth analysis or exporting data for external use through the Download xlsx option.
Sales Analysis By Products
Product reporting in the Odoo Sales module offers comprehensive insights into the performance of products, helping businesses optimize inventory management, pricing strategies, and sales operations. By navigating to the Reporting tab within the Sales module, users can access detailed data related to product sales, revenue, and trends.
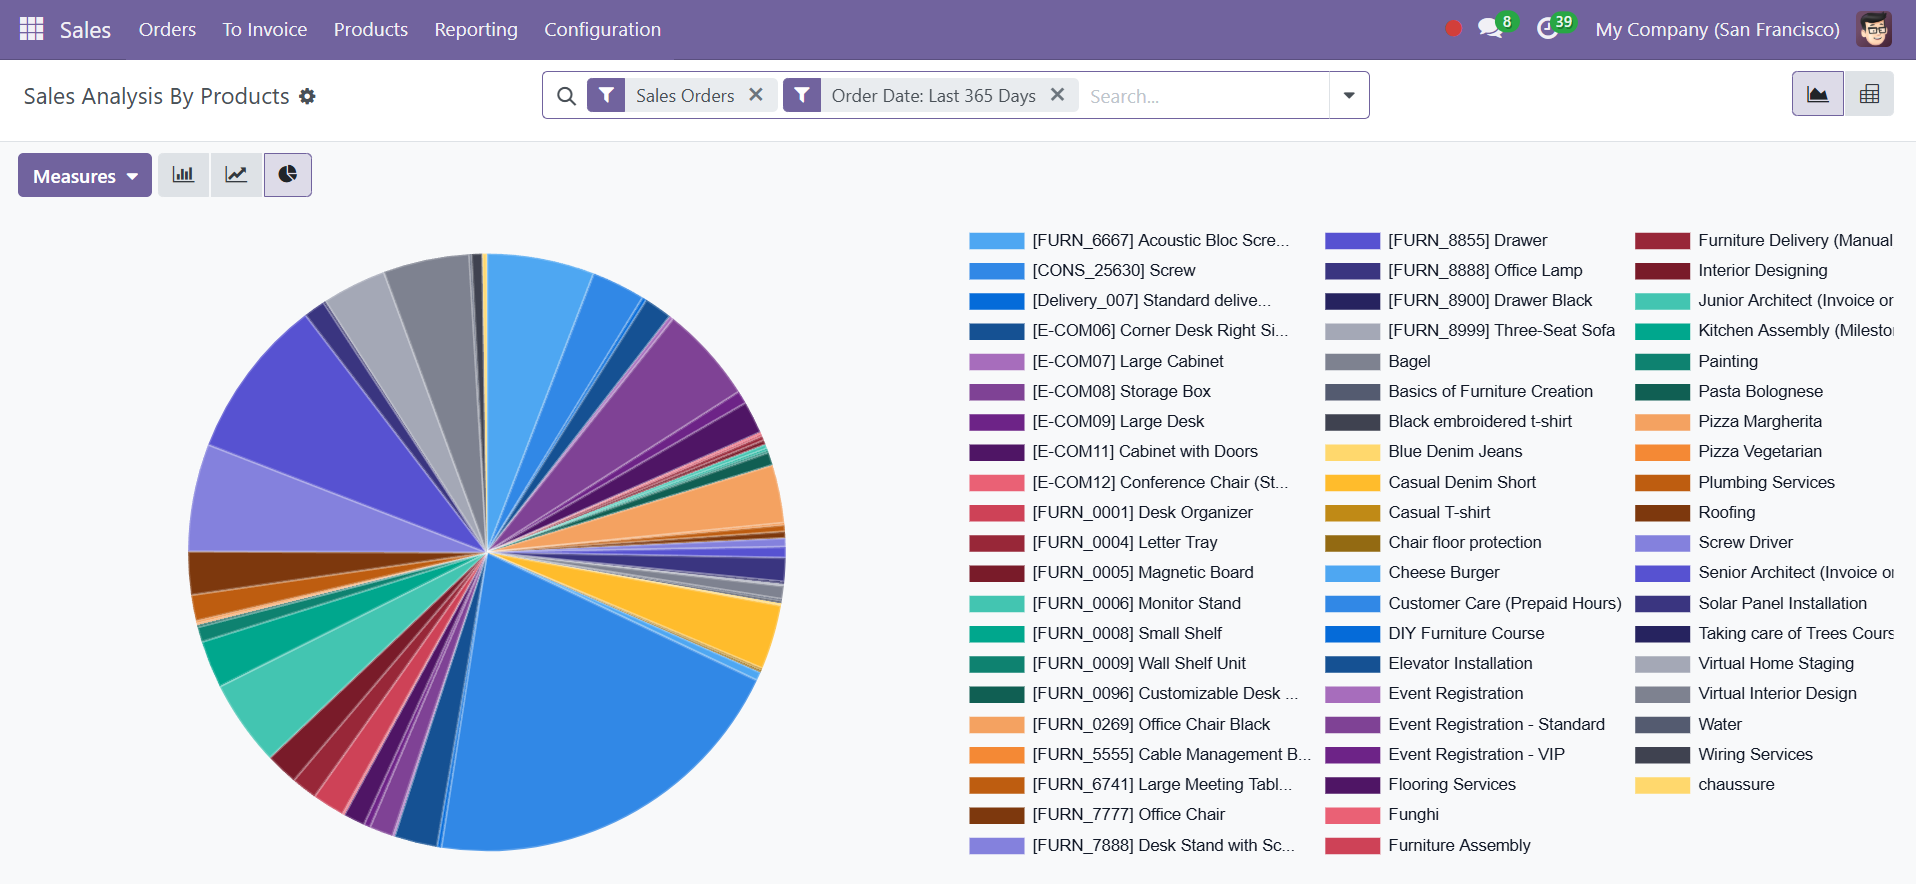
The module allows the use of filters and grouping options to tailor reports to specific needs. For example, users can filter sales data by product, product category, or time frame to analyze sales trends and identify high-performing or underperforming items. Additionally, the reports can be viewed in various formats, such as graphical representations (bar, line, or pie charts) or pivot tables, making it easier to interpret the data and take actionable steps.
Sales Analysis By Customers
Sales analysis by customers in the Odoo Sales module enables businesses to evaluate customer-specific sales performance, providing critical insights into purchasing patterns, customer value, and revenue contribution. By navigating to the Reporting tab within the Sales module, users can access detailed reports filtered by customer, allowing them to analyze sales trends and identify key accounts.
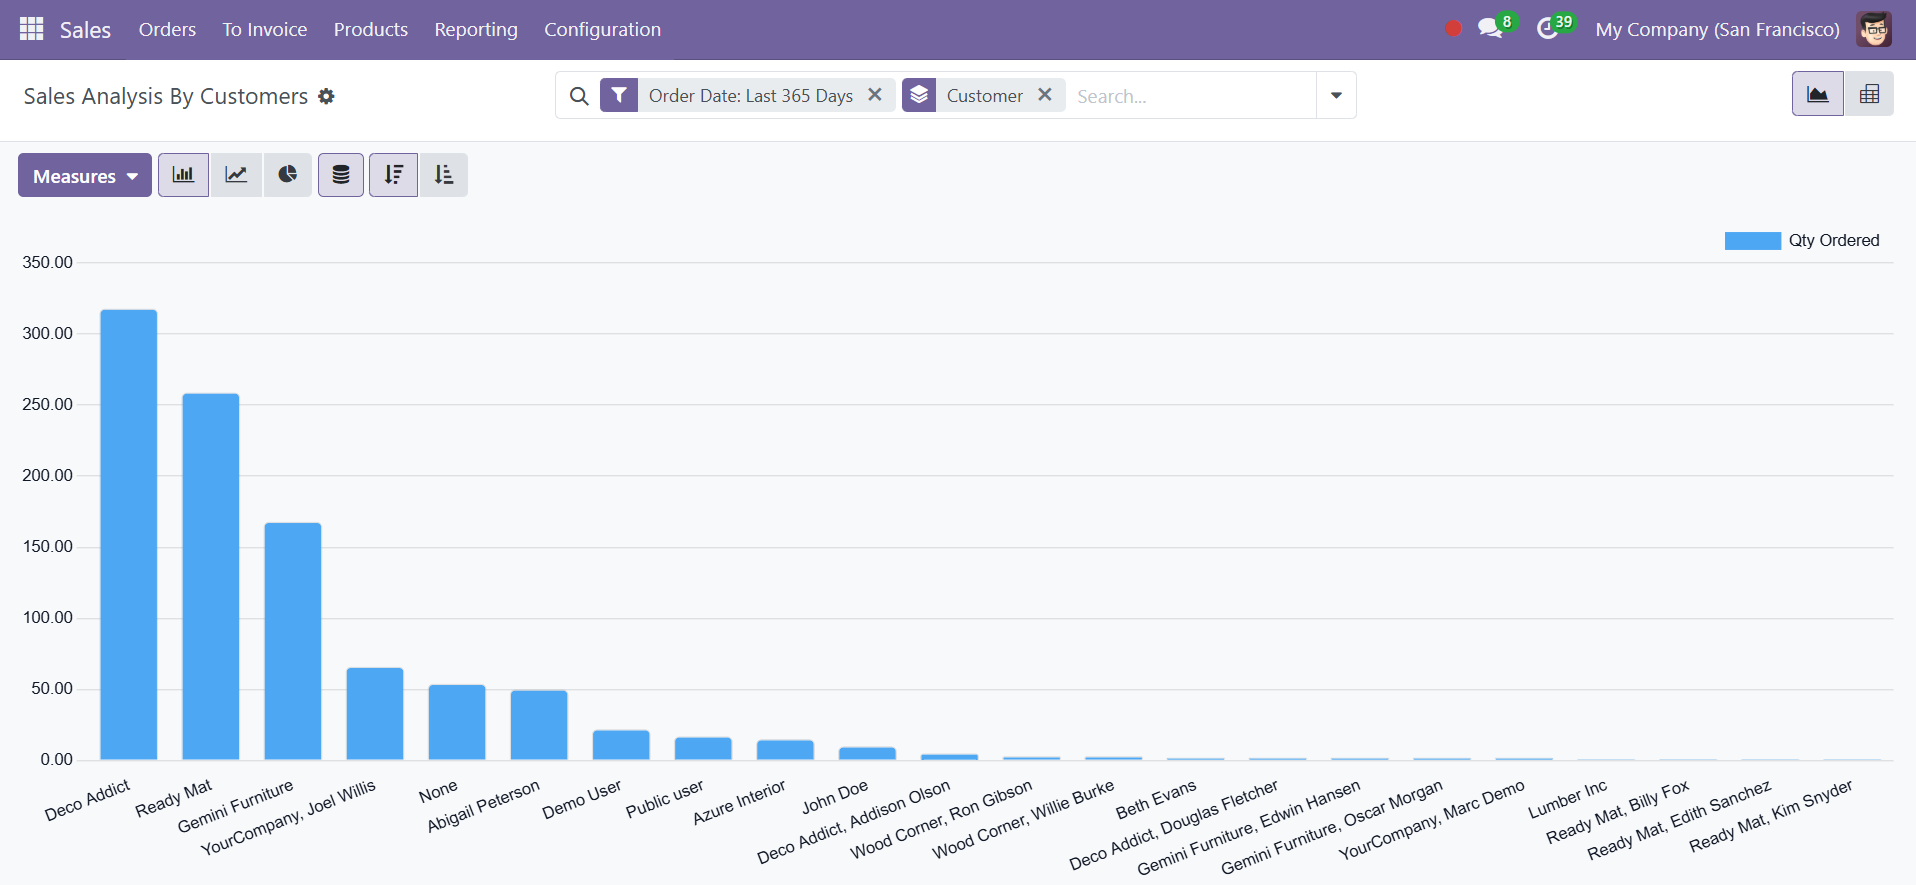
These reports can be further customized using filters and group-by options to display data for specific timeframes, customer categories, or regions. The graphical view offers visual representations such as bar charts, line charts, and pie charts, while the pivot view presents a detailed tabular format for in-depth analysis. Additionally, measures like total sales, quantity sold, or revenue can be selected to align the analysis with business objectives.
By leveraging customer-specific sales data, businesses can identify loyal customers, assess profitability, and design personalized marketing strategies to boost customer satisfaction and retention. This analysis also helps pinpoint underperforming customer segments, offering opportunities for targeted outreach and improved sales performance.