In Odoo 18, the Reporting tab within the Repair Module offers a powerful and insightful way to track and analyze the repair process. This feature allows businesses to generate detailed reports, providing a clear overview of the repair activities, their progress, and any necessary adjustments that need to be made. The reporting functionality is a valuable tool for monitoring the effectiveness of repair operations, identifying bottlenecks, and making data-driven decisions to optimize processes.
The reporting interface in Odoo 18 is designed to display repair data in various formats, making it easy to interpret and analyze. Users can access different views such as Kanban, List, Pivot, and Graphical formats, depending on their preference and the type of analysis they want to perform. For example, the Pivot view presents analytical data, allowing users to dive deep into the metrics of repair orders, while the Graphical view offers an intuitive representation of the data through Pie, Bar, and Line charts.
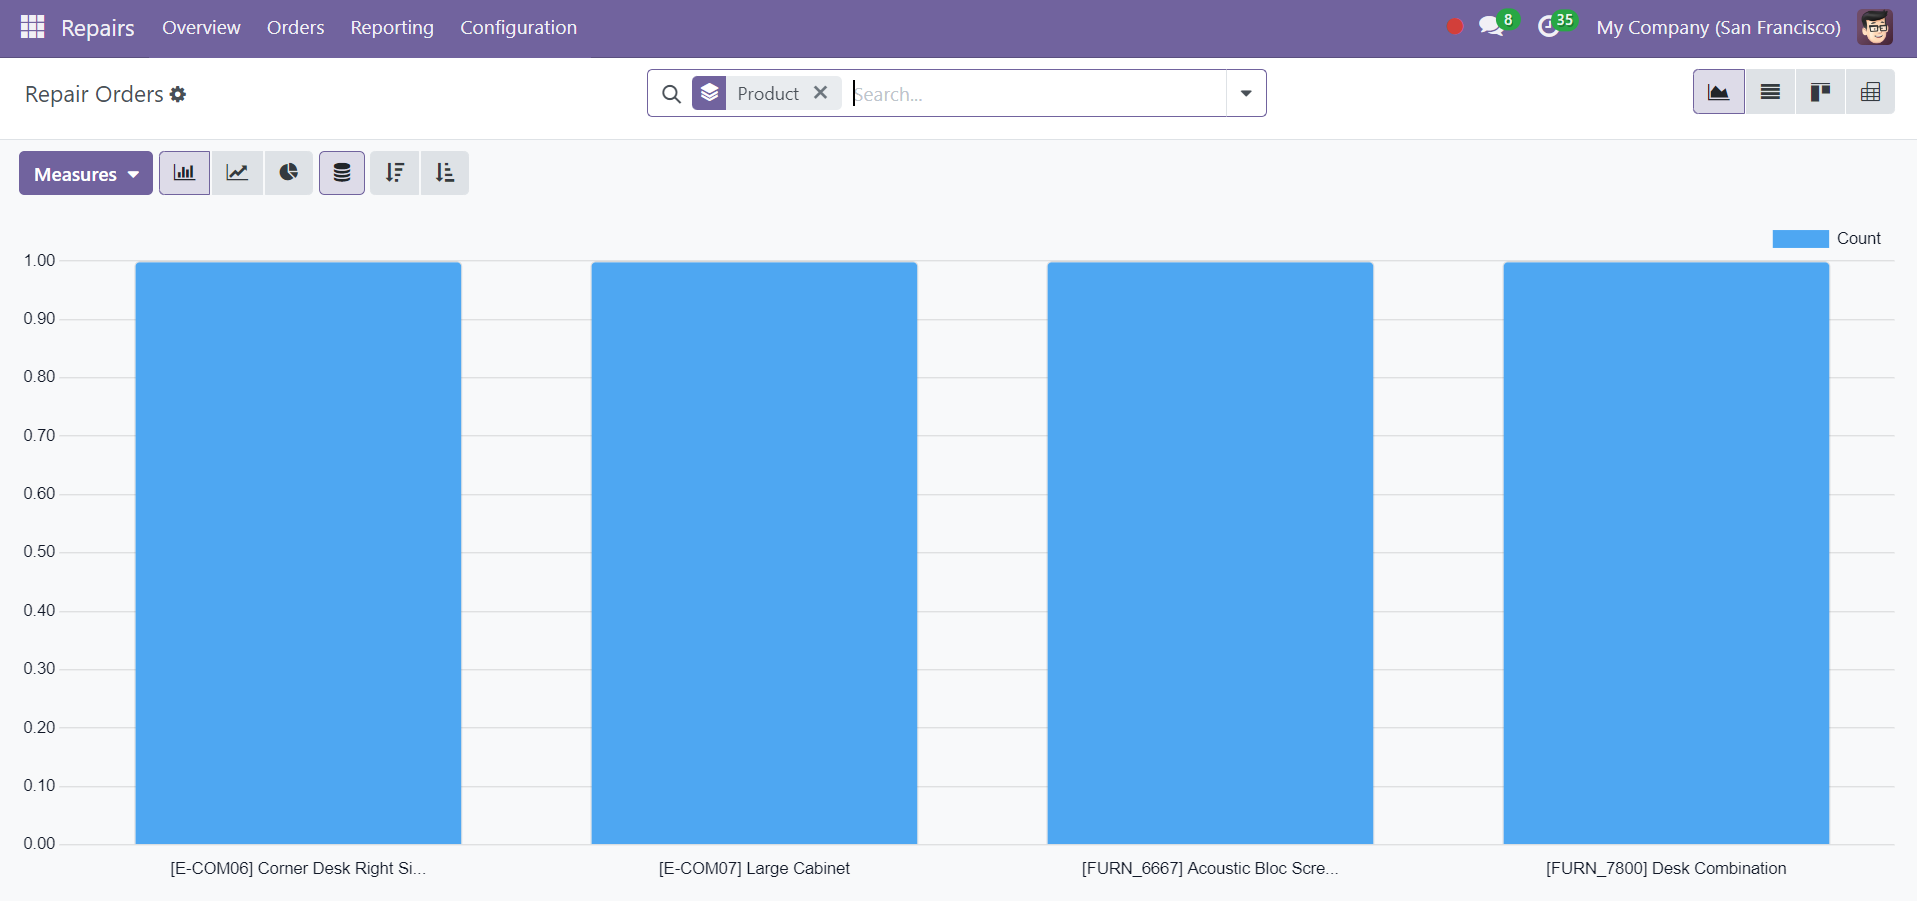
In the Graphical view, users can visualize the repair data across different axes. One axis typically represents the products that need to be repaired, while the other axis indicates the count or frequency of repairs. This makes it easier to understand trends, such as which products are frequently undergoing repairs or how often certain repair processes are performed.
Additionally, users can leverage the Filters and Measures options to refine the data and generate more focused reports. The Measures option includes metrics such as Product Quantity and Count, enabling users to analyze key financial and operational aspects of the repair process. By filtering the data based on these measures, businesses can gain insights into the costs associated with repairs, the volume of repairs completed, or the financial impact of repairs under warranty.
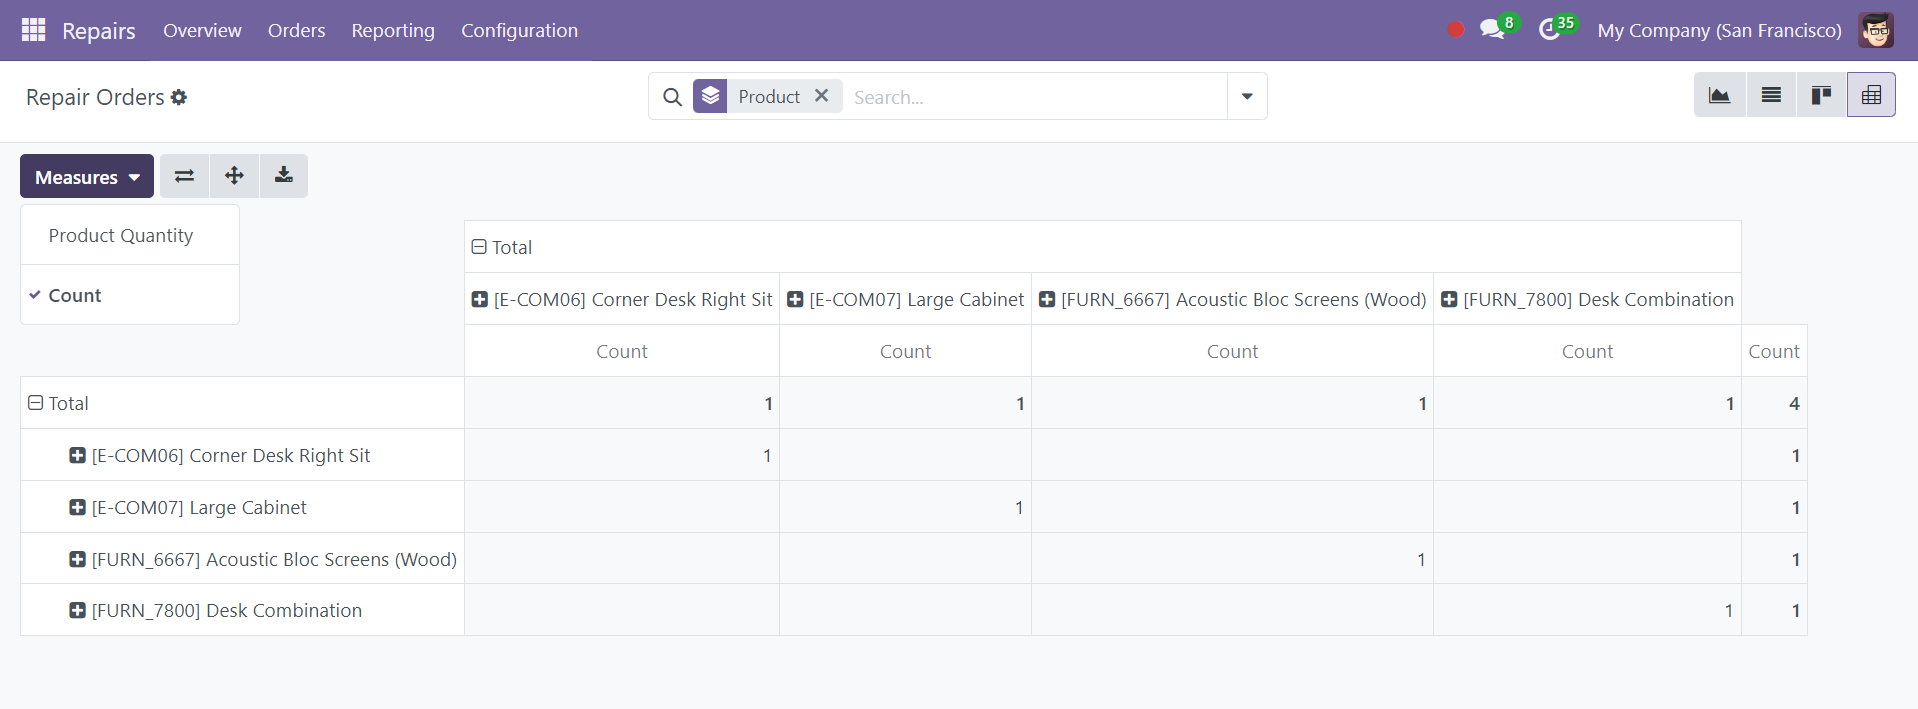
The Kanban, List, and Pivot views provide additional ways to interact with the repair data. In Kanban view, repair orders are displayed as cards, allowing for quick visual identification of the status of each repair. The List view presents a more structured tabular format, making it easy to scan through repair orders and compare their details. The Pivot view, on the other hand, is ideal for users who want to perform detailed analysis by breaking down repair data into multiple dimensions, such as by product, customer, or status.
The Reporting tab in Odoo 18 serves as a comprehensive tool to monitor the state of repairs and produce detailed reports that can inform decision-making. Whether businesses need to track the efficiency of their repair operations, analyze the cost of repairs, or identify patterns in product defects, the Reporting tab offers the flexibility and functionality to meet these needs.