The Reporting feature in Odoo 18 CRM offers a comprehensive platform for analyzing various activities and their statuses in relation to the company’s operations. With its advanced reporting tools, Odoo enhances productivity by delivering precise insights into overall business performance. Within the Reporting tab, you’ll find key views such as Forecast, Pipeline, Leads, Activities, Partnerships, and Lead Generation, accessible from the dropdown list.
Forecast
The Forecast Reporting view displays opportunities categorized by their ‘Expected Closing’ month. To customize how this information is displayed, use the four icons in the upper-right corner of the window including Kanban, Graph, Pivot, and List.
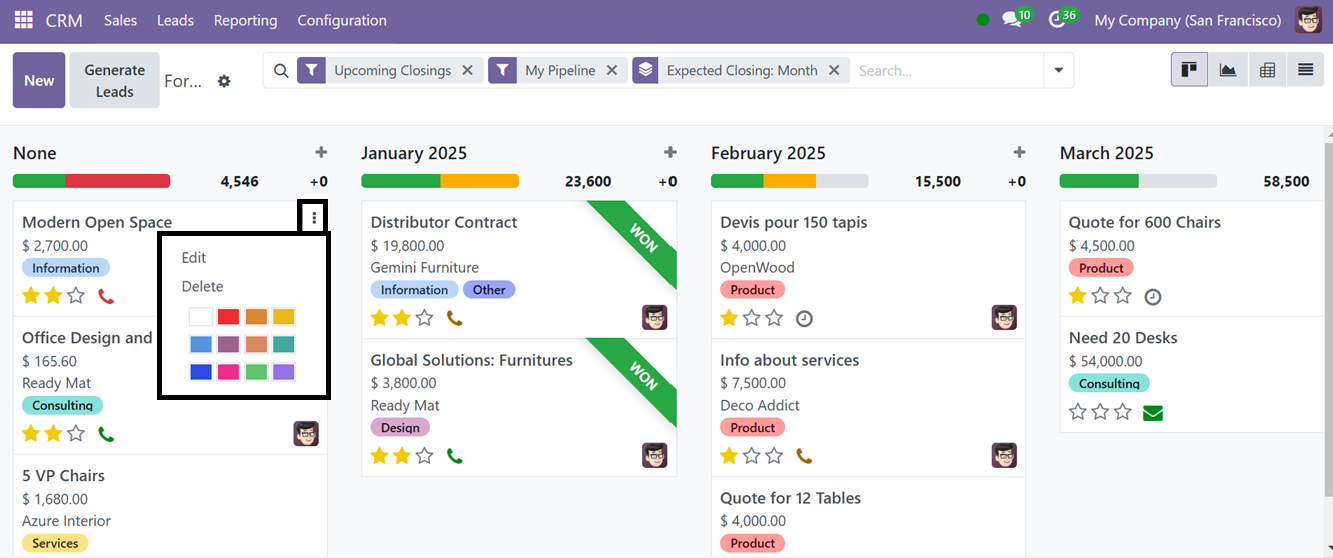
The small action button provided at the top of the window can be used to Import Records and Create Dashboards with the forecasted opportunities data. The three dotted menu on each kanban card can be used to edit and delete the pipelines. Also, you can highlight the pipeline cards using the color options. The settings icon provided near the pipeline stages area can be used to Fold and Automate the Kanban stages.
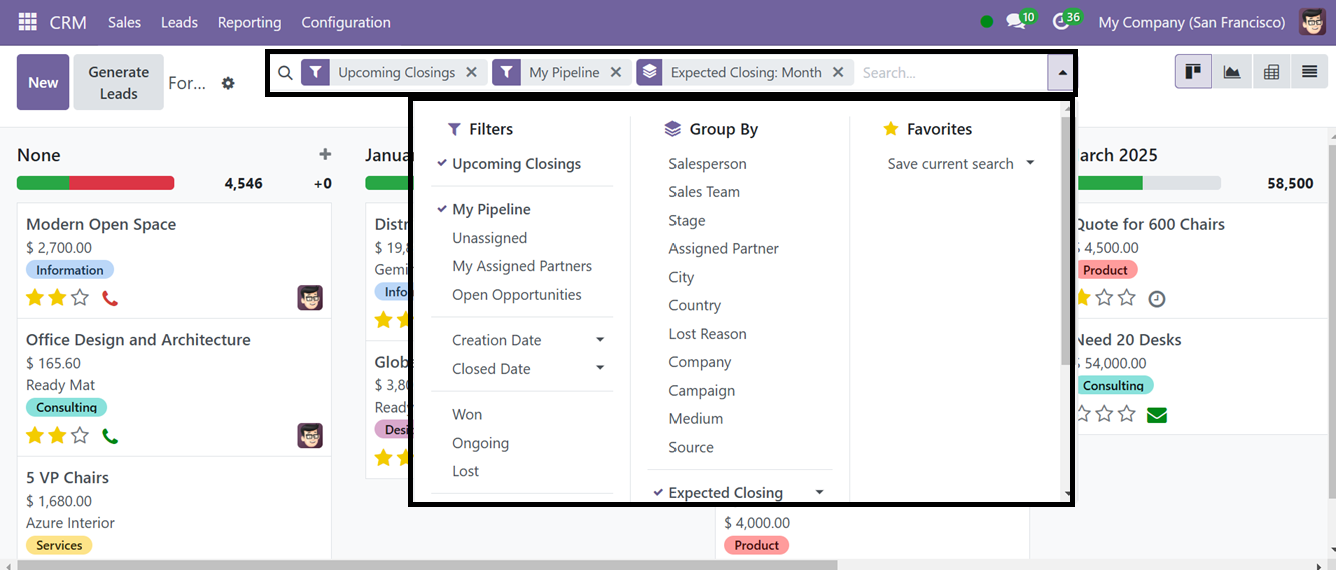
You can further refine the data using the Filters and Group By functions. Additionally, you can save your commonly used filters and set default criteria through the "Favorites" option.
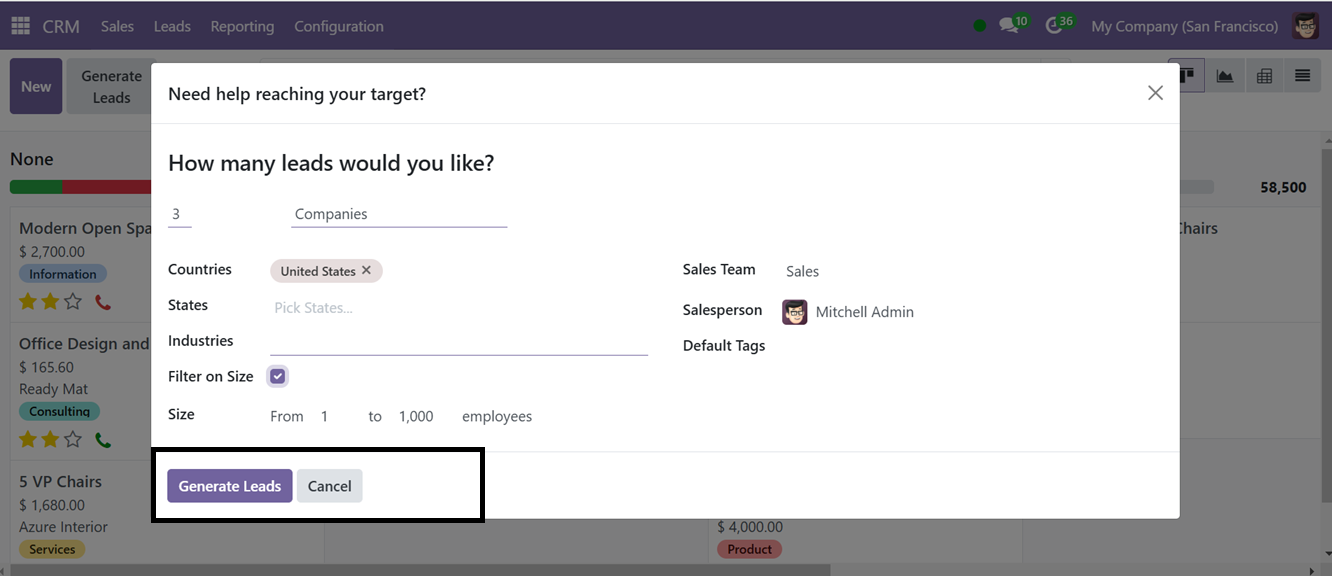
The "Generate Lead" button enables users to generate leads directly from this interface. Upon clicking the button, a new pop-up window will appear, allowing users to specify the desired number of leads. Additionally, users can define the target Countries, States, Industries, and apply filters based on Company Size to refine their selection. Furthermore, it is necessary to specify the Sales Team, Salesperson, and Default Tags, as demonstrated in the screenshot below.
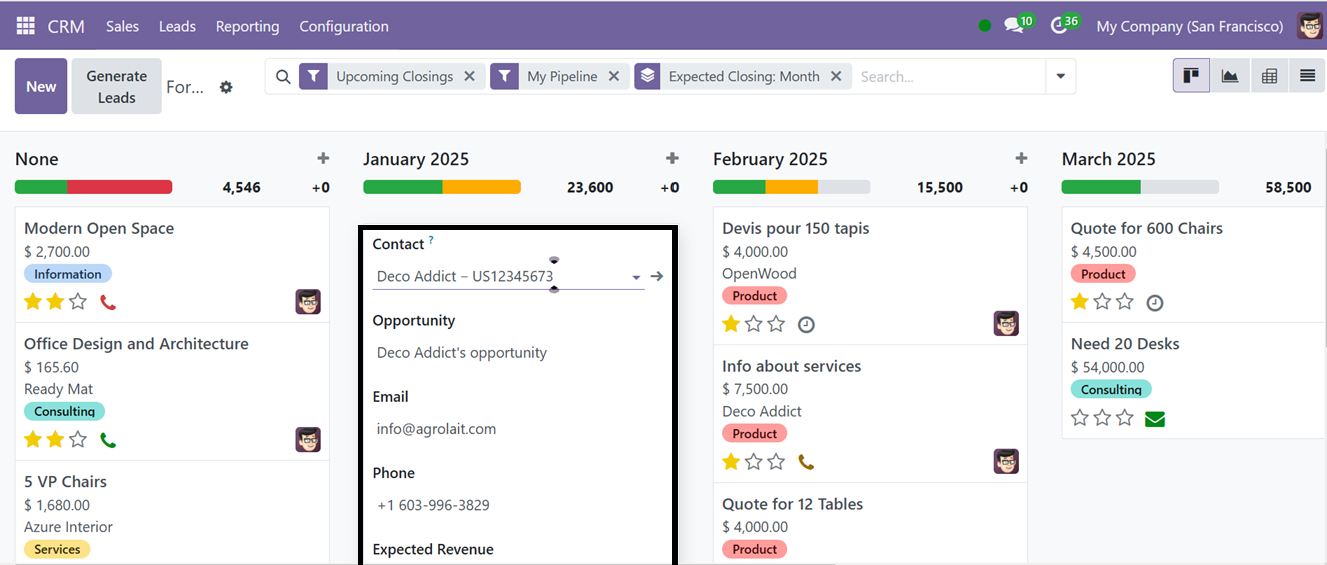
Then, click on the ‘Generate Leads’ button to generate the required leads. This will be only available if lead mining is enabled from CRM configuration settings. You can add a new opportunity by clicking on the ‘+’ icon provided near each pipeline stage title area. To create a new opportunity directly from this view, click the "New" button. A dialogue box will appear where you can input details such as Organization/Contact, Opportunity, Email, Phone, Expected Revenue, Priority, and Recurring plan. After filling in the required fields, click on the "Add" button, as illustrated in the screenshot below.

After adding the new forecast pipeline, you can open its form view and create a new Quotation from it, mark it as Lost, Won, and also Enrich the opportunity using the relevant buttons.
Pipeline
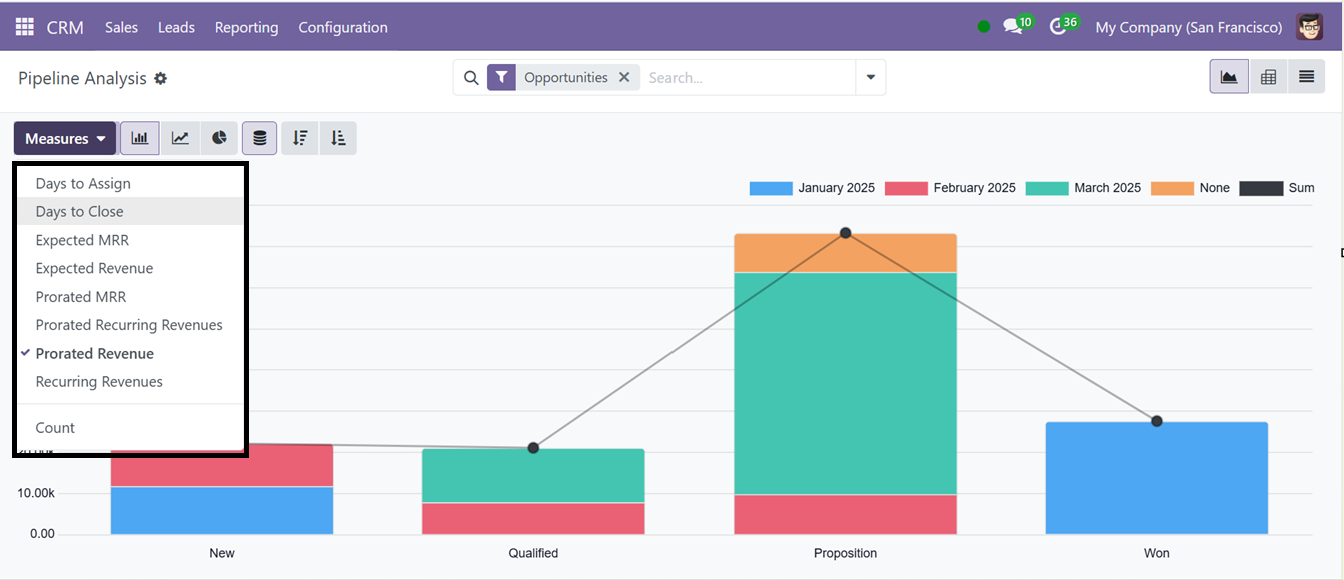
The Odoo 18 CRM Module's ‘Pipeline Reporting’ window is a potent analytical tool that provides comprehensive insights into the sales pipeline. It lets users measure performance, keep an eye on leads and prospects, and examine important sales indicators. By evaluating conversion rates, identifying patterns, and optimizing strategies, this capability lets organizations make data-driven decisions that will increase revenue growth.
From this window, you can choose between graph, pivot, or list views by selecting the icons in the upper-right corner. You can also switch between different graph types including; bar chart, line chart, or pie chart for better visual representation of your pipeline data. Using the ‘Measures’ button, you can change the report parameters into various other options including Days to assign, Days to Close, Expected MRR, Expected Revenue, Prorated MRR, Prorated Recurring Revenue etc.
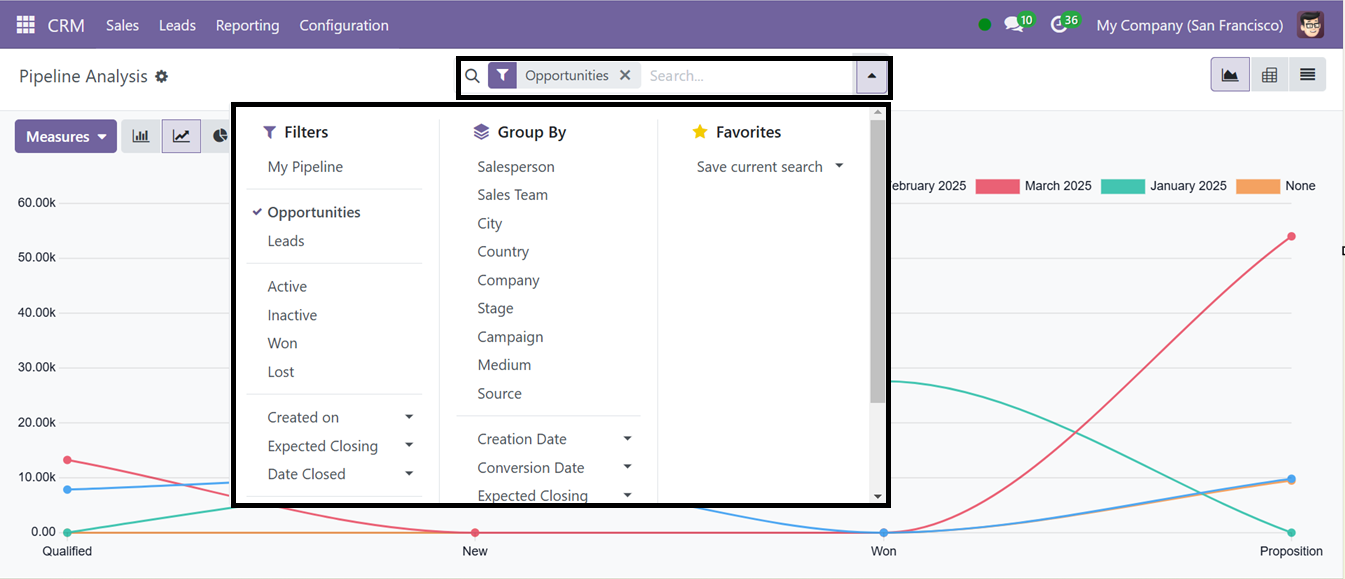
By utilizing the Advanced Search Bar, users can filter or sort the required data using various Filter and Group By options. The Favorites feature allows users to mark important data for quick access and prioritization.
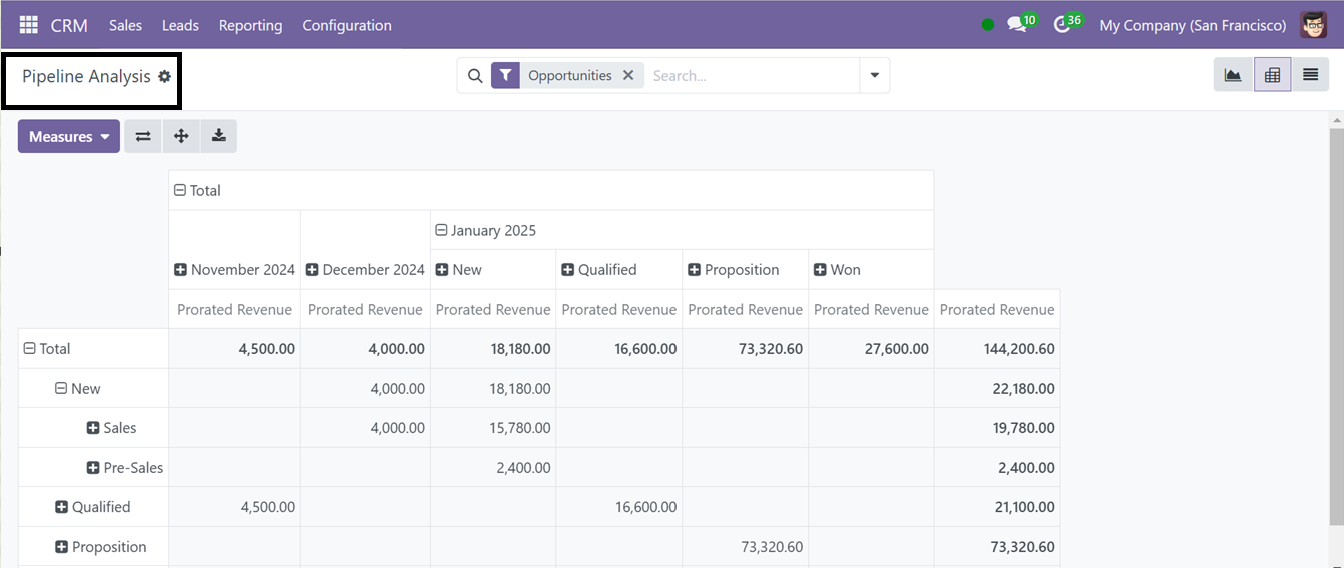
The Pivot View Reporting window in the RM Module is a powerful tool for generating detailed, customizable sales reports. It provides a spreadsheet-like interface for organizing and analyzing data through aggregation, grouping, and comparison. Users can apply various measures, filters, and grouping options to track key performance indicators (KPIs) such as revenue, conversion rates, and salesperson performance. By offering real-time insights, Pivot View helps businesses identify trends, evaluate sales effectiveness, and refine their strategies for improved decision-making.
Leads
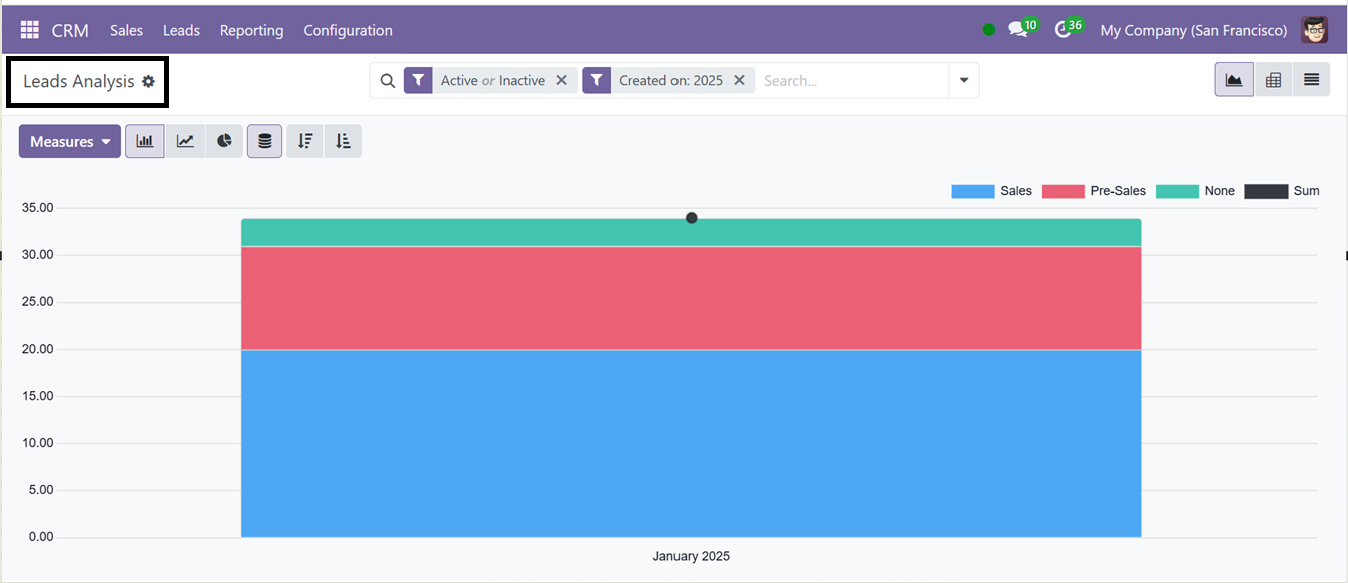
The ‘Leads Analysis’ feature in the Reporting tab allows you to evaluate all activities related to leads in a graphical view, as illustrated in the screenshot below.
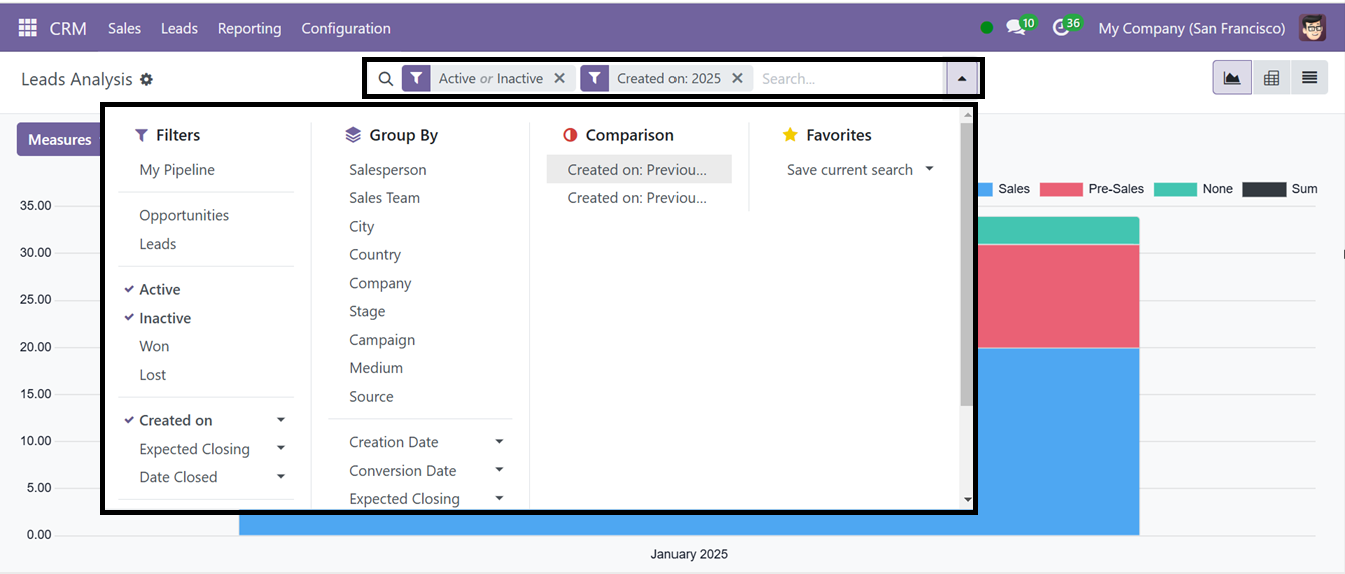
You can search, filter, and group lead data based on specific criteria using the Filters and Group By options. The "Comparison" dropdown menu offers two options: "Created on: Previous Period" and "Created on: Previous Year." These options allow you to compare lead data from previous quarters or years. You can also save and set defaults for specific filters using the "Favorites" feature.
Activities
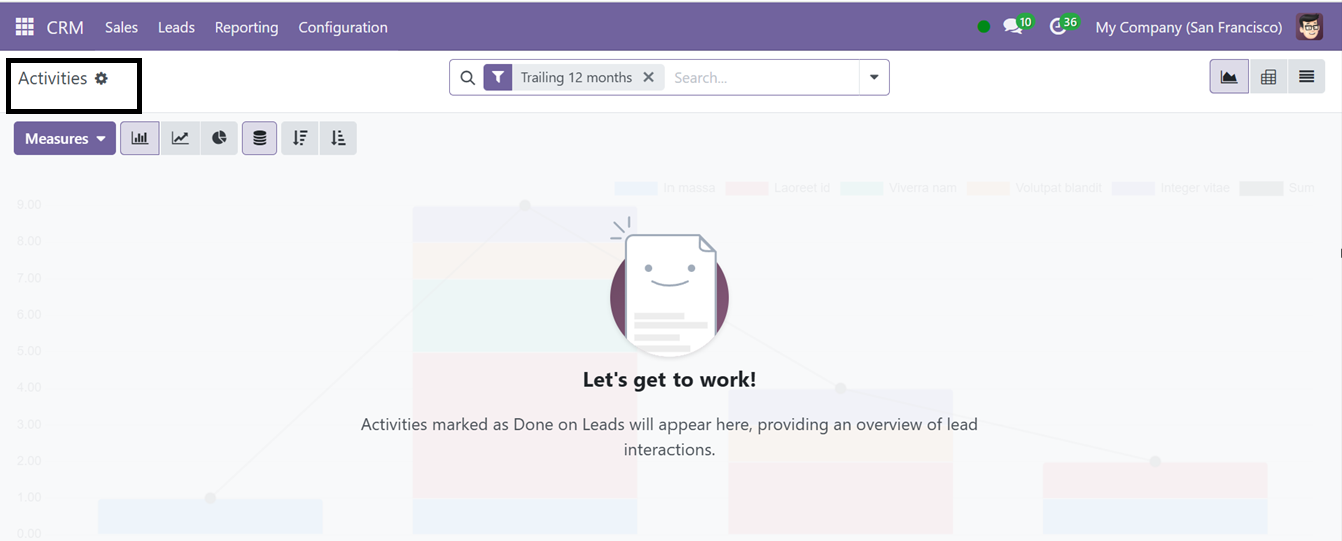
In the ‘Activities’ view within the Reporting section, you can conduct an in-depth analysis of all activities related to your sales pipeline.
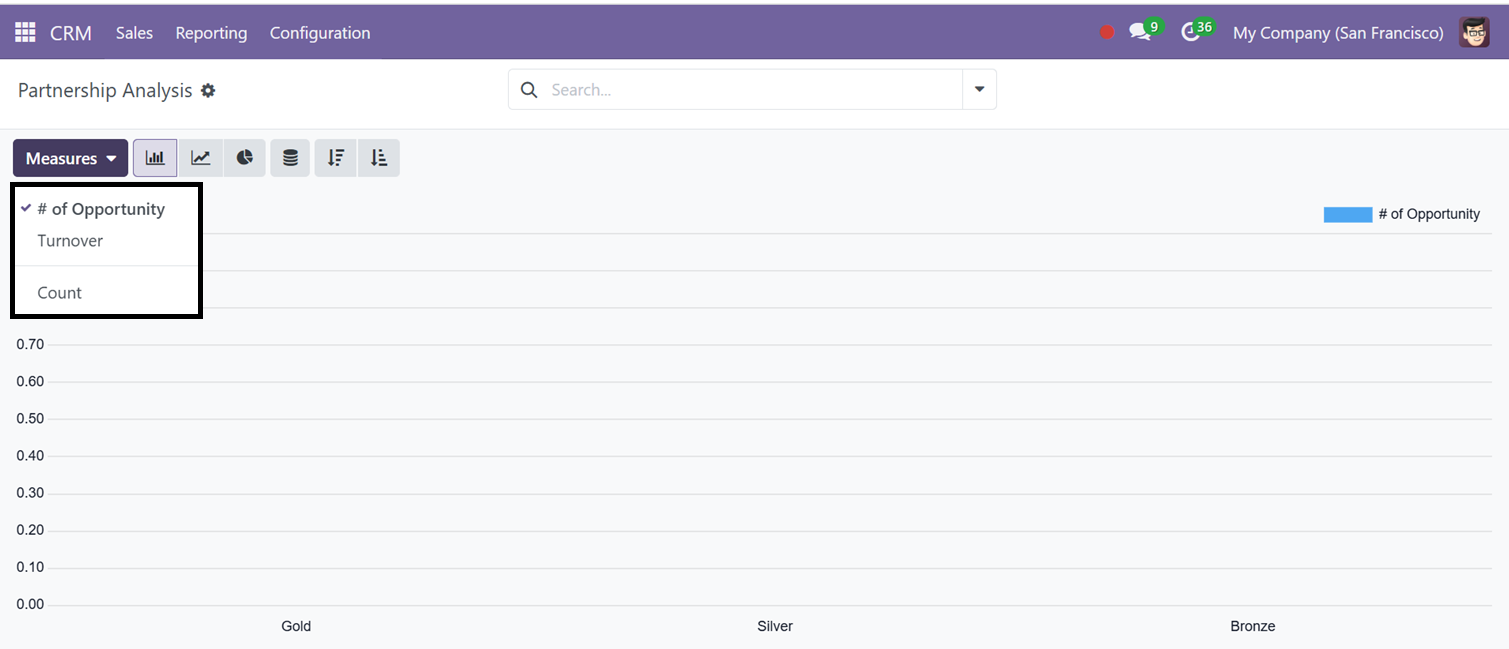
Partnership
The “Partnership” Analysis tool provides an effective way to evaluate the relationship between a partnership's turnover and its grade.