Reporting
You may examine your online sales using the Reports portion of
the Odoo17 Website module. You can see the Analytics, eCommerce,
Online Sales, Visitors, Page Views by selecting the Reports tab.
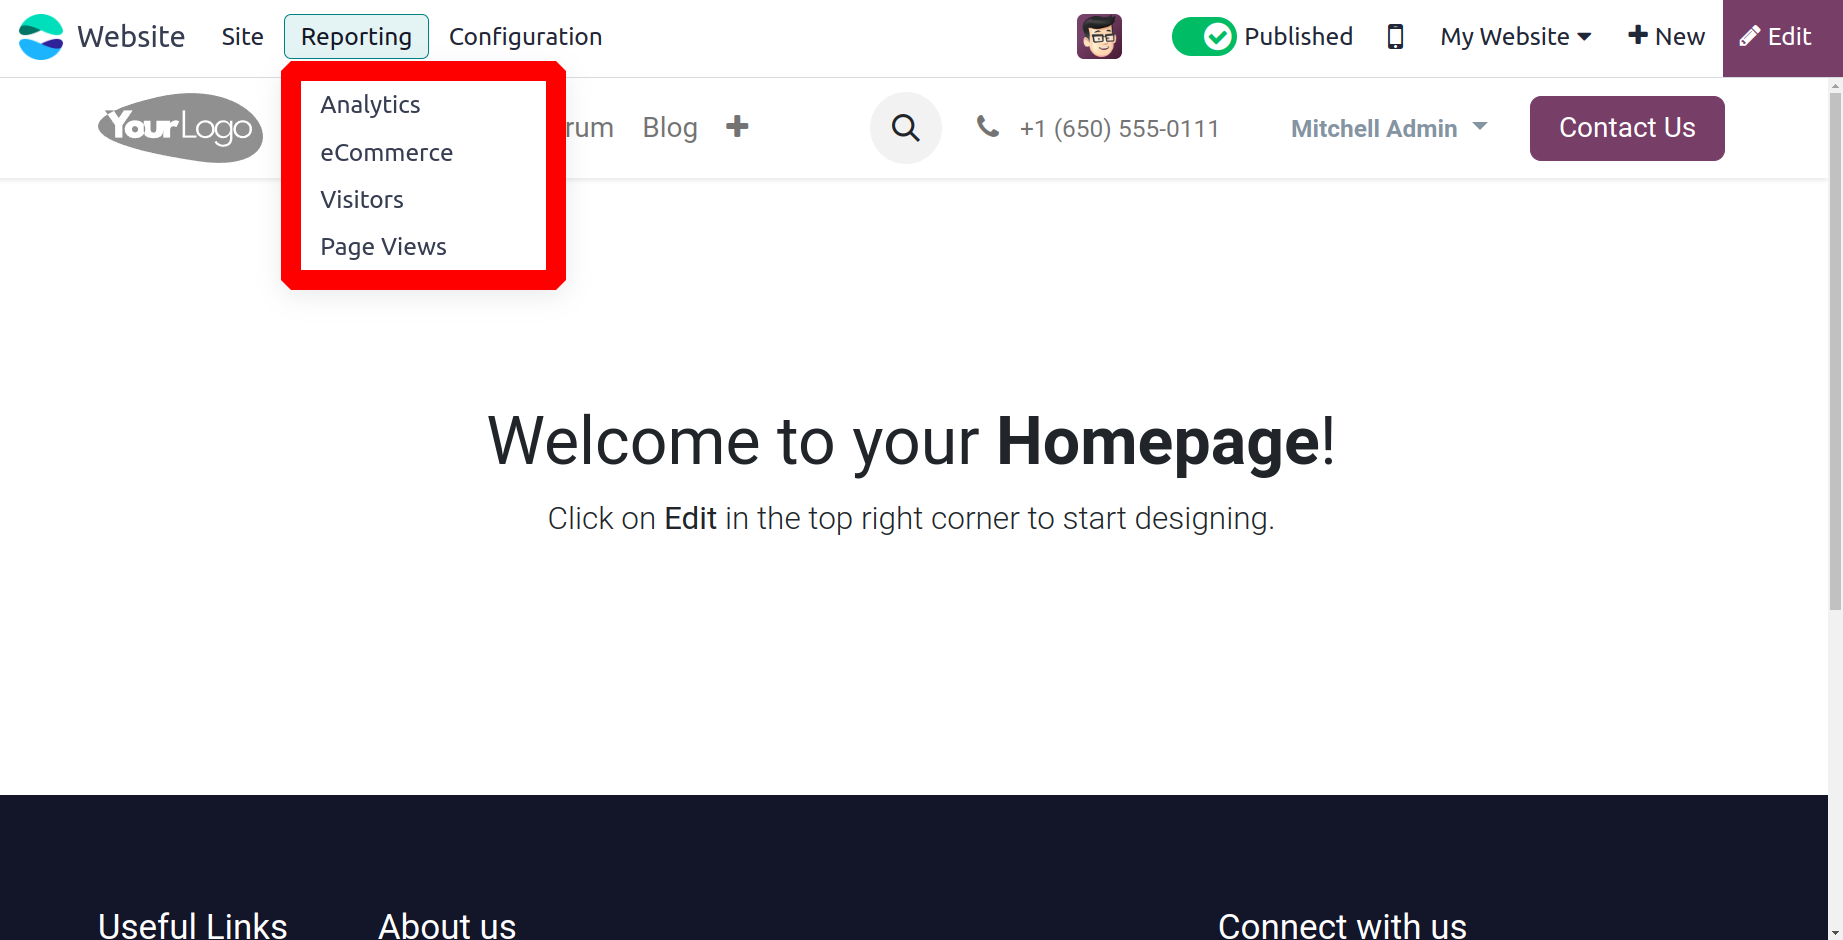
Analytics
The Google Analytics function, which is supported by the Odoo17 Website and eCommerce
module, is a useful tool for tracking and evaluating website traffic. With the help of
this application, you may examine the quantity, duration, and other characteristics of
website visitors. In order to benefit from this feature, you must first create a Google
Analytics account and obtain the necessary credentials. Integrating Google Analytics
with the Odoo17 Website module is simple. You must activate Google Analytics in the
Settings box in order to doso..
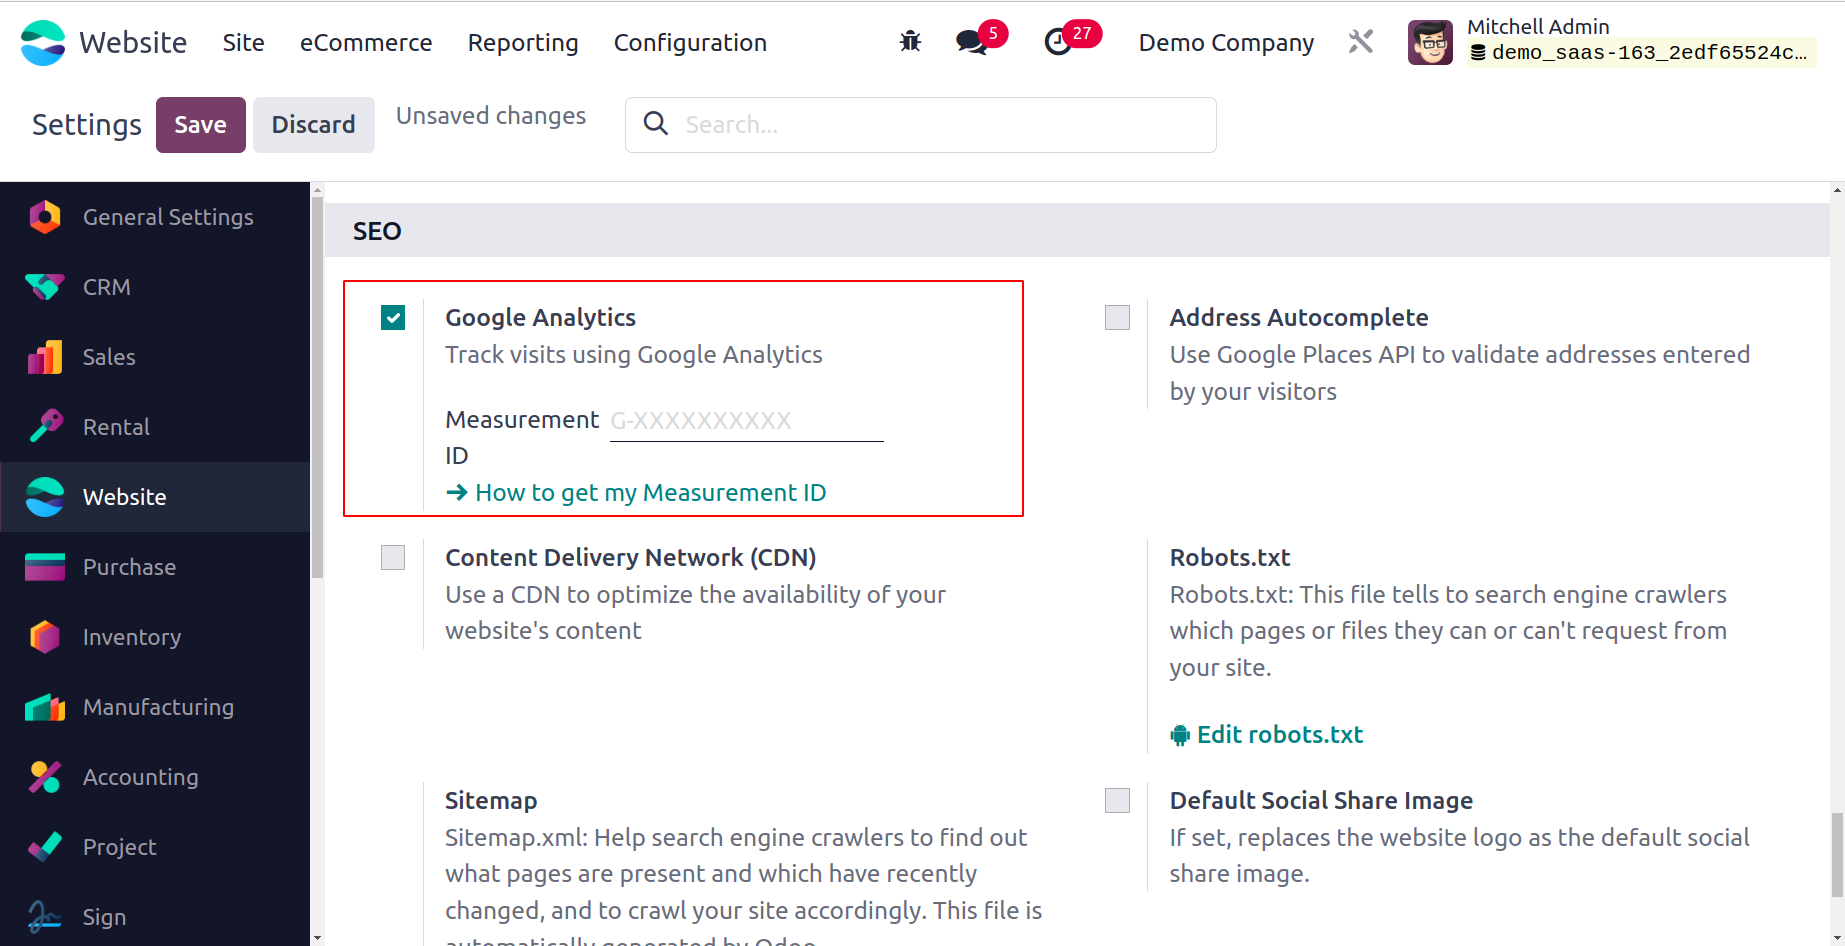
This function, which allows you to track, view, and analyze website visitor numbers
straight from the module's Report tab, would be very helpful. Every piece of information
gathered upon connecting to the business's
Google Analytic activities will be displayed in the analytical report window. You can
enter your Measurement ID here.
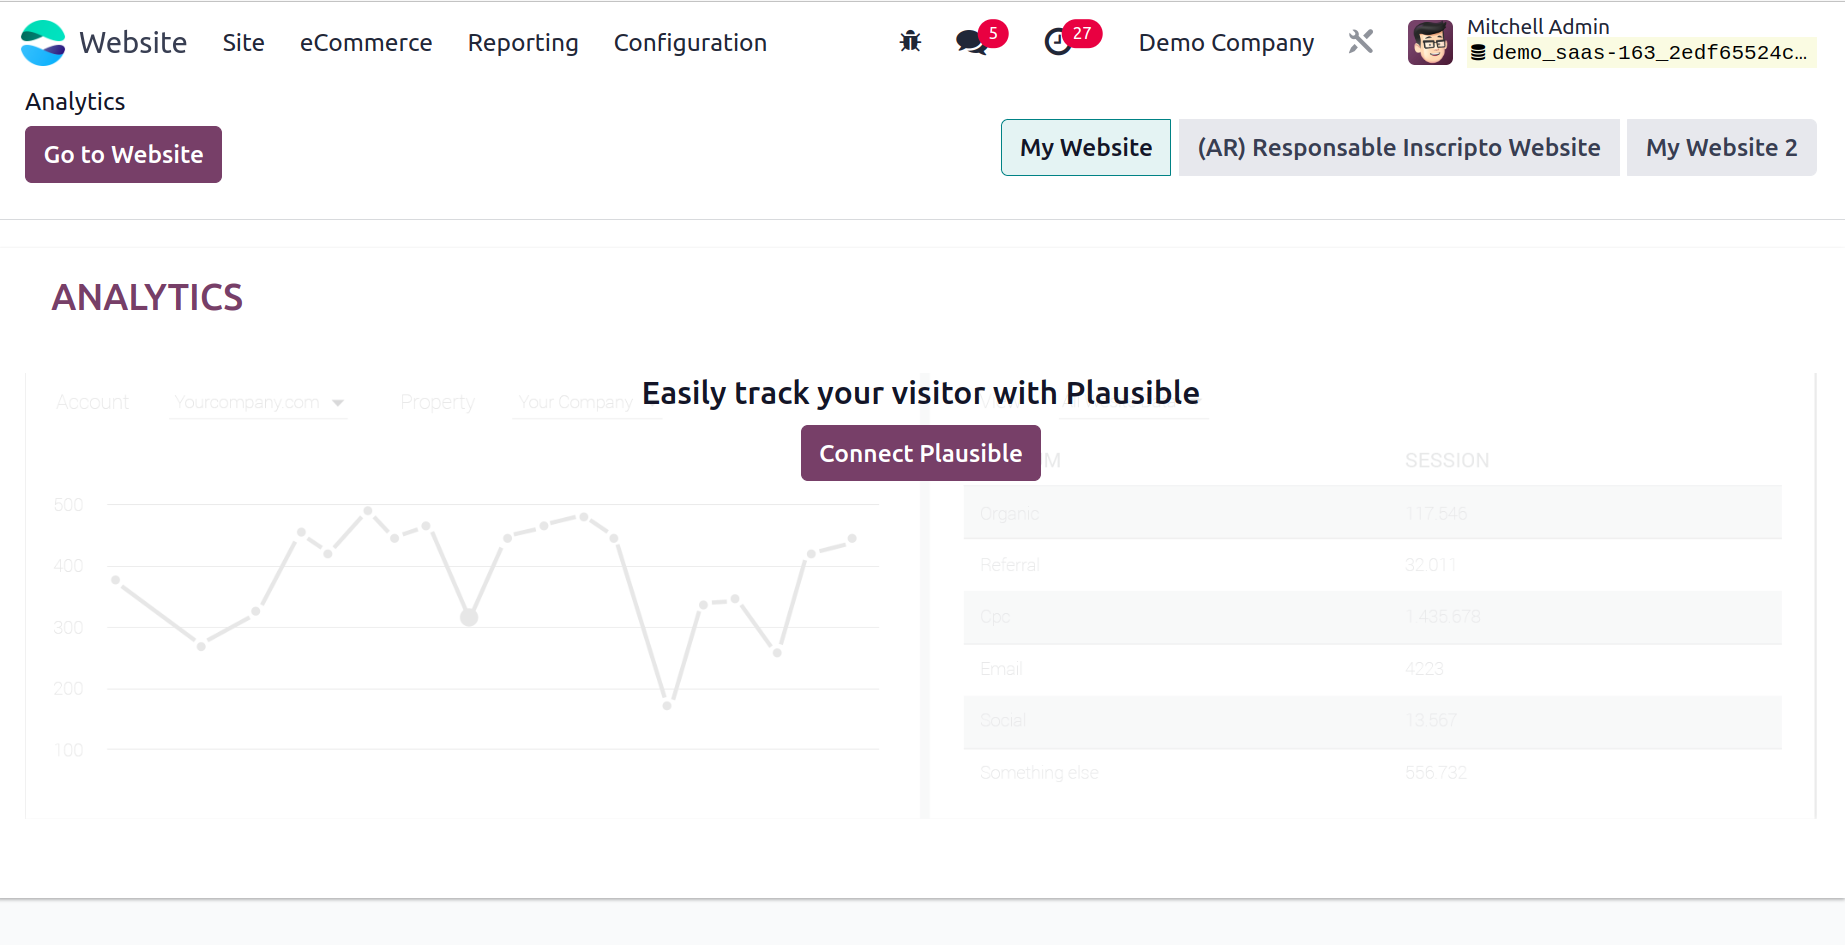
Additionally, you can see the option to link Google Analytics here. As indicated in the
image above, click the Connect To Plausible button.
All of the data pertaining to every website operation, including yearly, monthly, and
weekly reports, will be effectively displayed in the Google Analytics report window.
eCommerce
You will see the eCommerce Dashboard window of the Website module when you select the
Report option. Your web store's
actions and performances will be displayed in the eCommerce Dashboard window, as seen
below.
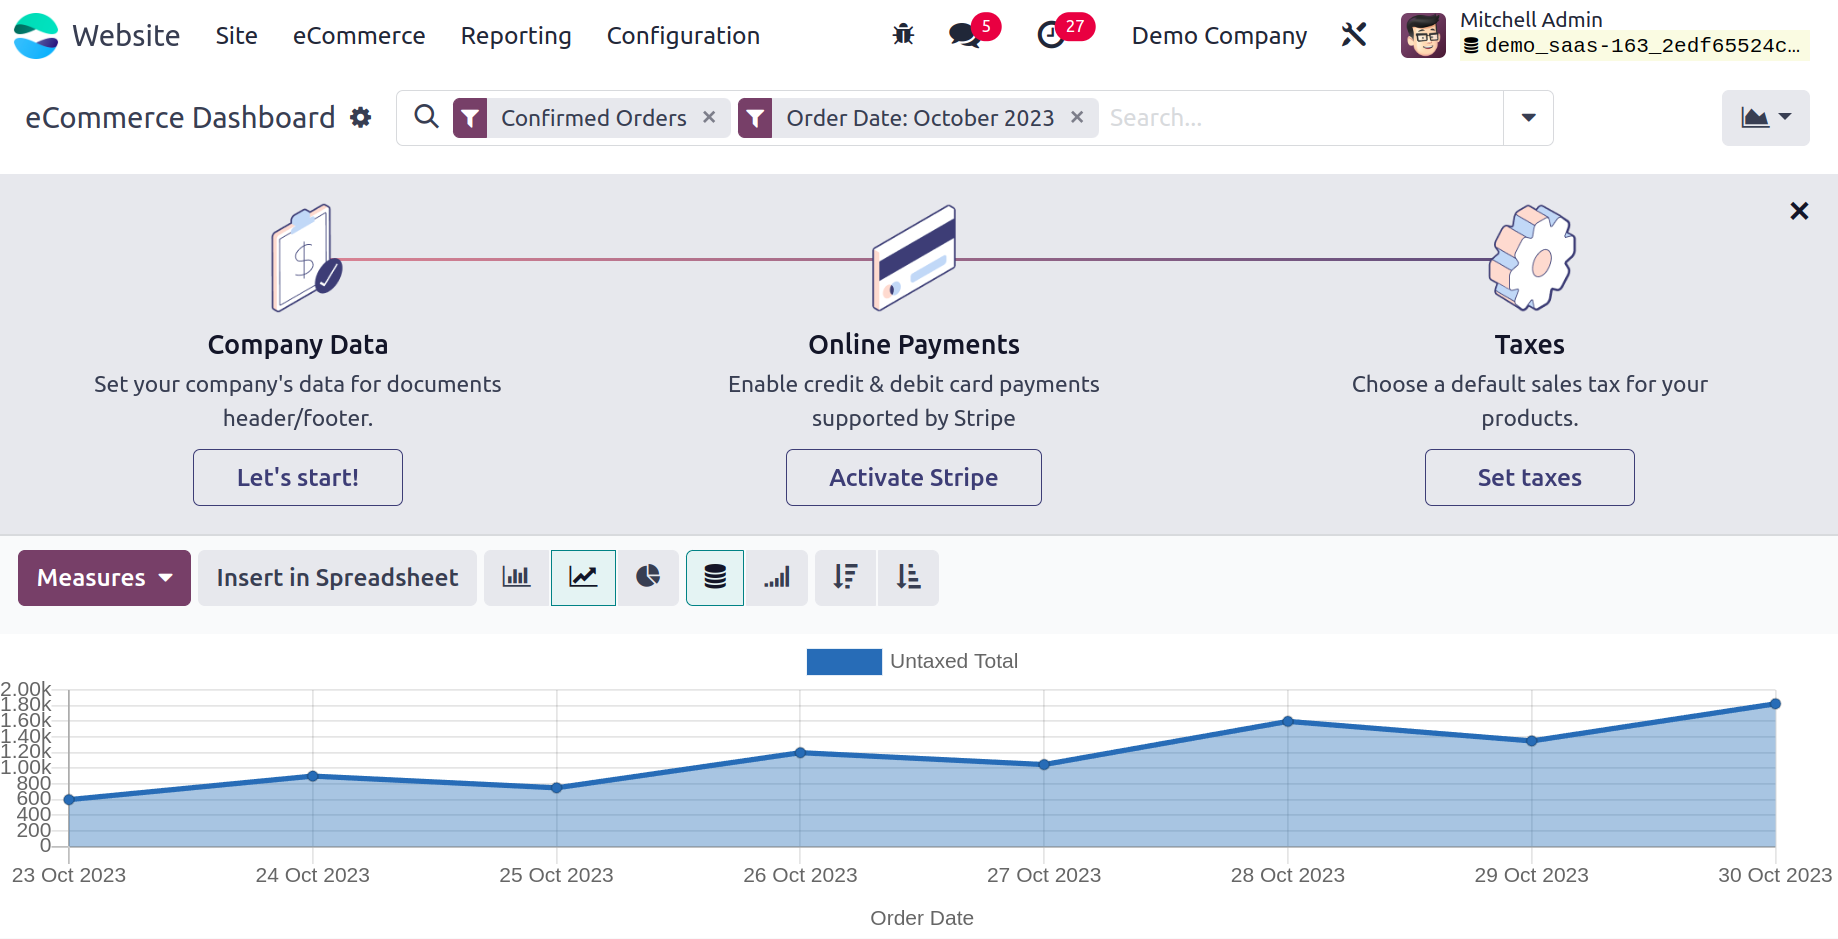
This dashboard view uses a variety of charts, graphs, pivot tables, and aggregated data
to give your eCommerce shop's performance a little extra push. It can be viewed as a
tool for analyzing reports, specifically for the purpose of visualizing the quantitative
and qualitative reports related to the promotion and sale of goods and services via the
internet platform. Compared to descriptive reports, it will be simpler to read reports
that are generated as graphs or charts. You may monitor the growth of your sales in this
window, along with all the reports related to your eCommerce business that you run on
our platform. There
are options to generate daily, weekly, monthly, and annual reports regarding the sales
activities conducted on the website.
Visitors
The Visitors option is located under
Reports in the Website module. The Visitors menu will provide all of the data on
visitors to your website, without any gaps.
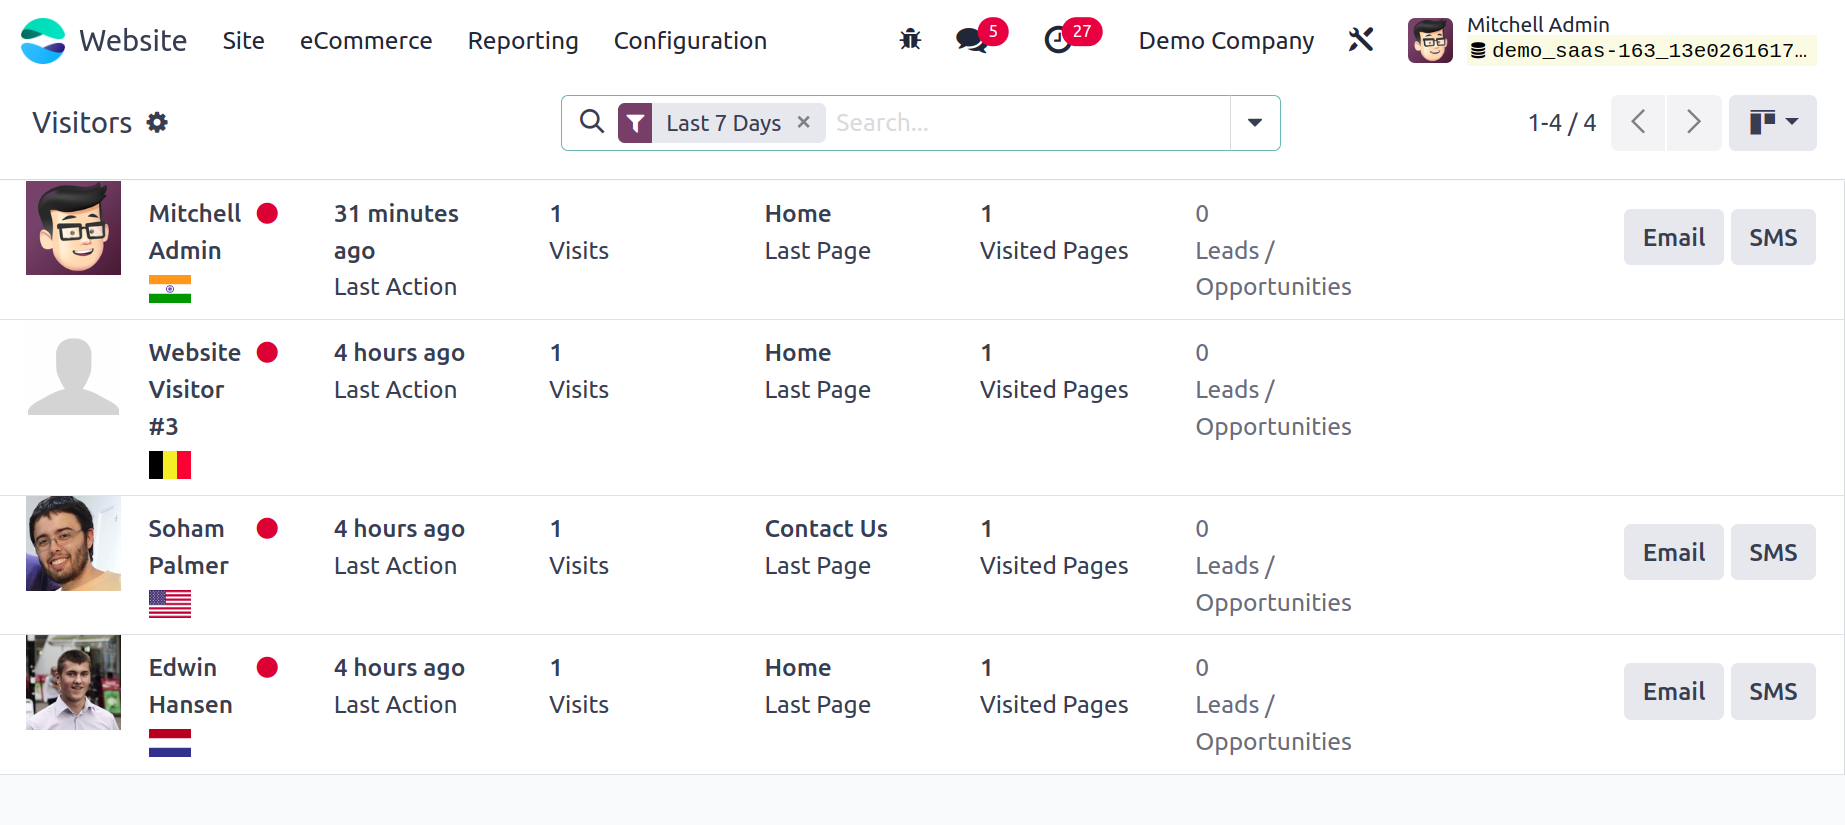
If this specific visitor's contact information is already stored in your system, the
Visitors pane will list their name. If not, it will be identified as a visitor to the
website. You will also be able to see clearly in this window the number of visits, the
last page viewed, the
amount of leads or chances provided by this visitor, and the chat option. Furthermore,
the platform offers visitors the ability to send emails and SMS in the event that the
contact data of that specific employee is obtained. You can click the SMS and EMAIL
button next to the other information to accomplish this.
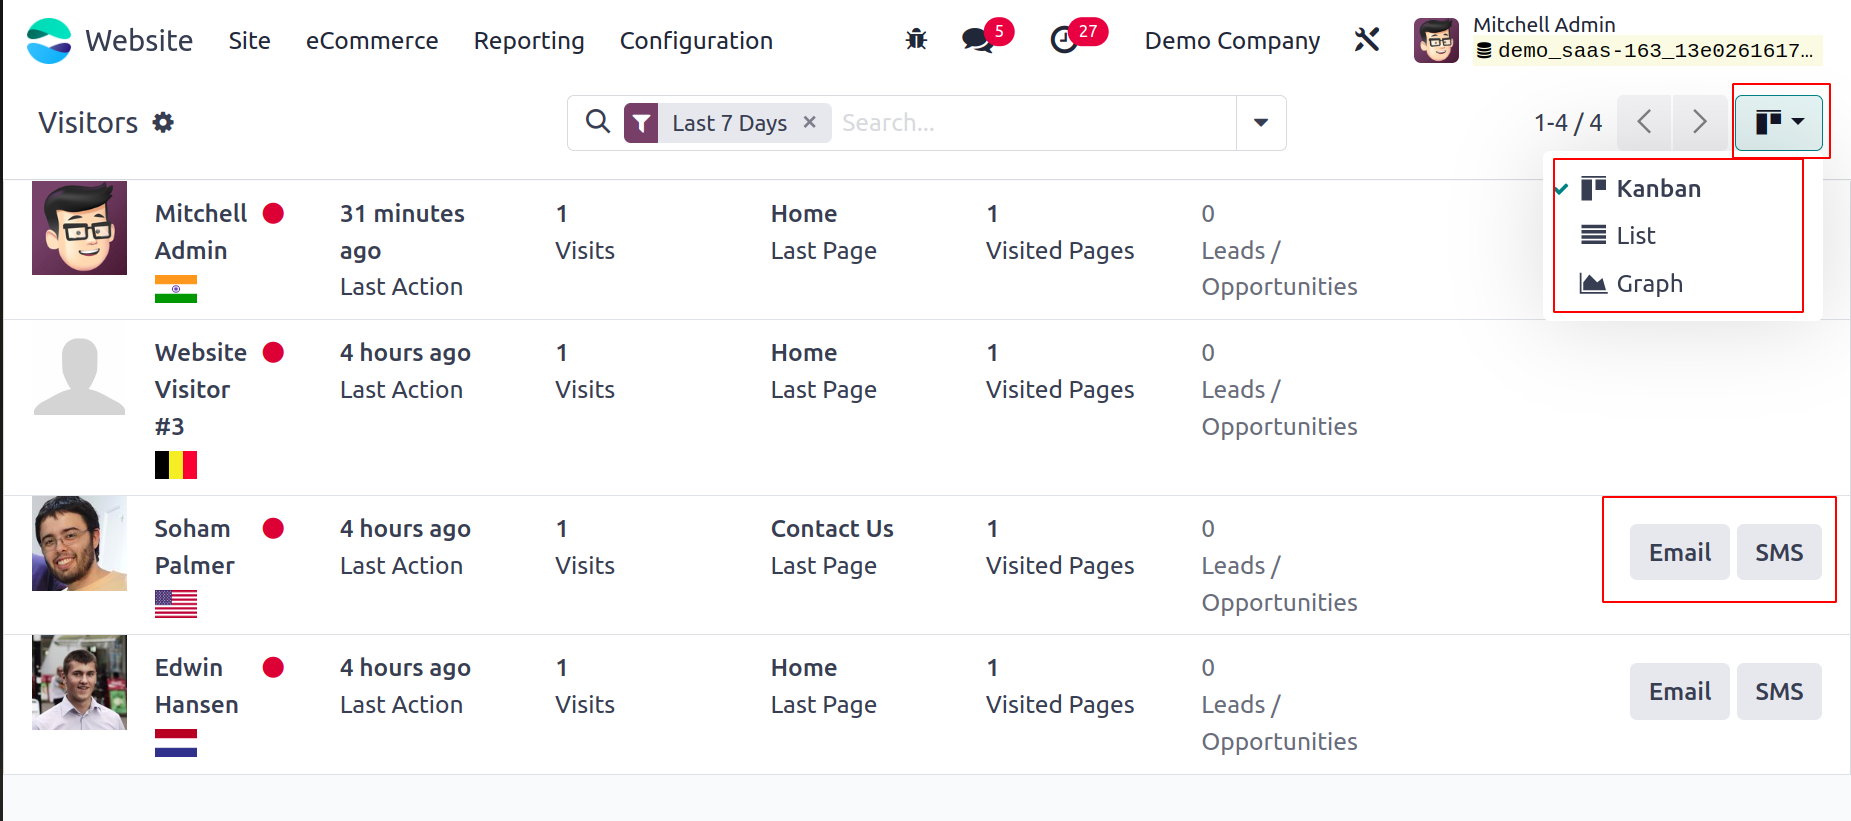
The system lets you view the details in List and Graph views in addition to the Kanban
view. As seen in the screenshot above, the menu icons for switching views are located in
the upper left corner of the window. Additionally, you have access to a number of
configurable and default filters as well as categorization choices under the Filters and
Group By page. Last 7 Days, Unregistered, Leads, Contacts, Connected, Available, In
Conversation, Push Notification On, Push Notification Off, and Archived are the basic
filters that are available in the pane. The standard categorizing options, like Country,
Time zone, Language, Visits, Website, First Connection, and Last Connection, are
available under the Group By tab.
Let's take a look at the Page Views menu as we navigate through the Visitors menu found
under the Reports tab.
Page Views
You may list every page view on your website using the Page Views option found in the
Reports tab. You may see the Visitor, Page, URL, and Visit Date details when you glance
at the window. The List and
Graph views are the two ways to access this window. The Page Views window's List view is
seen in the picture below.
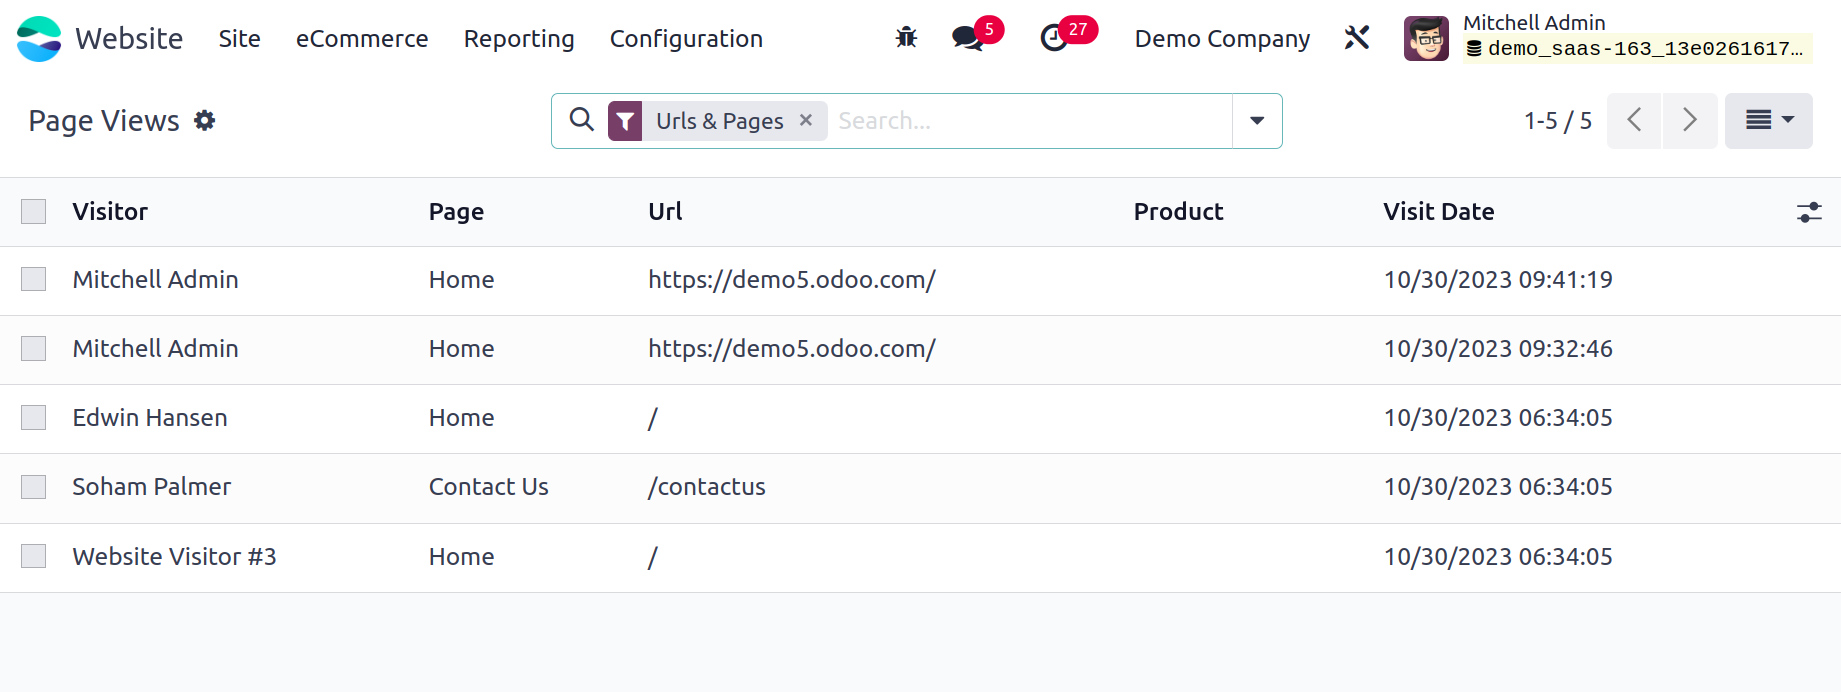
Additionally, you can use several filters and group by options here to sort and
categorize the data according to multiple criteria. The available default filters are
Pages, Url & Pages, and Products. Additionally, you can use several categories, like
Visitor, Page, Url, Product, and Visit Date, to organize the data.