Reporting
You will profit from regularly reviewing sales operations because it
will help you to rapidly comprehend your workflow. Having a thorough
understanding of the sales management operations carried out in your
company will be made possible with the help of an efficient sales
reporting system. You may quickly generate reports on sales with the
help of the Odoo 17 ERP system.
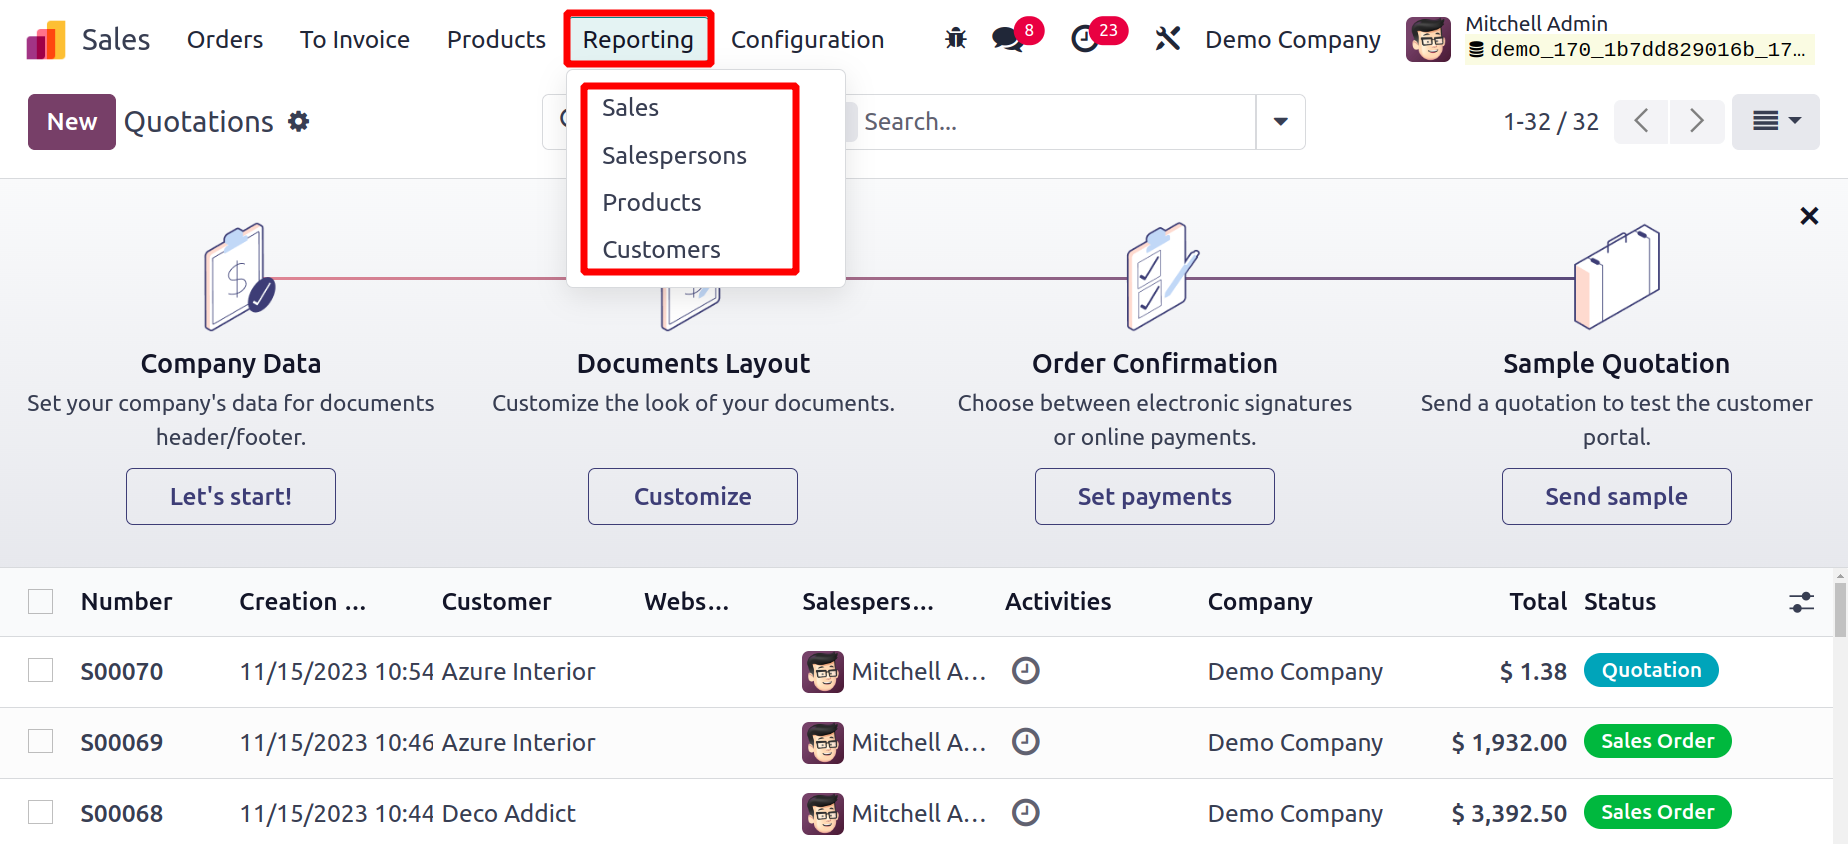
This report can be used to assess current sales performance and
identify areas in need of development.
Sales Analysis
You may access the Sales Analysis window by selecting Reporting from the Sales module's
main menu. You will receive the analysis report in pivot tables and graphical format.
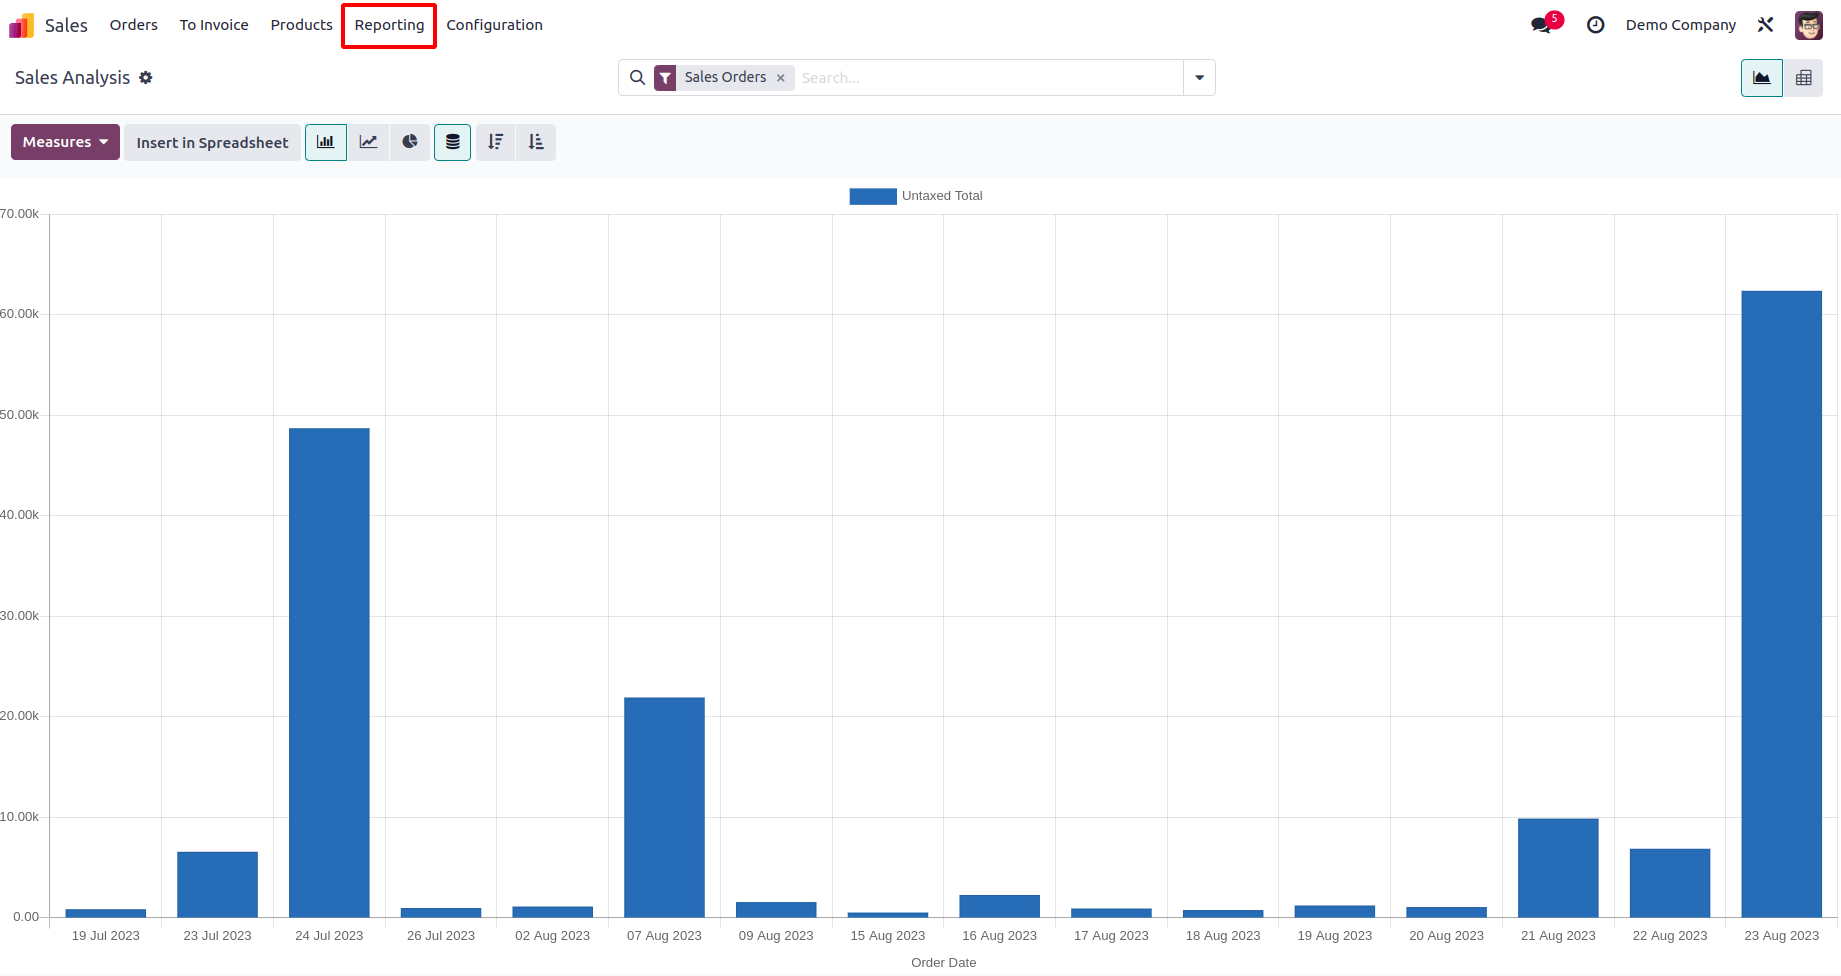
The bar chart of the sales report based on the order date is depicted in the screenshot
up top. You can arrange the bars in either ascending or descending order as you see fit.
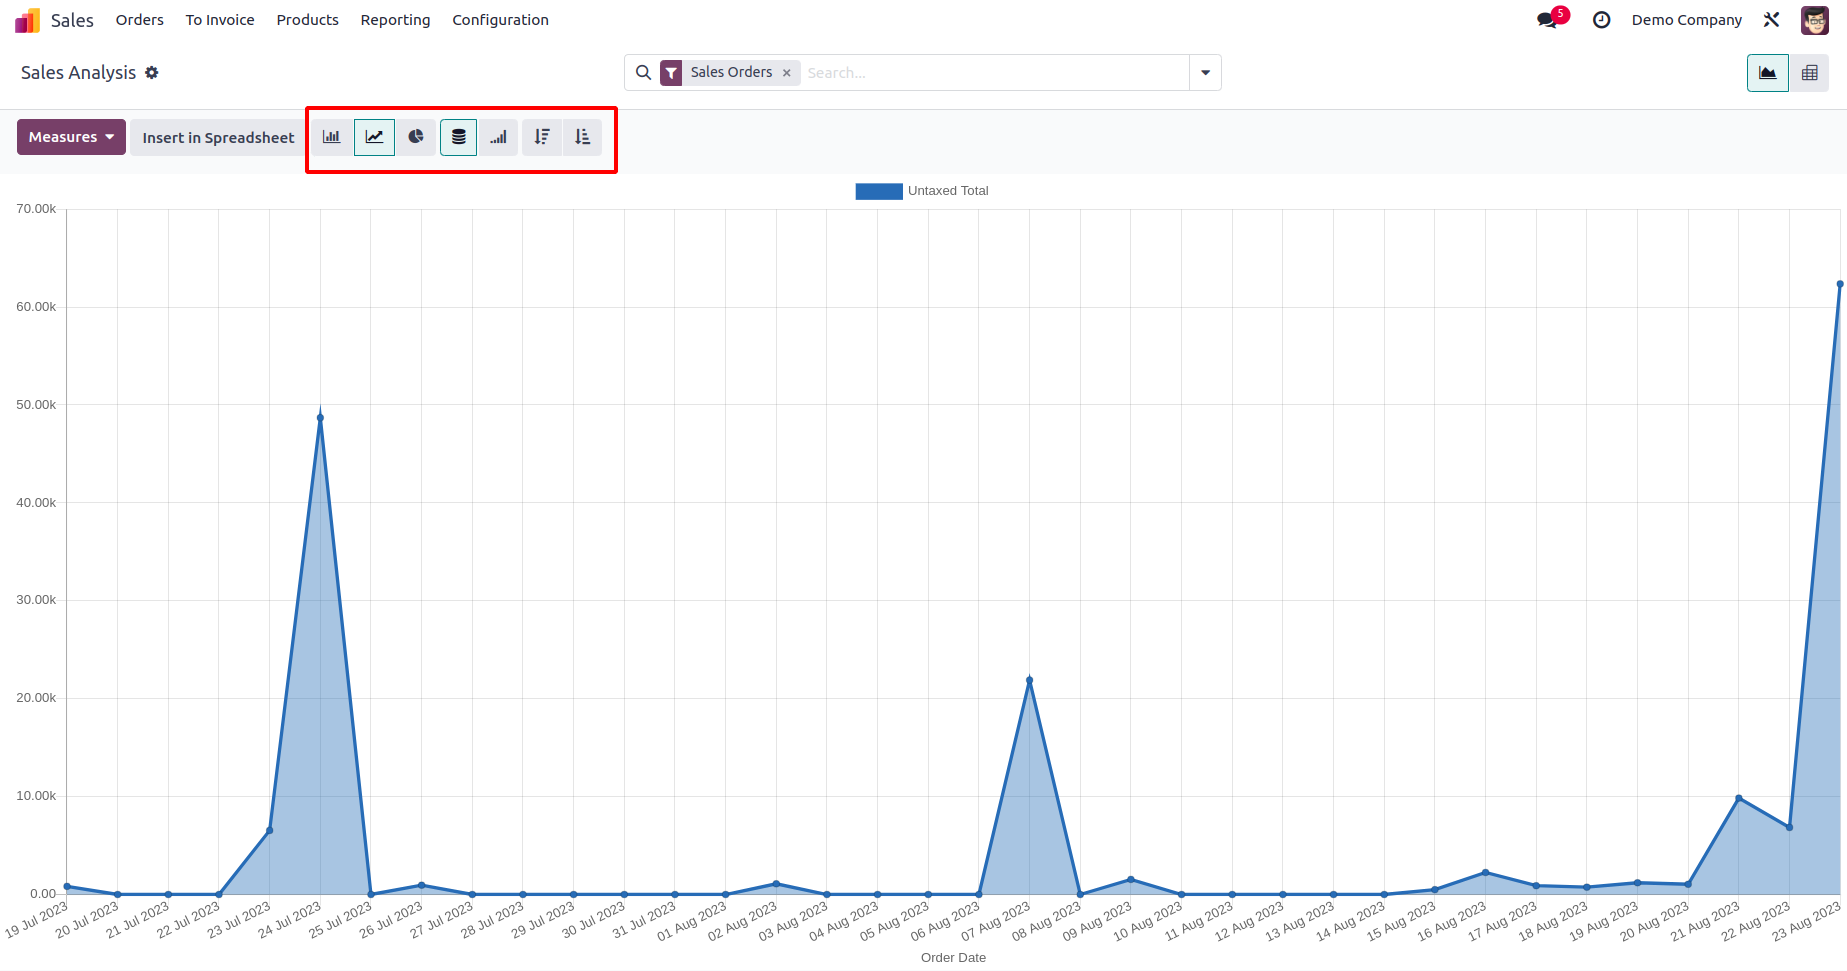
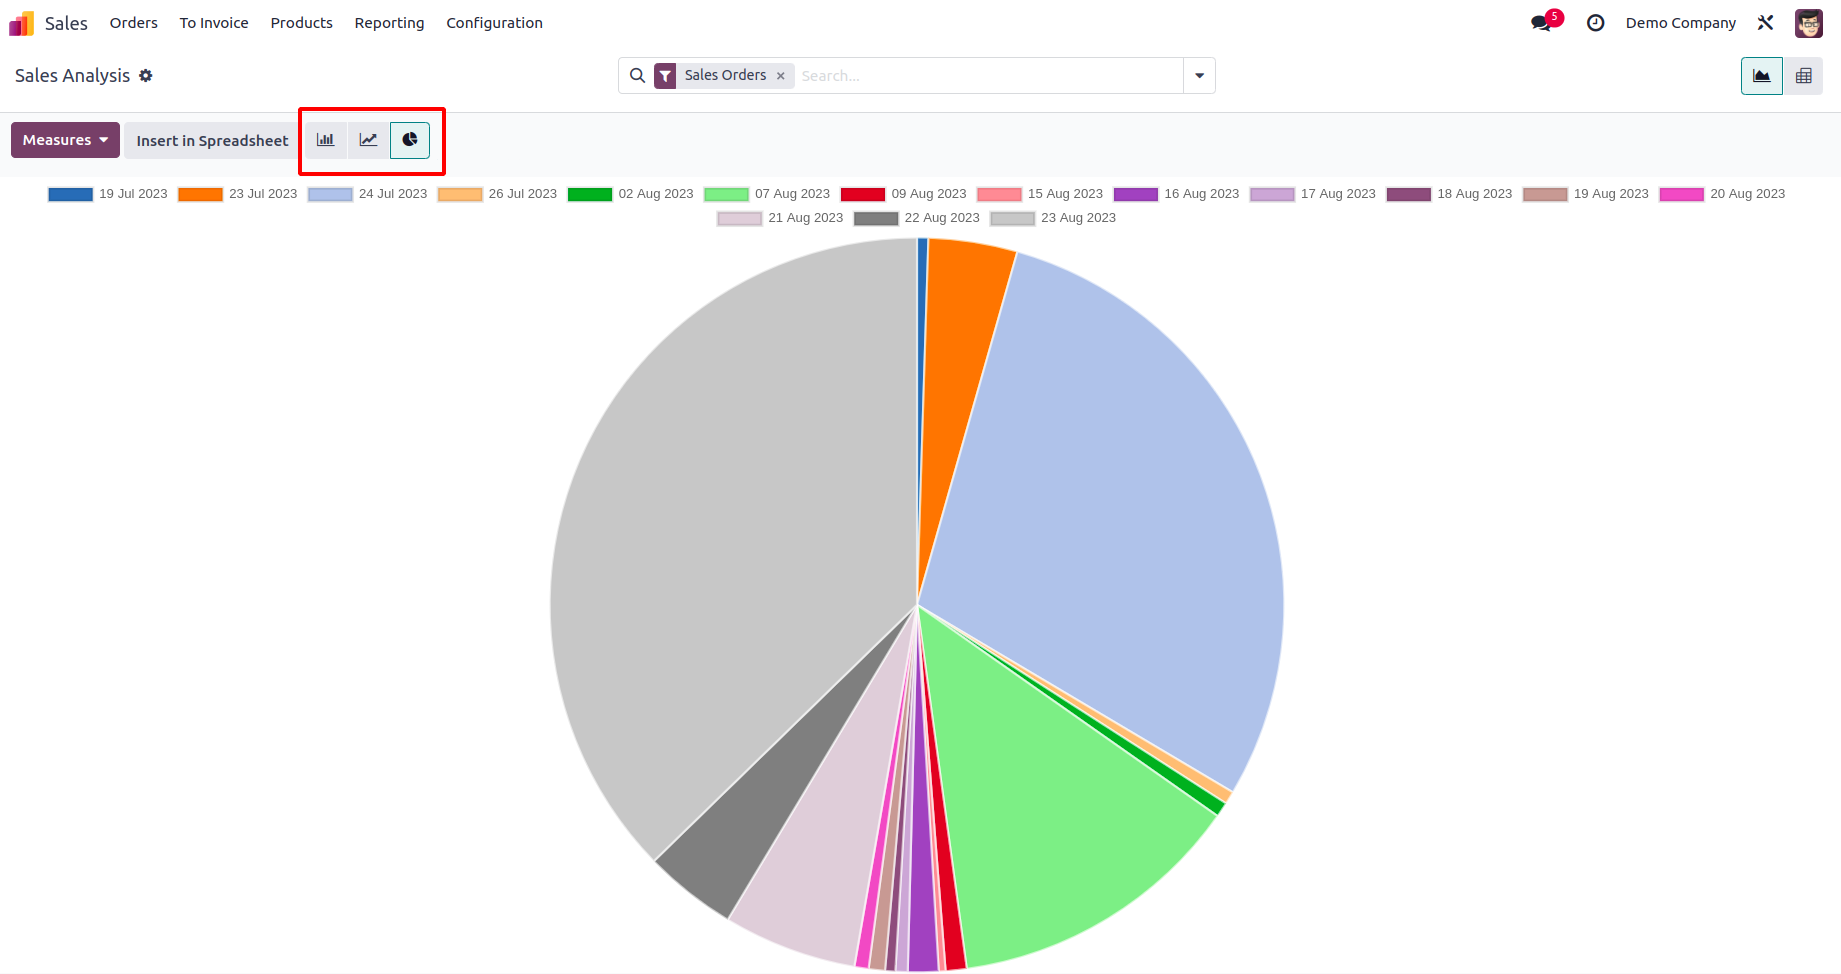
As seen in the screenshots below, the report can also be seen in a Line Chart and a Pie
Chart.
Line Chart
Pie Chart
By changing the Measures, you can produce the necessary sales reports.
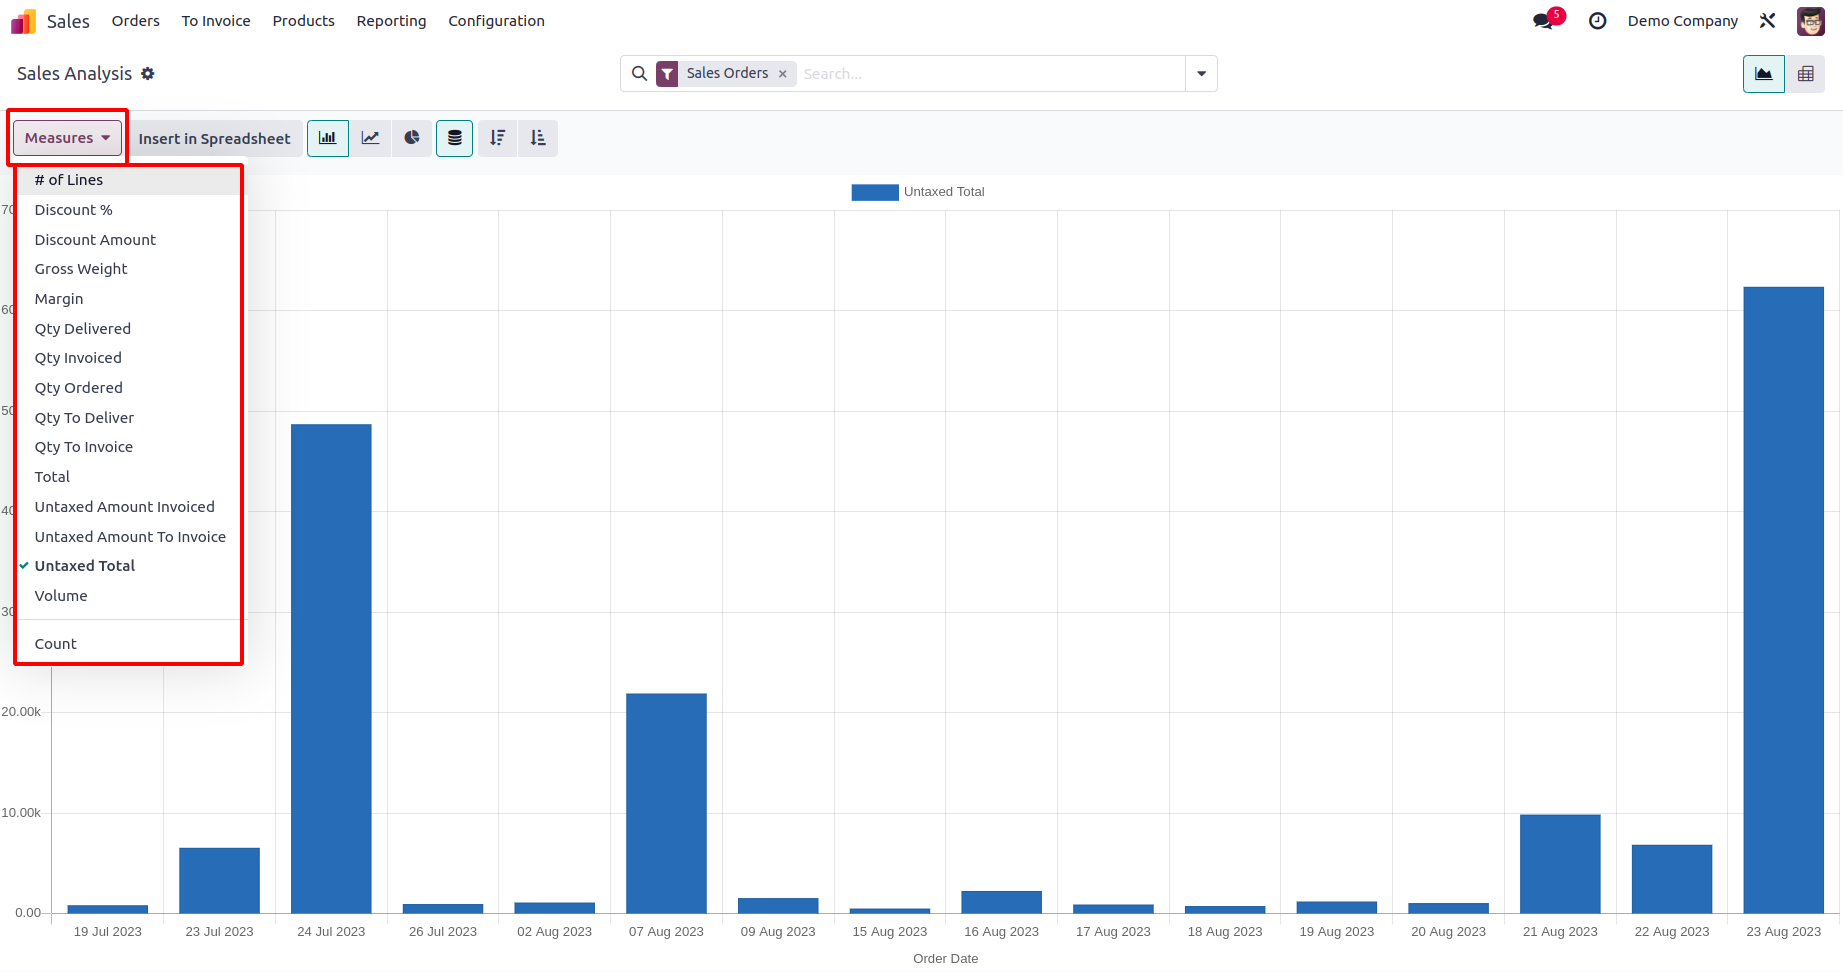
You can create sales reports for Discount%, Discount Amount, Gross Weight, Quantity
Delivered, Quantity Invoiced, Quantity Ordered, Quantity to Deliver, Quantity to
Invoice, Total, Untaxed Amount Invoiced, Untaxed Amount To Invoice, Untaxed Total,
Volume, and Count using the measures that are accessible.
You can produce reports using the Filters that are based on Sales Orders, Quotations, and
Order Dates. Using Odoo 17 makes it simple to create customized reports. Using the apply
Custom Filters button, you can apply custom filters to reports to achieve this.
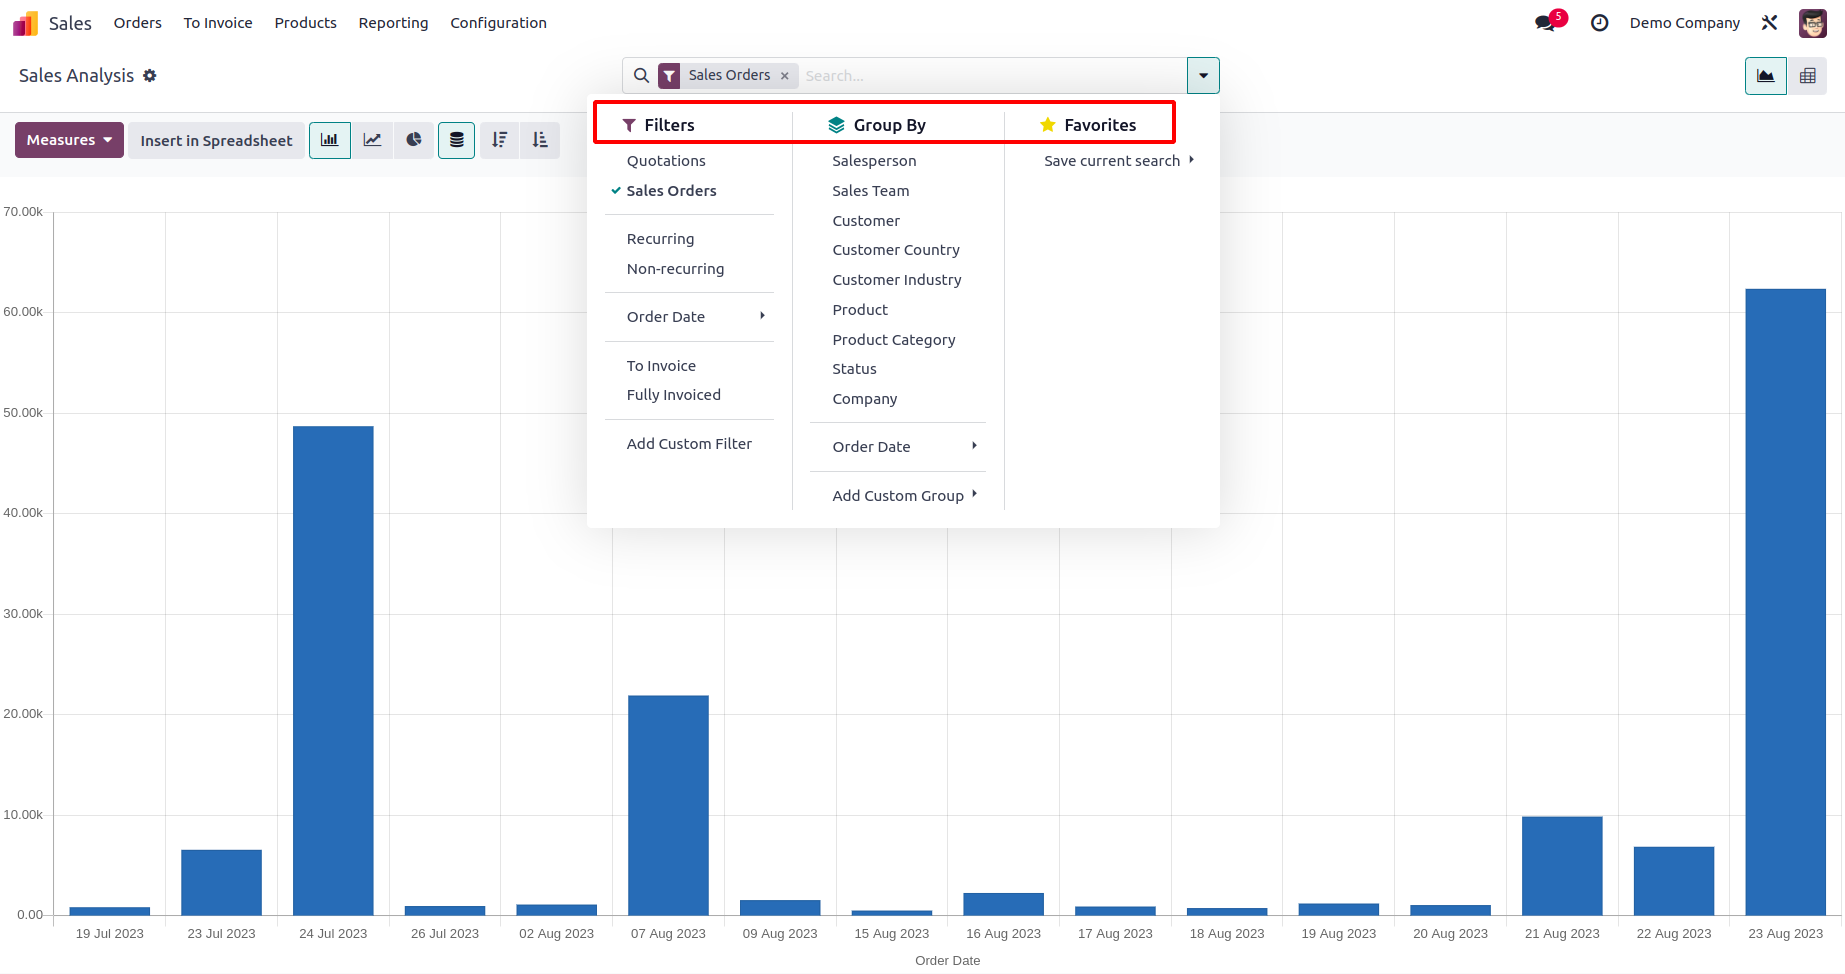
The report's default groupings include Salesperson, Sales Team, Customer, Customer
Country, Customer Industry, Product, Product Category, Status, Company, and Order Date.
Using the Add Custom Group button, you can design unique grouping options.
The Pivot view includes the Measures, Filters, and Group By choices as well.
You can expand the pivot table's grouping choices by selecting the plus icon. The Flip
Axis button can be used to flip the table's axis.
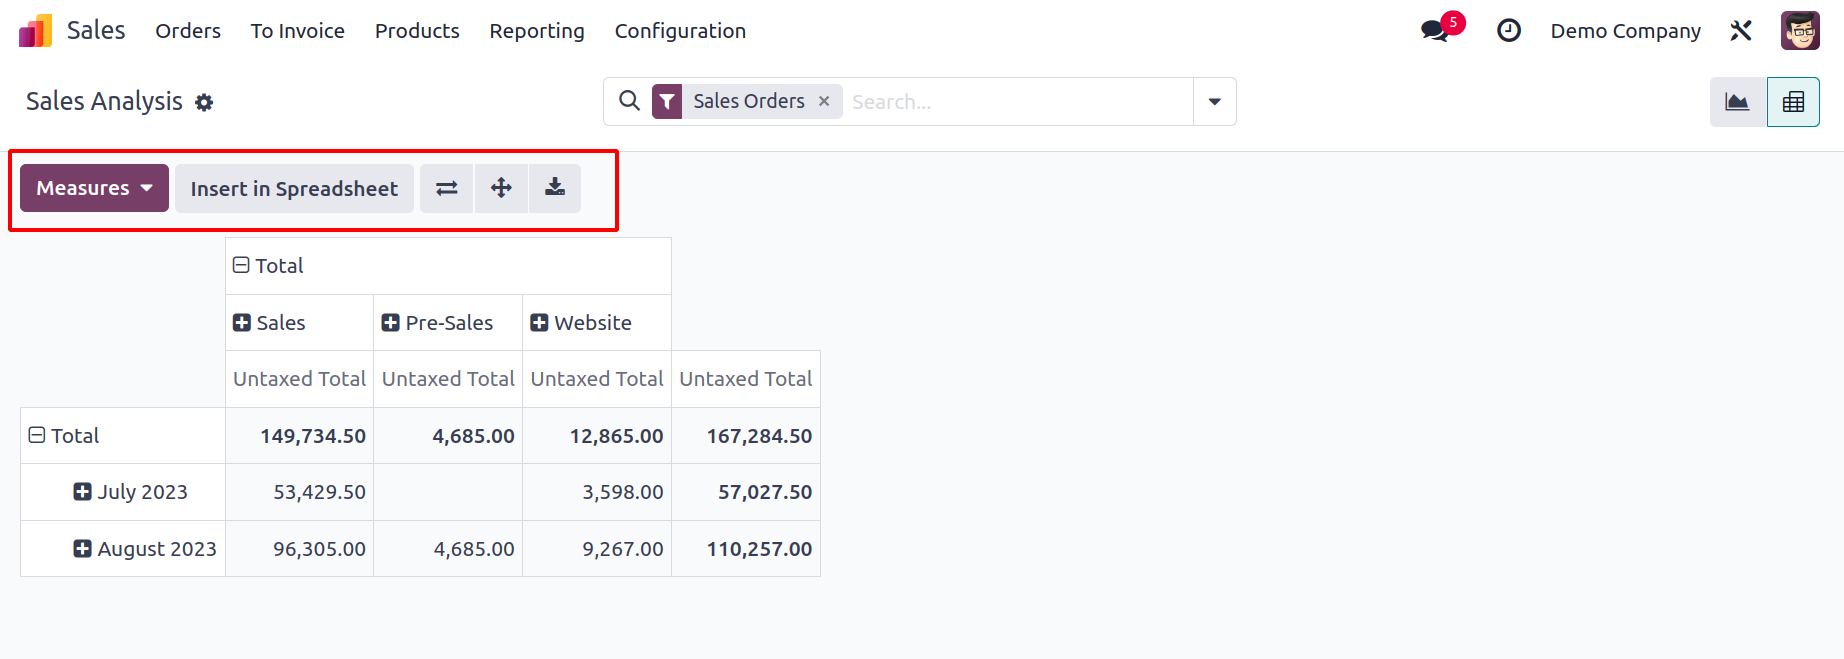
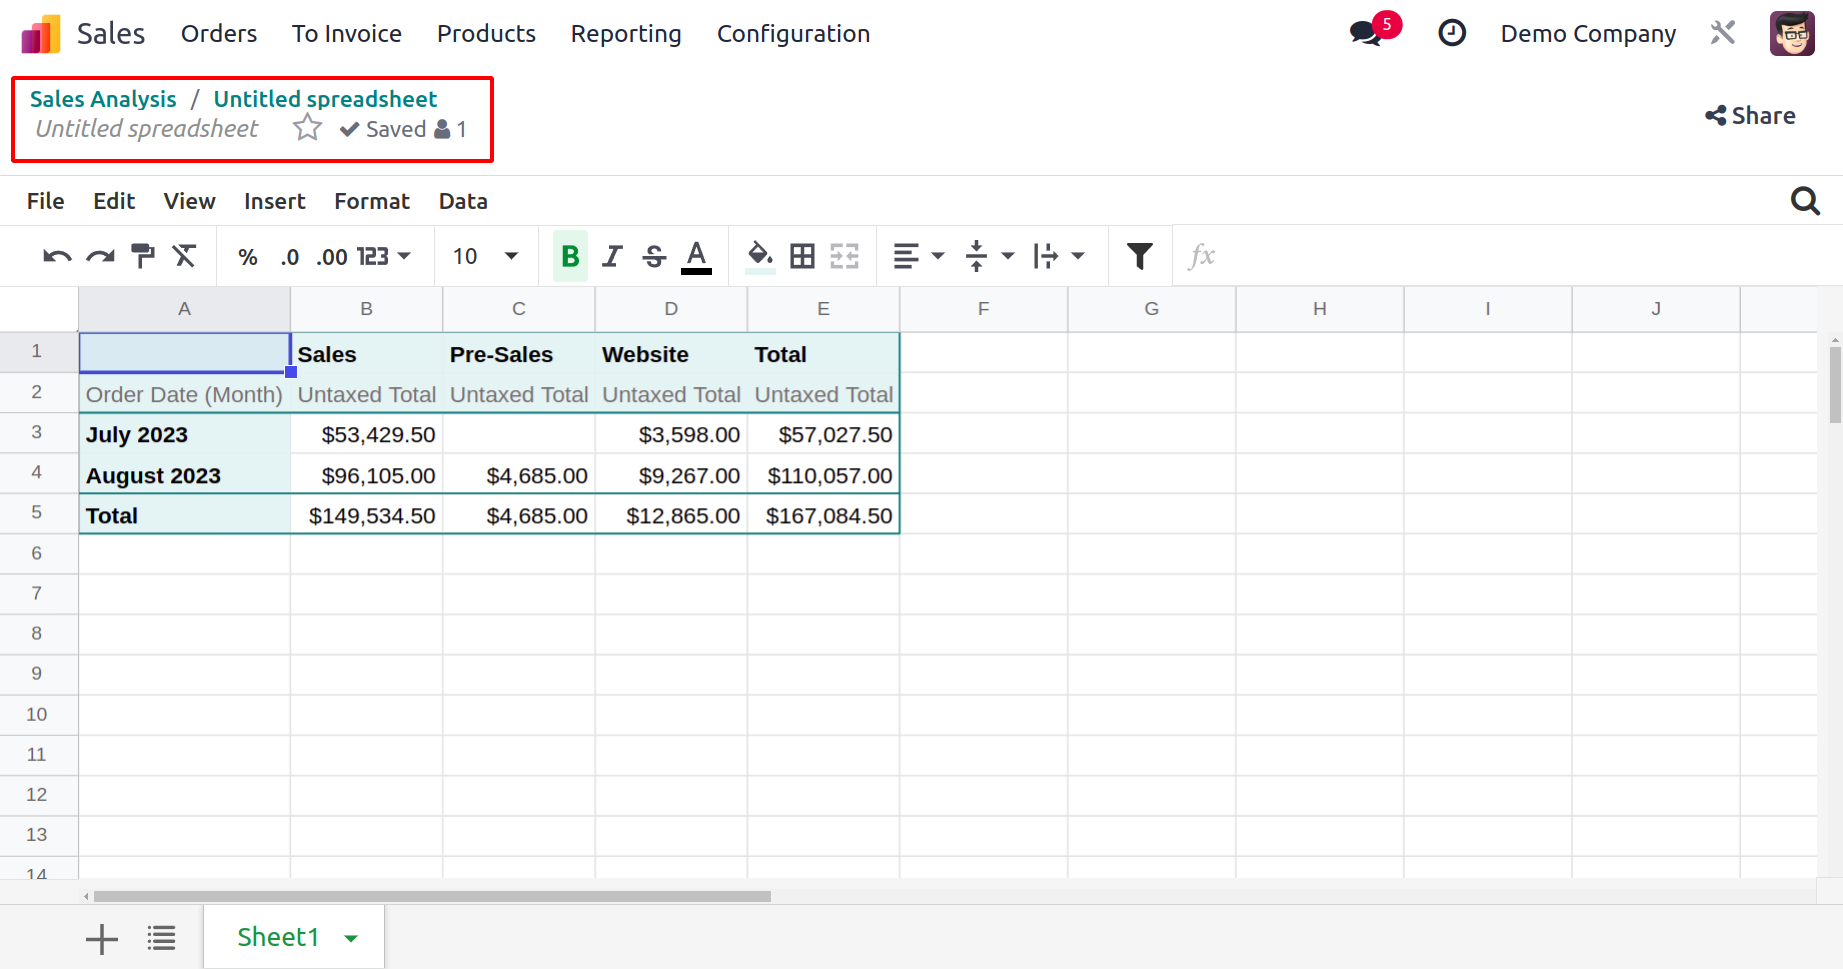
Using the Insert in Spreadsheet button, the accessible data can be transferred into a
spreadsheet. As seen in the image below, a pop-up will appear where you can choose the
spreadsheet. Once you've determined which spreadsheet will work best for your sales
report, click the Confirm button.
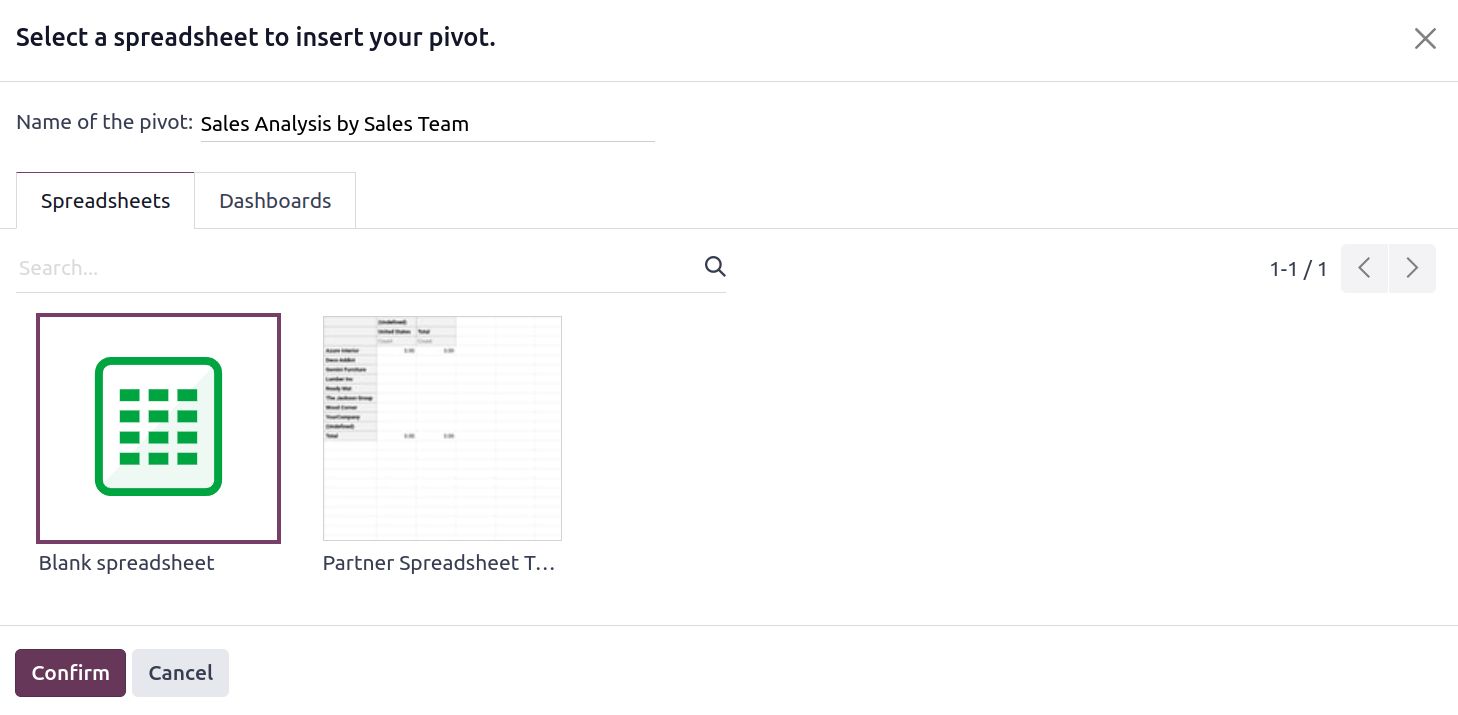
The spreadsheet will be stored in your database as a document.
Sales analysis by Sales Person
Any salesperson may conduct a sales analysis by choosing the Sales Person report, which
is the second report in the Reports section. As previously stated, a variety of graphs
are accessible, including bar charts, line charts, pie charts, and more. The Measures
option lets you filter the information.
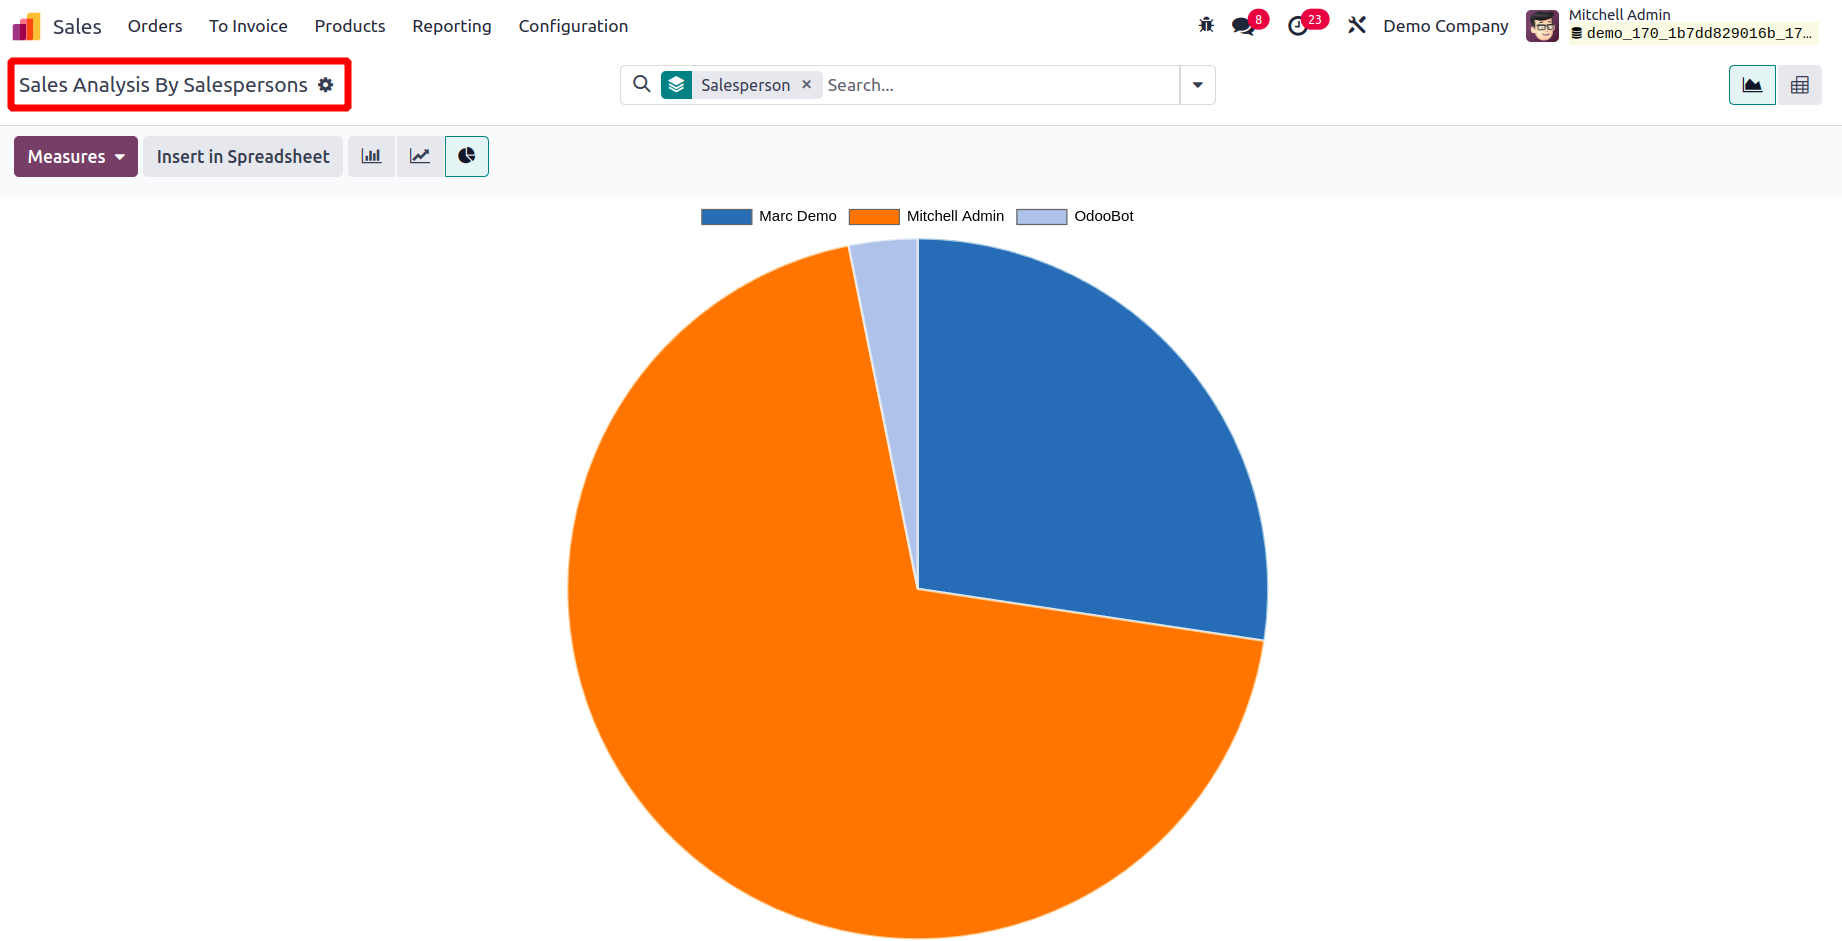
From there, the pivot view of the sales analysis by salesperson report is also obtained.
Sales analysis by Product
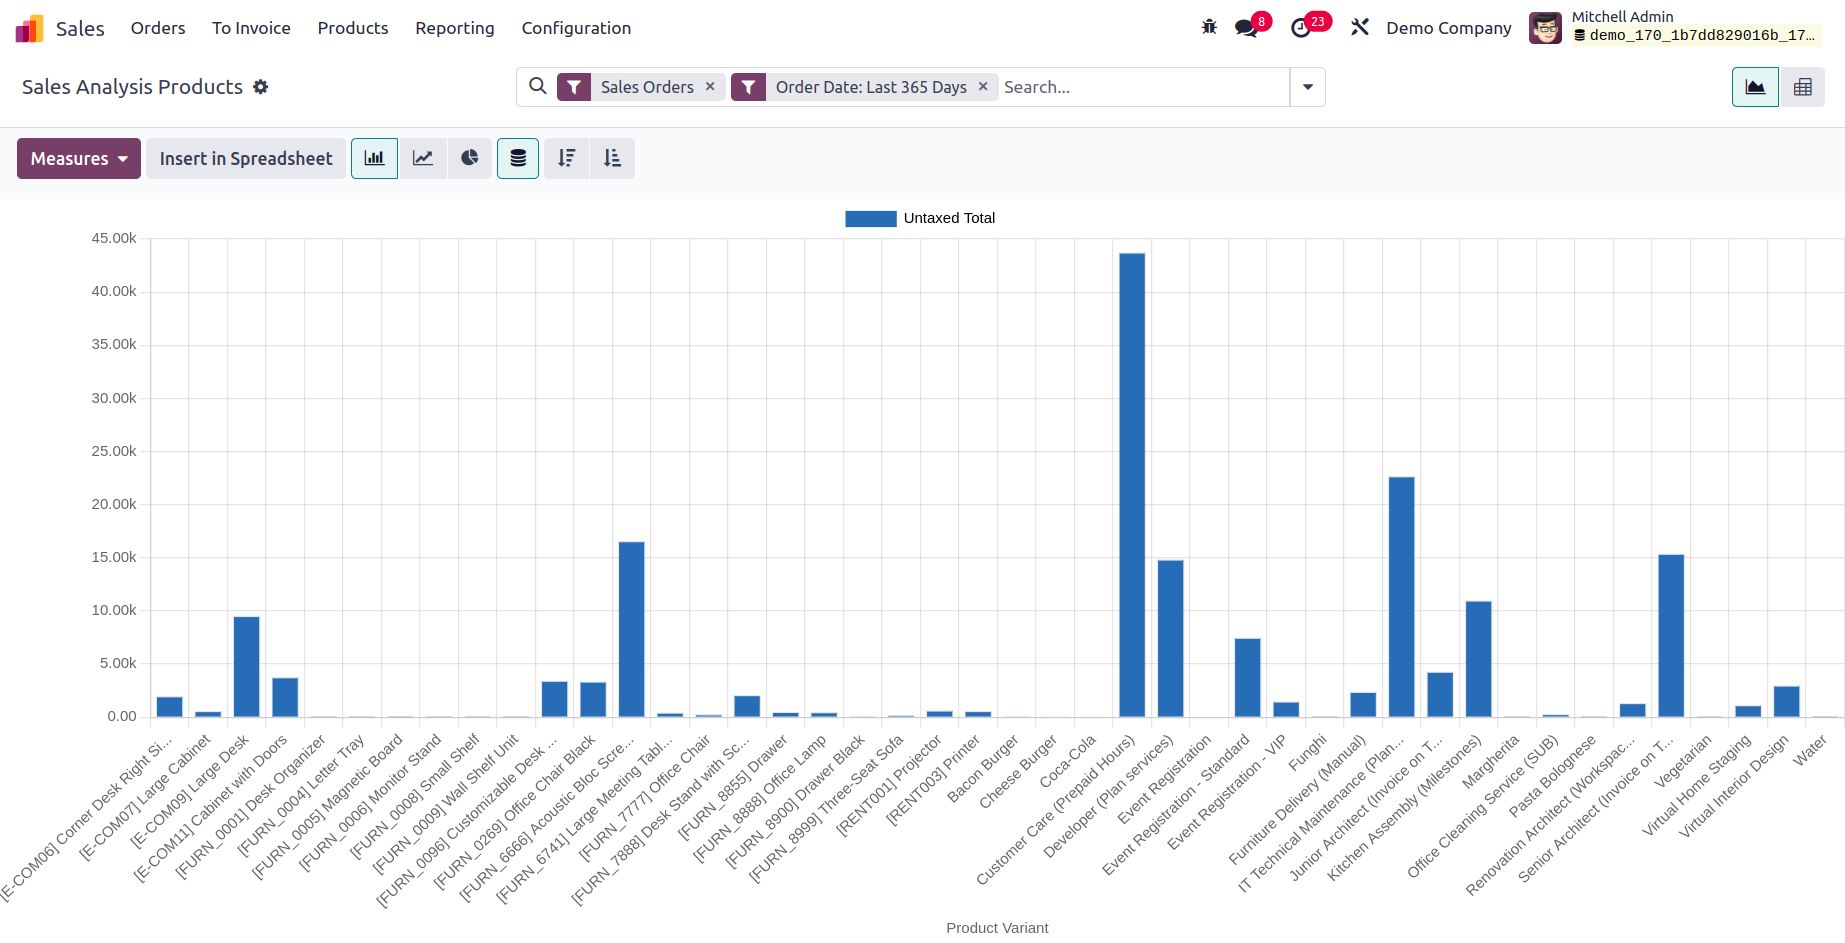
Sales analysis by Product is the second new report introduced on Odoo 17, which is
available under Reporting. Through this reporting the users can easily understand the
sales details of products. Every single product selling details are included in this
report as shown below.
Sales analysis by Customer
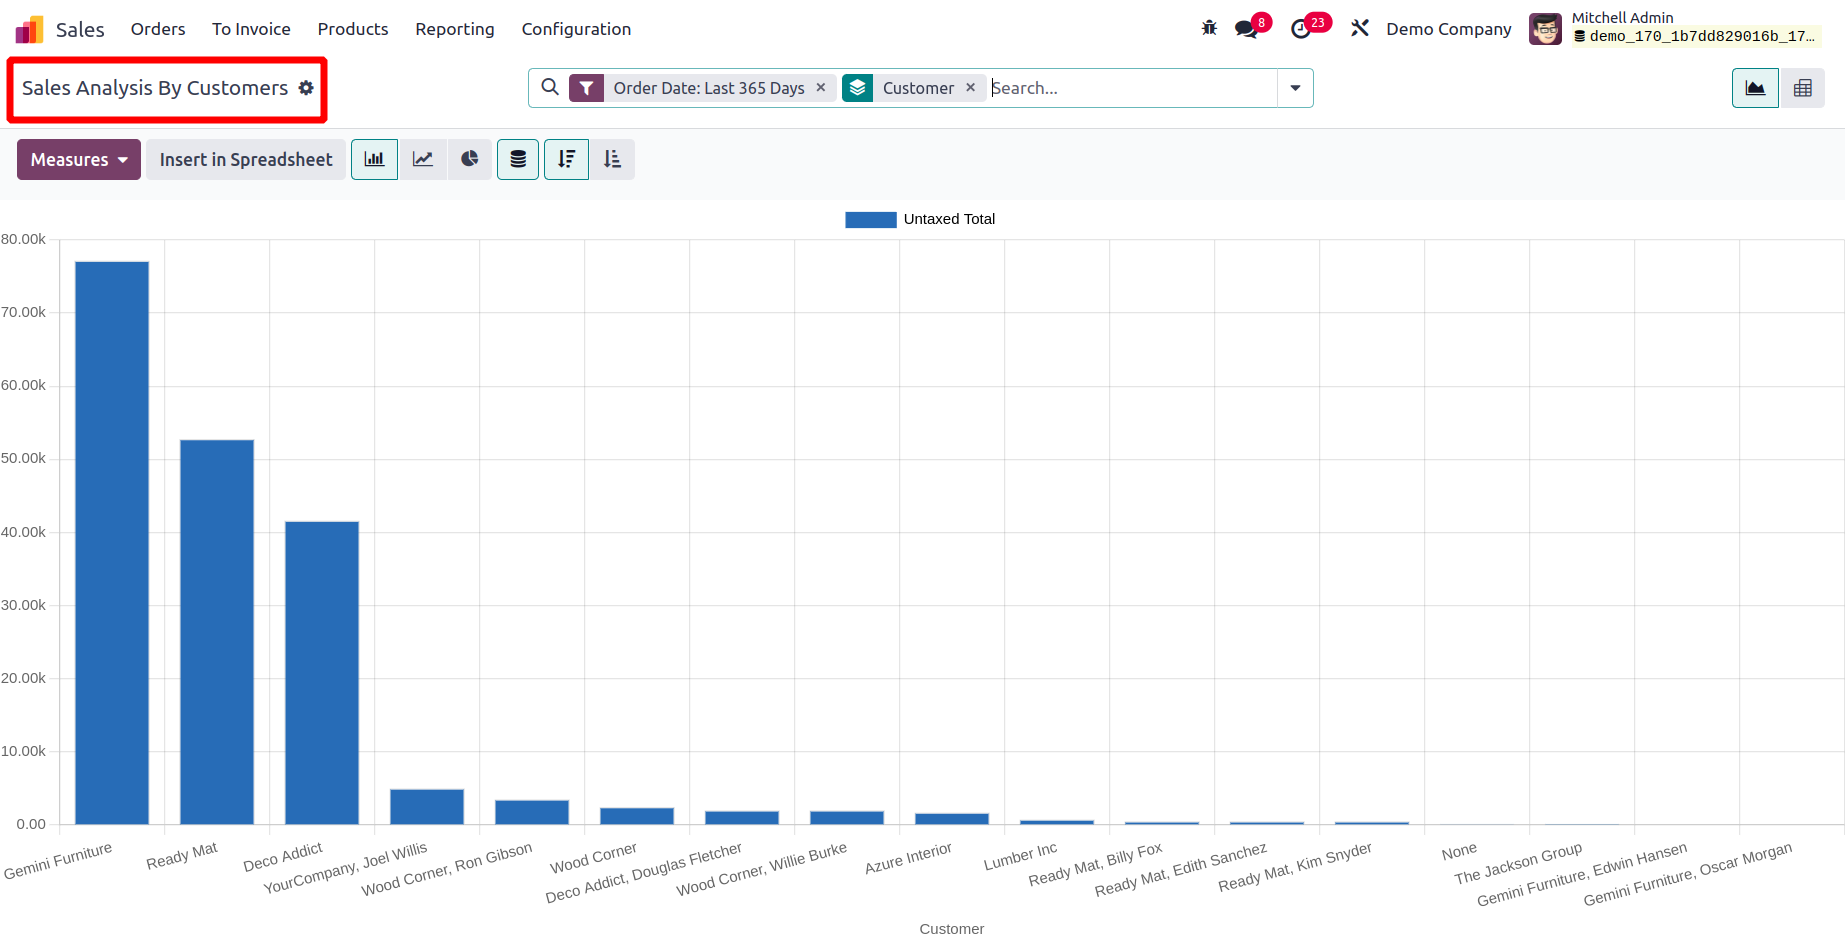
In Odoo 17, the third new reporting feature is Sales analysis by Customer. As previously
said, this sales analysis by customers can provide sales reports that are based on
customers. The report displays the total sales as well as each customer.
The best solution for managing all of your company's sales procedures is the Odoo 17
Sales module. By providing cutting-edge tools as solutions for sales management
operations it will assure accuracy at every step and improve your sales success.