Odoo 17 offers several reporting tools for each module based on the actions that have
been logged. Reports for Quality Checks and Quality Alerts are displayed by the Odoo 17
Quality module's reporting capability.

Quality Checks
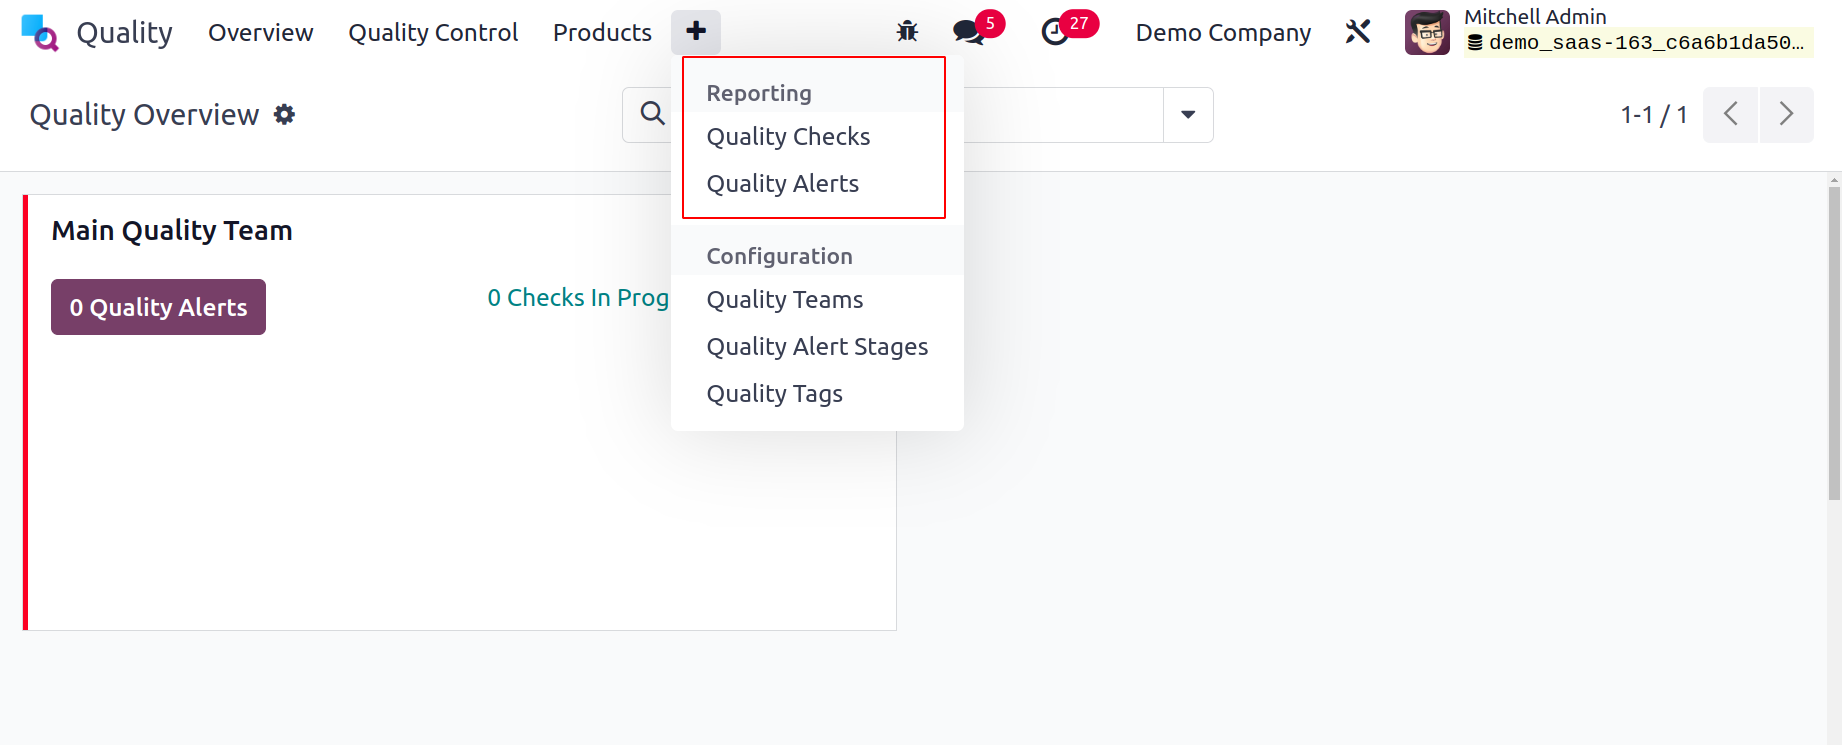
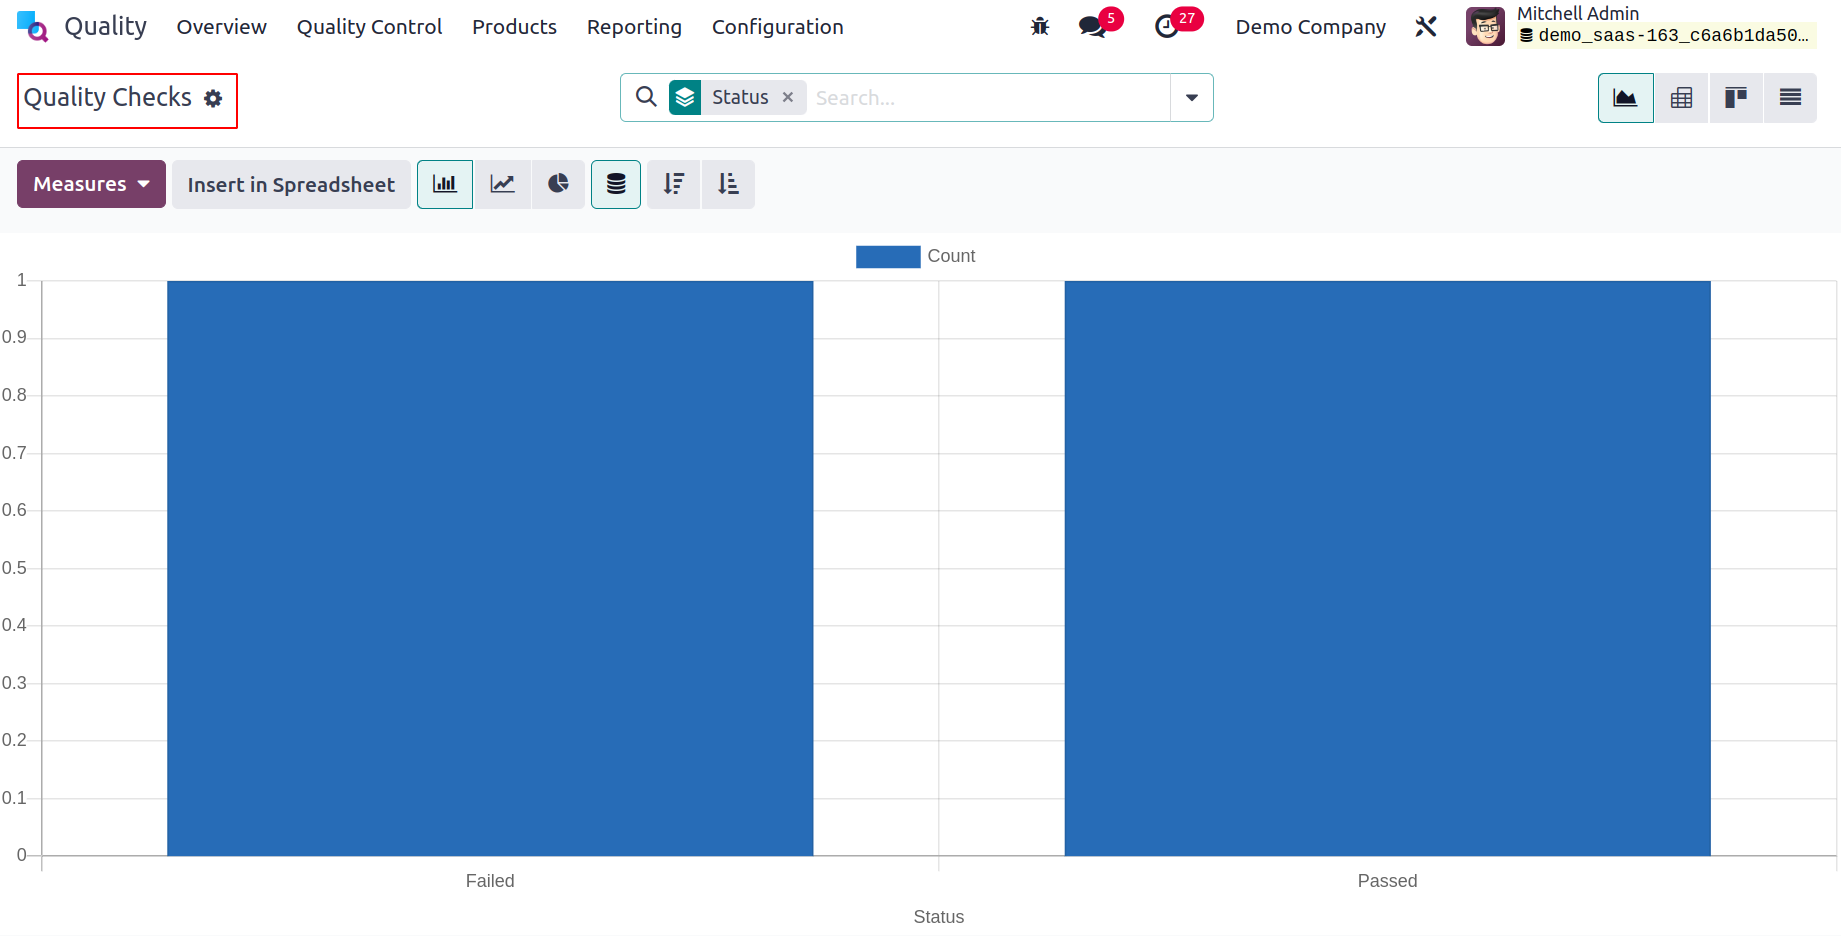
Select Quality Checks from the Reporting menu to open a new window with a graphical
depiction of the quality check status. The X-axis in the graph view shows the Status
data, and the Y-axis shows the Count. Users can analyze quality checks by applying
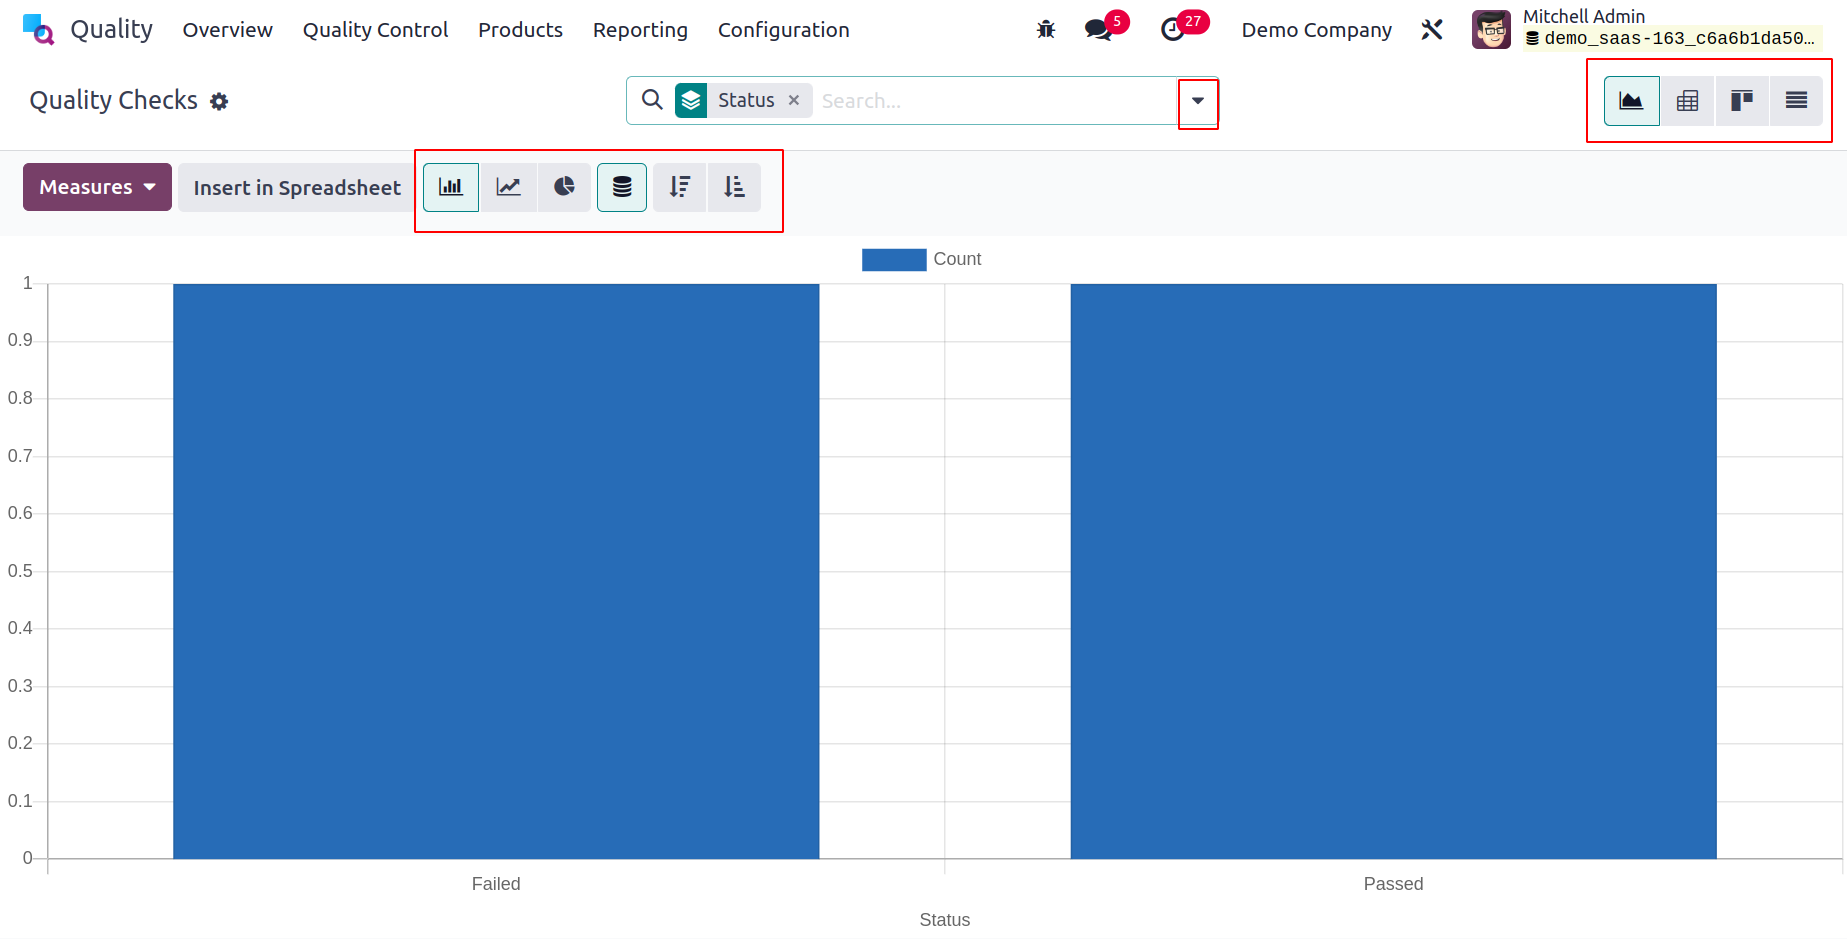
various measurements to graphical representations.
We can use values like Done, Measure, Finished Product Sequence Number, and Quantity
Tested by choosing the Measures icon.

According to their status, these quality checks are organized here. Add Custom Group,
Control Point, Team, Finished Lot/Serial, and other criteria can also be used to group
quality tests.
You can add these data to the graph by selecting the Group menu.

The graph is also available in line, pie, and bar chart styles. Select the Quality Alerts
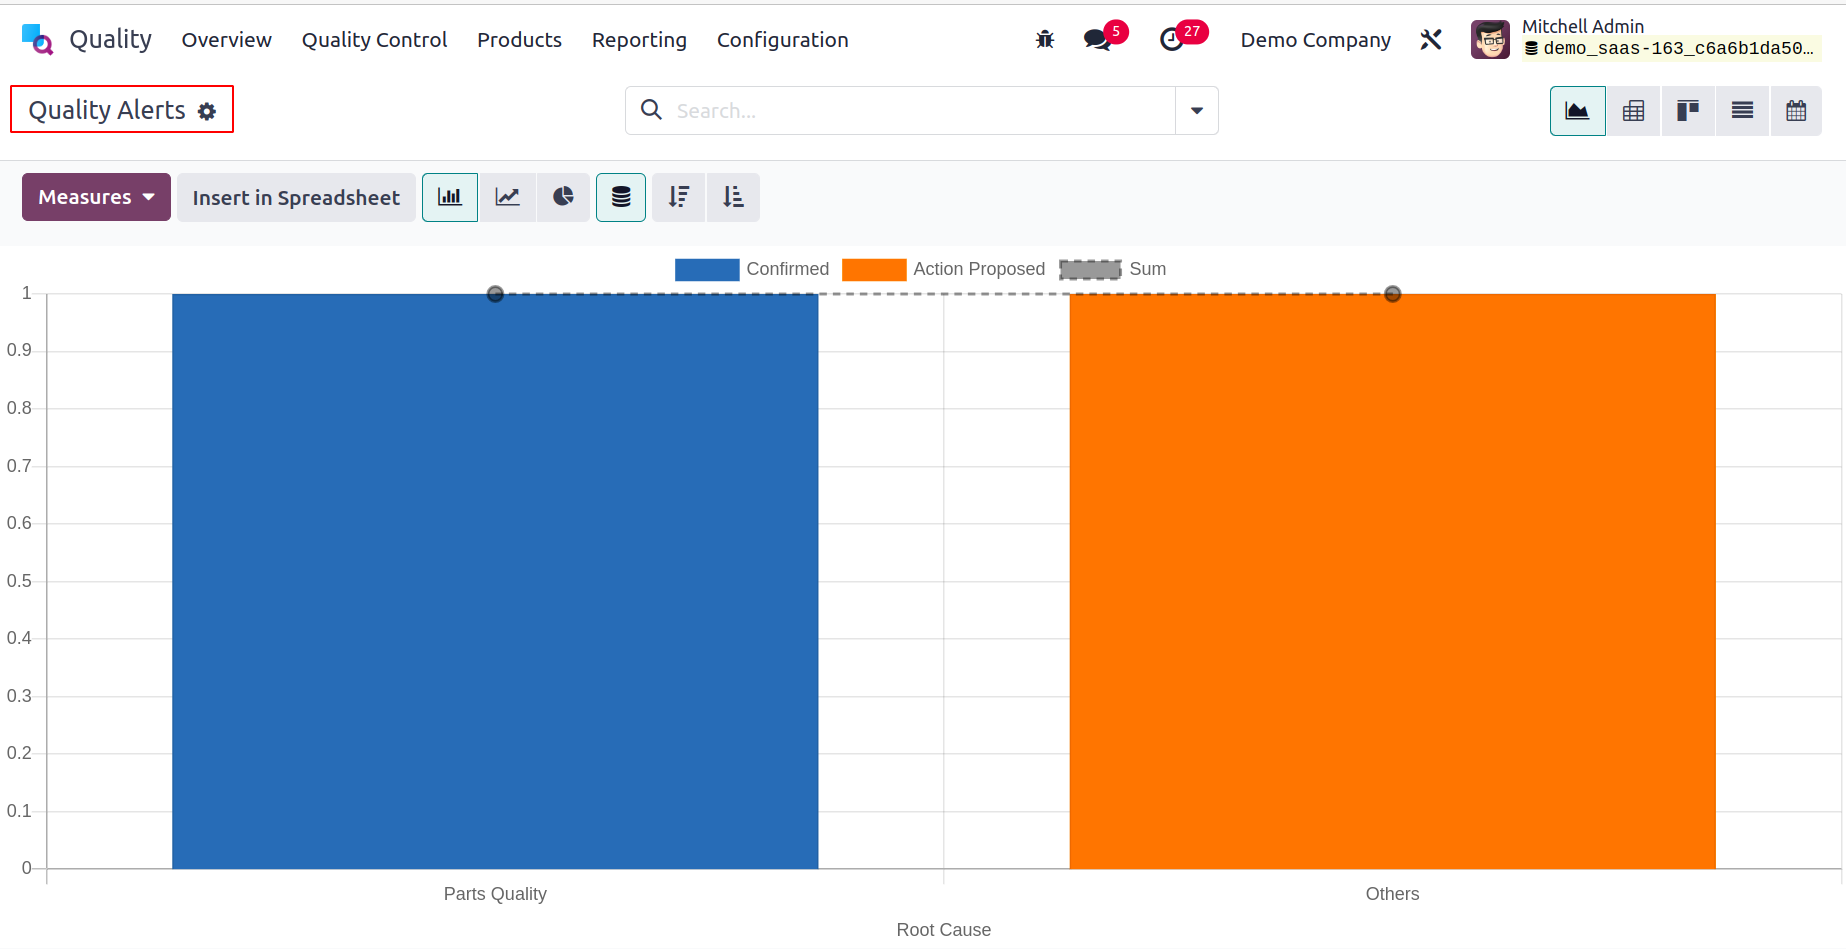
option under the Reporting tab to assess an alert. The quality alert report on the
presented page is solely dependent on the root cause. You can find the problems and take
corrective action after analyzing the report.
Quality Alerts
When you select Quality Alerts from the Reporting tab, a new window appears with a visual
showing the status of the quality alerts. Users can analyze quality checks by applying
various measurements to graphical representations. Quality alerts are categorized here
according to status.

Quality checks can also be grouped based on Stages and Root Causes, and Add Custom
Groups. You can add these data to the graph by selecting the Group menu.