The Odoo 17 Purchase module's enhanced Reporting feature, which is available, will
provide insightful reports on the purchases made by your business. You can use reports
you produce on a daily, monthly, or annual basis to evaluate your purchasing activity.
The dynamic purchase reporting platform will assist you in performing pivot tables and
graphical analyses of data.

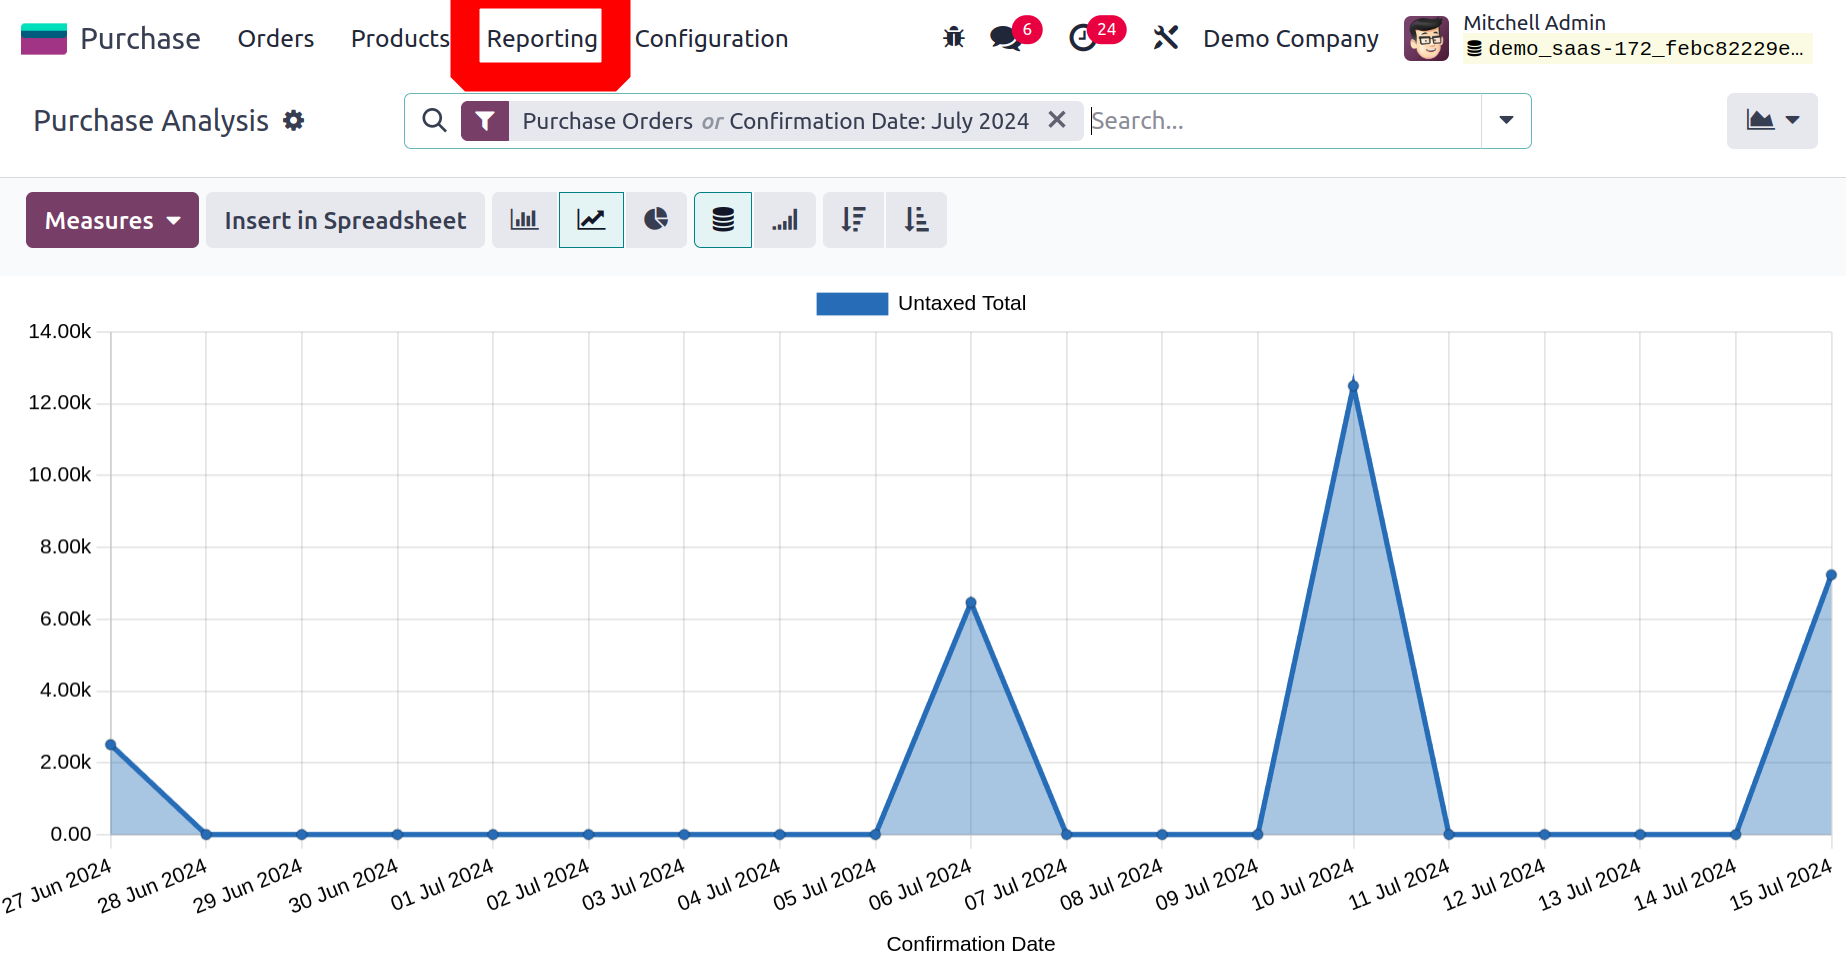
The line chart showing the untaxed total of the purchases depending on their
confirmation date is displayed in the screenshot up top. Depending on your
preference, you can view the graphic reports as line, bar, or pie charts. You can
arrange the Line and Bar charts either in ascending or descending order.
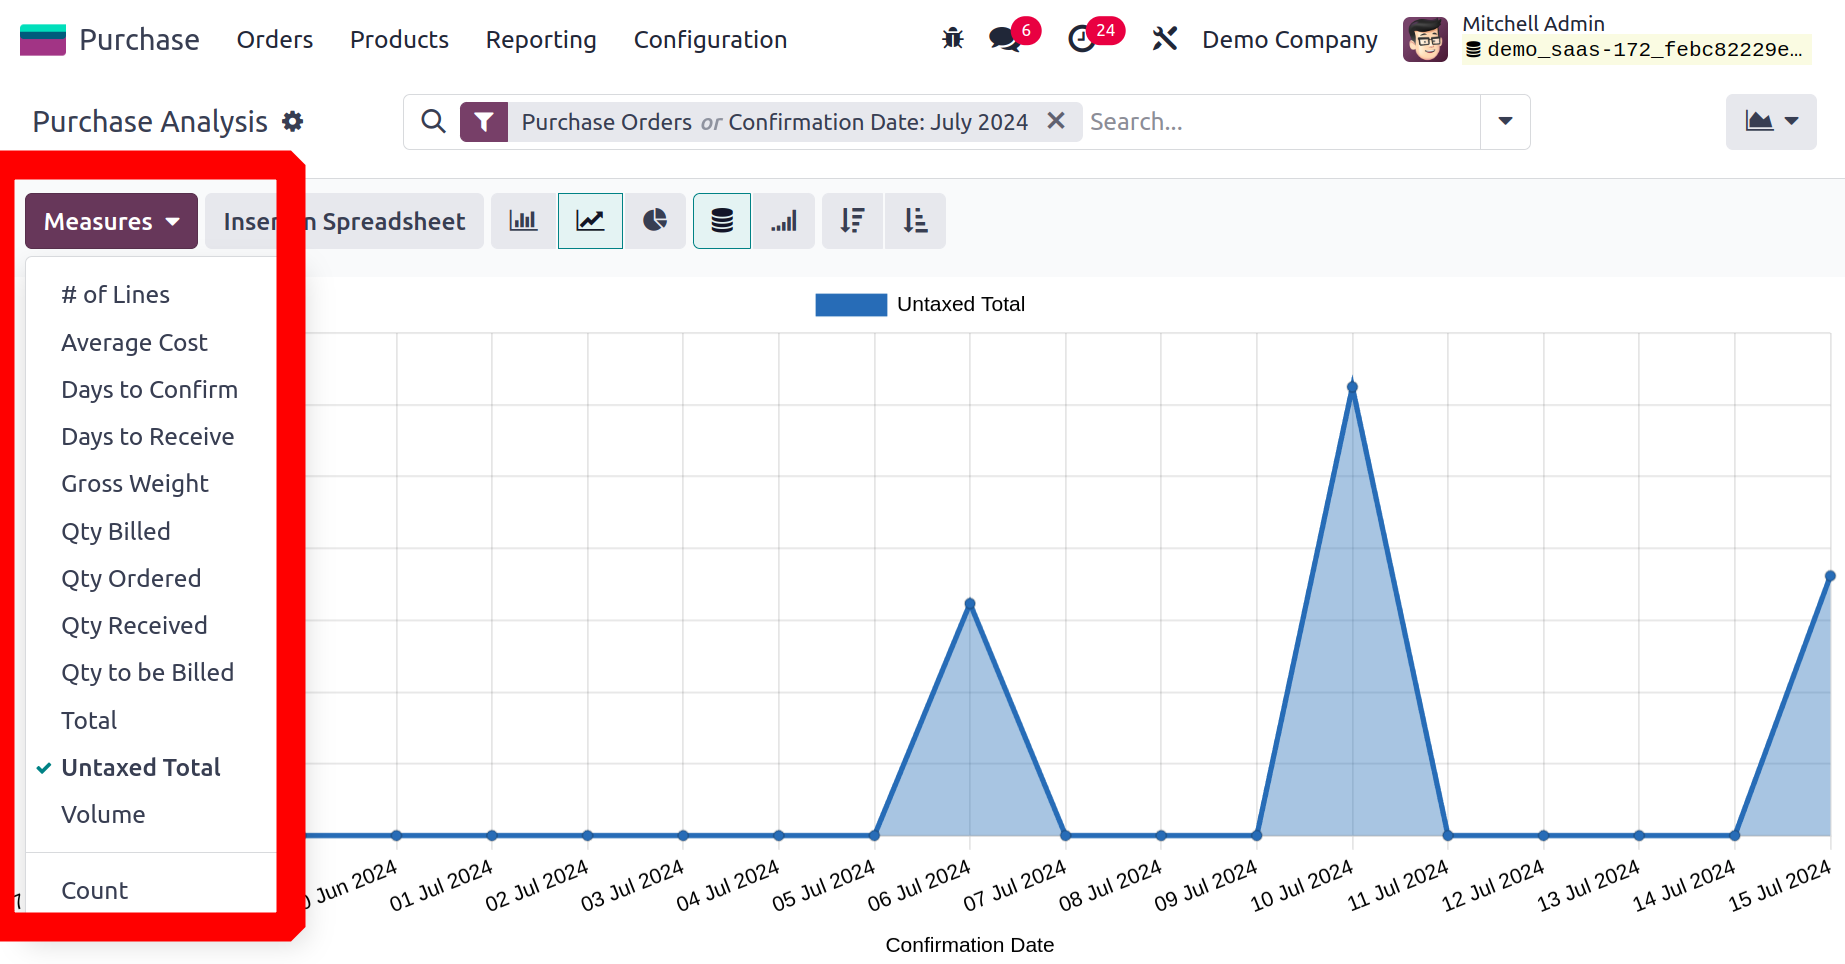
Average Cost, Days to Confirm, Days to Receive, Gross Weight, Quantity Billed,
Quantity Ordered, Quantity Received, Quantity to be Billed, Total, Untaxed Total,
Volume, and Count are some of the options for the Measures.

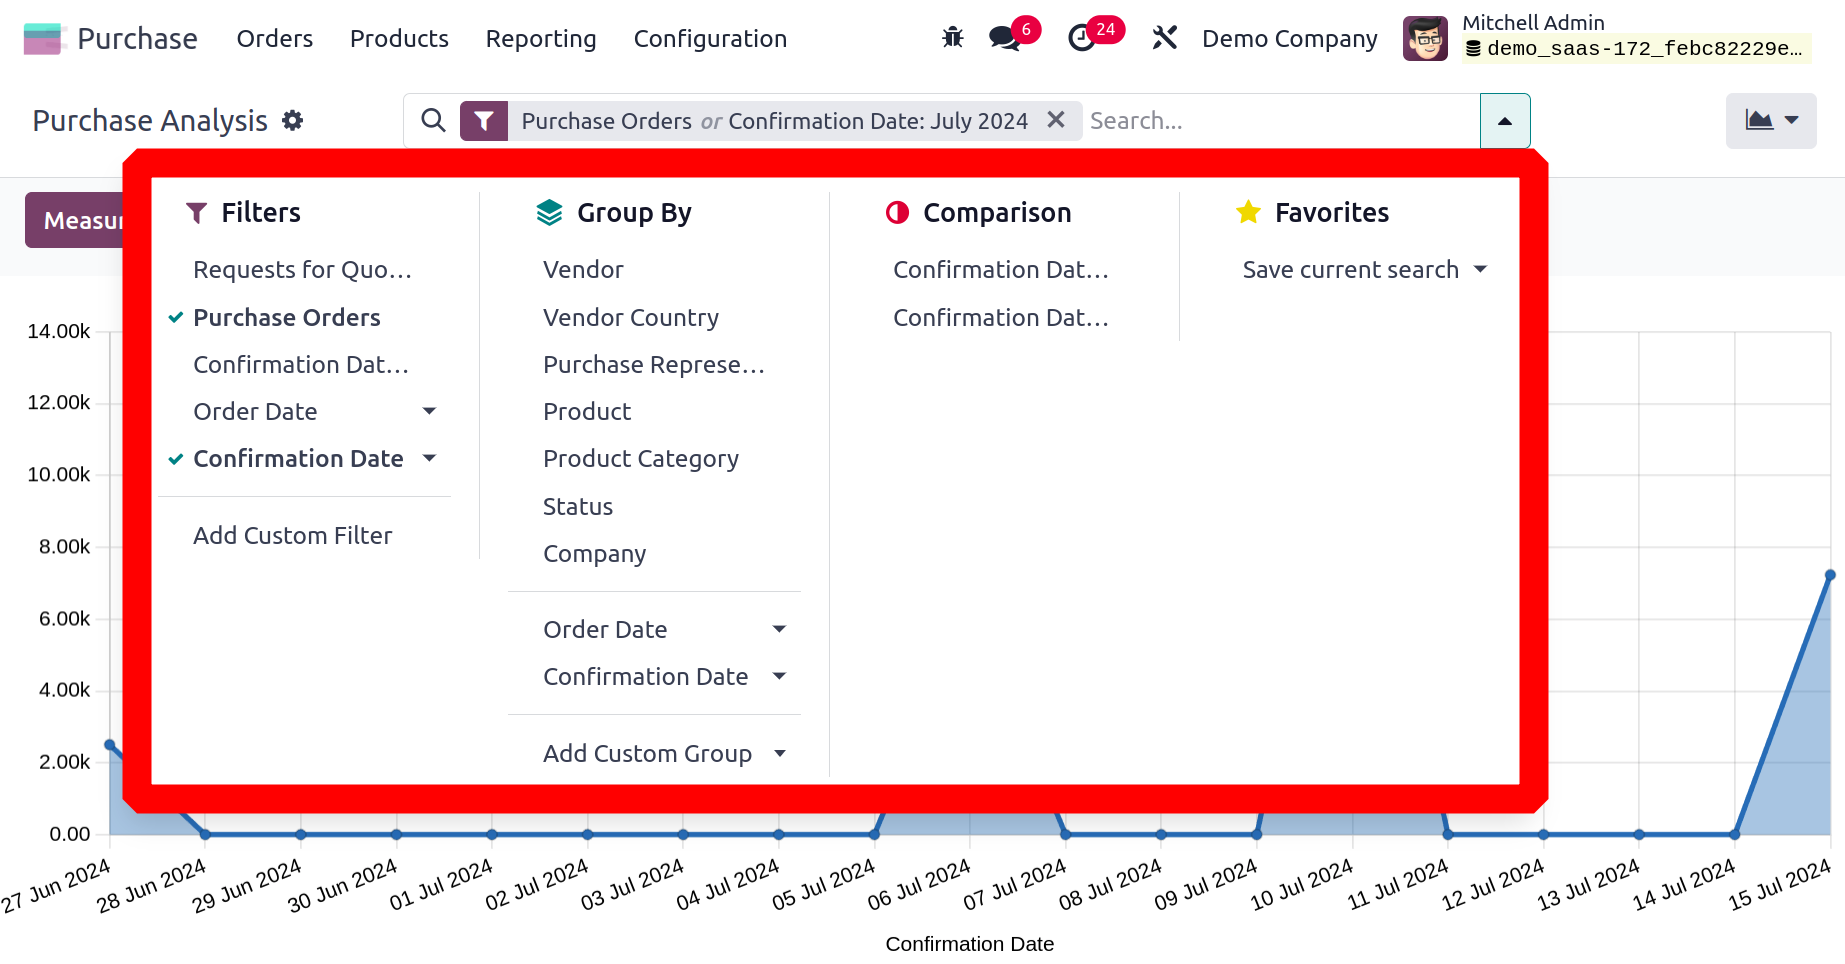
The Request for Quotations, Purchase Orders, Confirmation Date Last Year, Order
Date, and Confirmation Date can all be used to filter the report. You can add
new custom filters to your reports using the Add Custom Filter option. In a
similar vein, the platform for purchase reporting will also provide you with
default Group By options.

Vendor, Vendor Country, Purchase Representative, Product, Product Category,
Status, Company, Order Date, and Confirmation Date are among the criteria
you can use to group the reports. To build a custom group by options, click
the Add Custom Group button.
Let's now examine the Purchase report's pivot view.