Reporting
You can simply analyze and comprehend the workflow for managing the inventory with the aid of careful
monitoring of the inventory operations. Odoo can provide you with a platform specifically designed for producing reports for the inventory activities carried out
in your business with precise data representation in graphical and tabular representations.
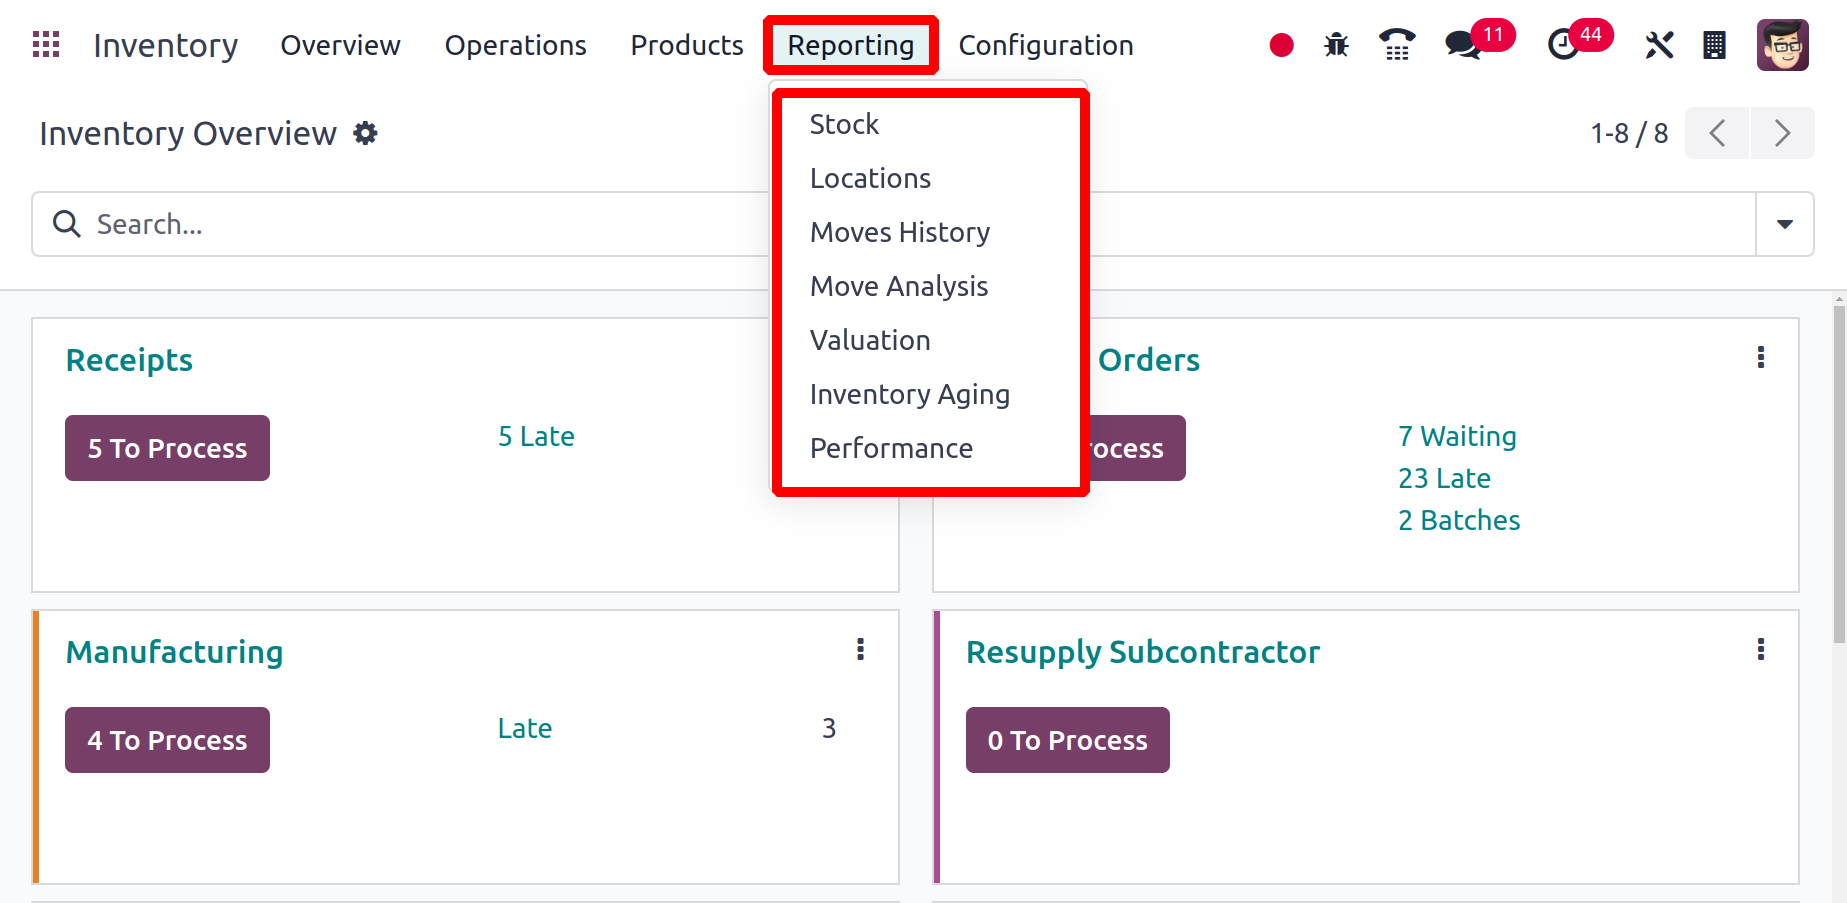
To acquire thorough reports that meet your needs, you can real-time customize your reports. You may get the reports for Stocks, Locations, Moves History, Stock Moves, Valuation, and Performance
under the Odoo Inventory module's Reporting menu. Let's look more closely at each of these reporting platforms.
Stocks
All of the stocks that are currently in your inventory are listed in the
Stocks platform under the Reporting menu. Details on the
Product, Unit Cost, Total Value, On Hand, Free to Use, Incoming, and Outgoing Quantity will be provided to you.

Using the available categories displayed on the left side of the screen as highlighted in the figure, you can categorize the stock list according to the product category. You can use the search box at any moment to make the search process easier.
The stocks can be filtered using the built-in default filters as Services, Products, Published, Available in PoS, Can be Sold, Can be Purchased, Can be Recurring, Can be Rented, Can be Subcontracted, Can be Expensed, Favourites, Warnings, Archived, Available Products, and Negative Forecasted Quantity. The Add Custom Filter button can let you create custom filters. The default Group By options are Product Type, Product Category, and PoS Product Category. To create a custom group by option, click the Add Custom Group button.
You may view the product's Inventory Adjustment information by clicking on the tiny icon next to the On Hand field.
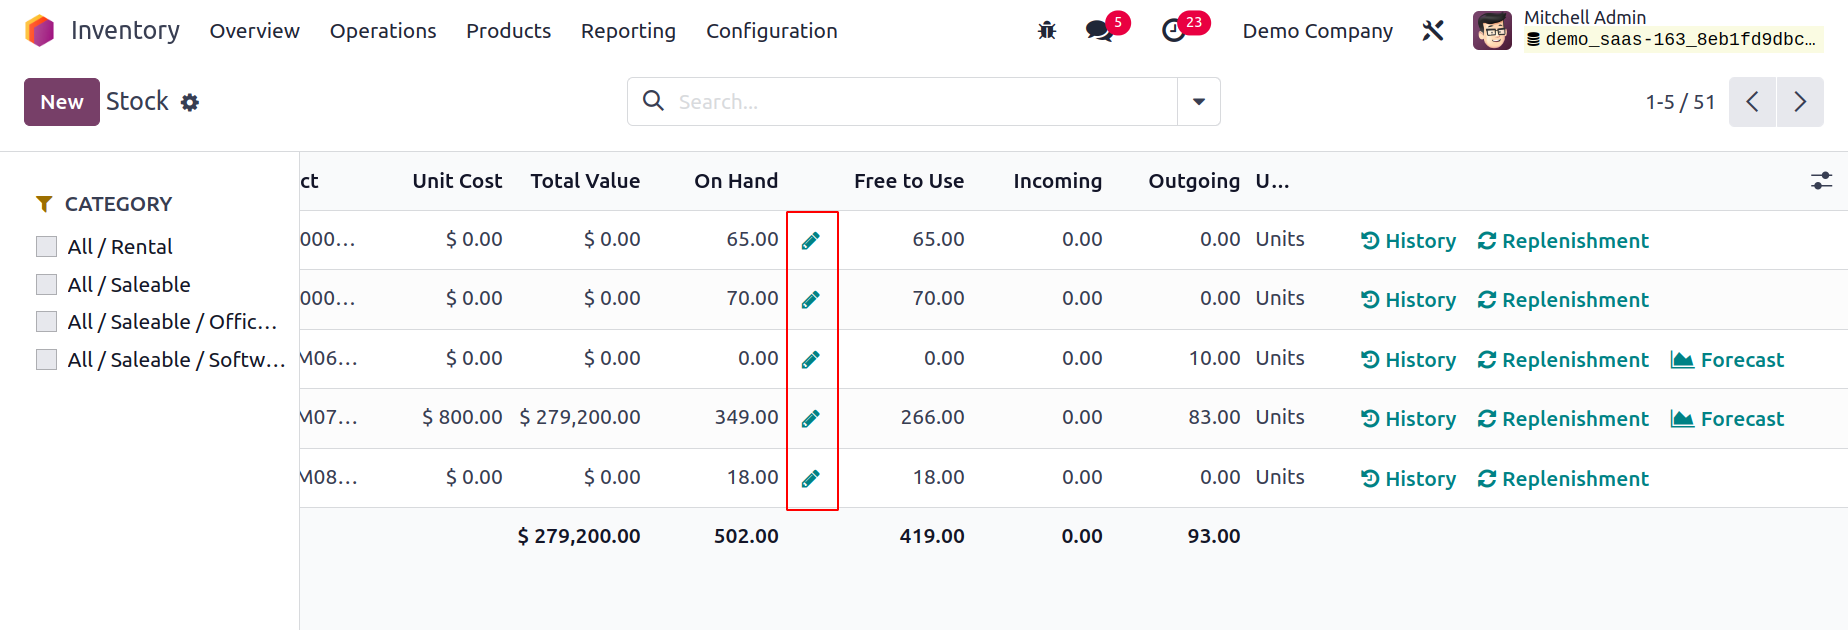
The Inventory Adjustment part of this chapter has already covered how the inventory adjustment platform functions.

You can click on the History button located in the stock pane, as shown in the illustration, to view the movement history of any product.
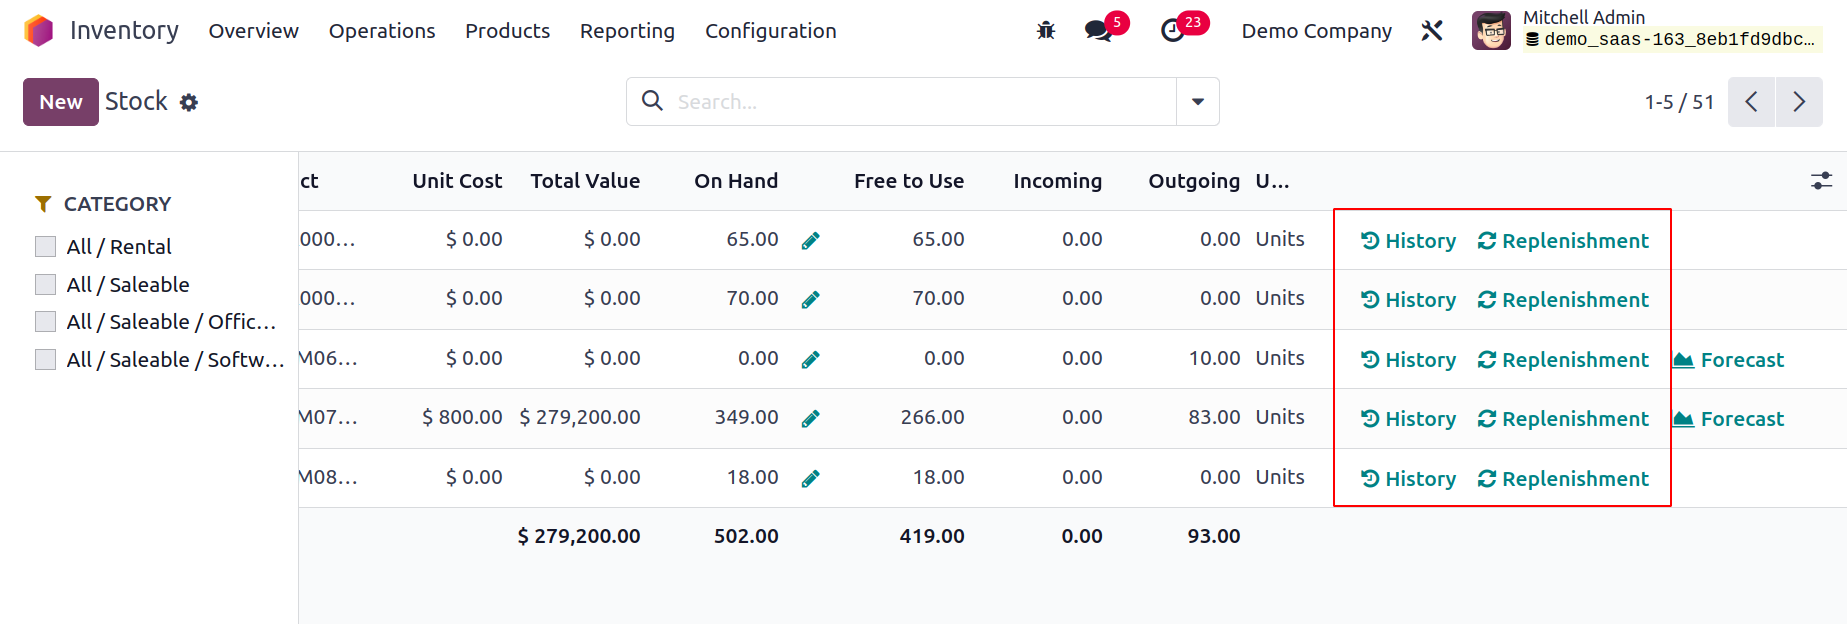
The History button will take you to the relevant product's movement history window. On this platform, you may see
each move's Date, Reference, Product, Lot/Serial Number, From, To, Quantity, and Status.

In accordance with the reordering regulations, the product can be replenished by
clicking the Replenishment button on the screen. The Location button
will display a product's whereabouts in your inventory.

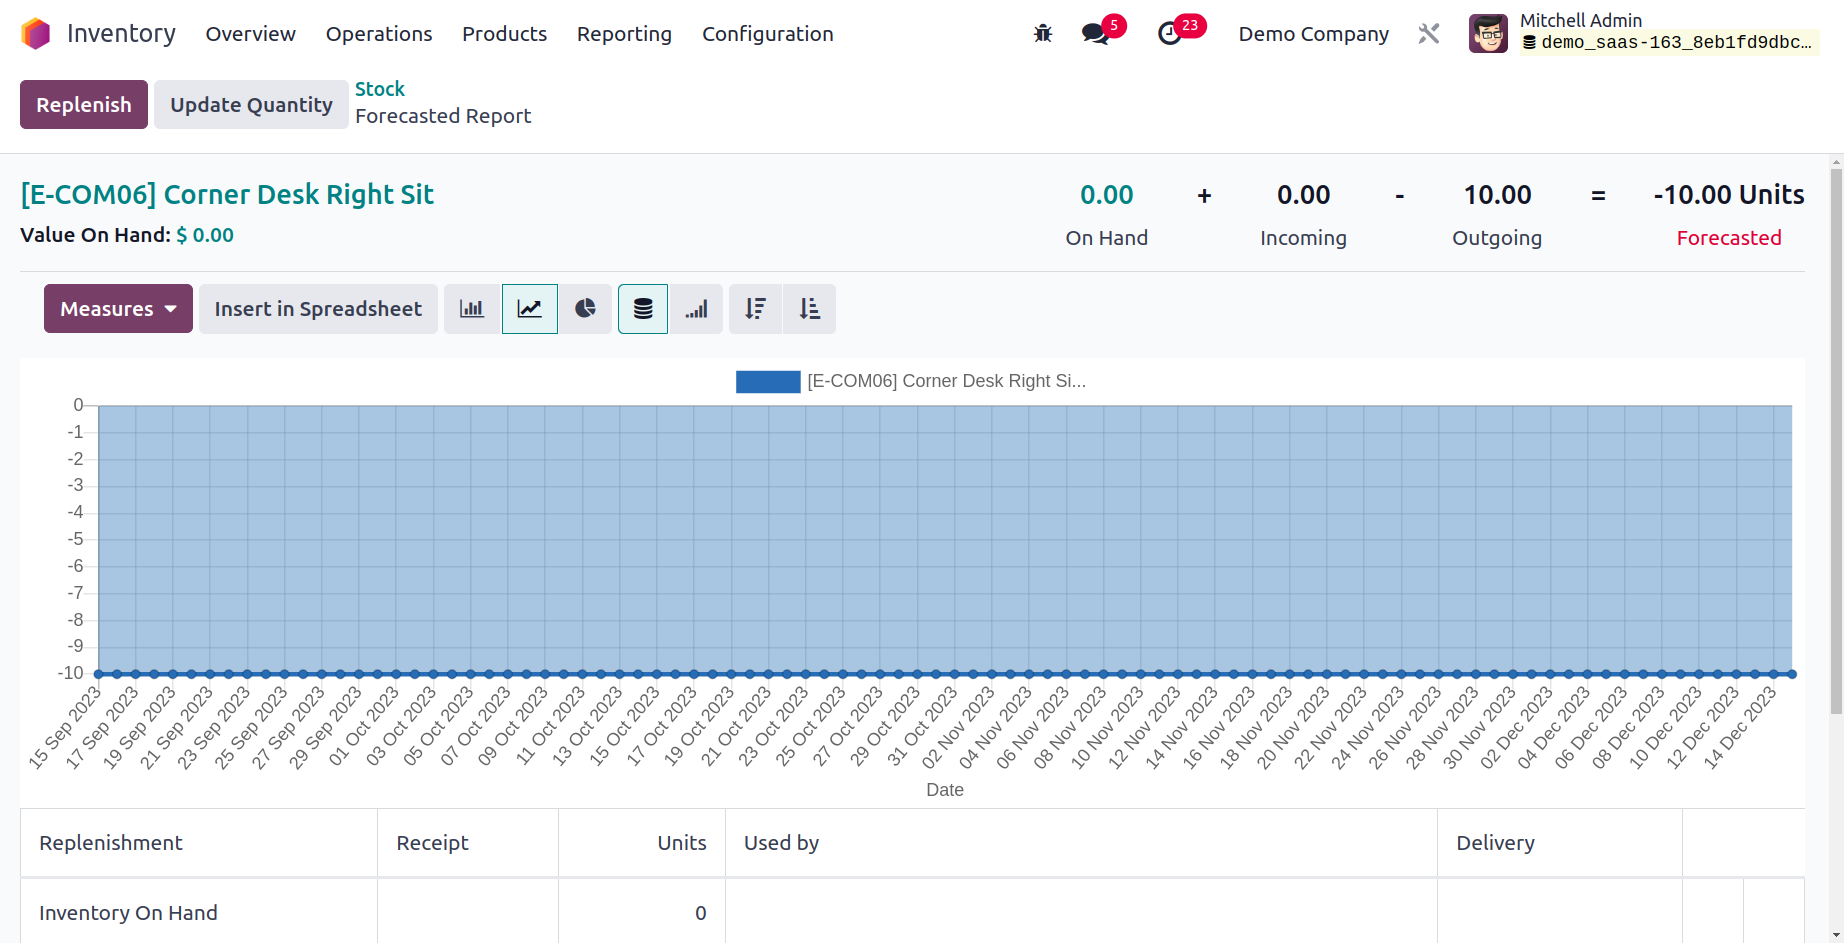
You can obtain a product's forecast report by using the Forcast button.
Location
The Location report's list view is provided below. Location,
Product, Package, Lot/Serial Number, On Hand Quantity, and Reserved Quantity are all displayed here.
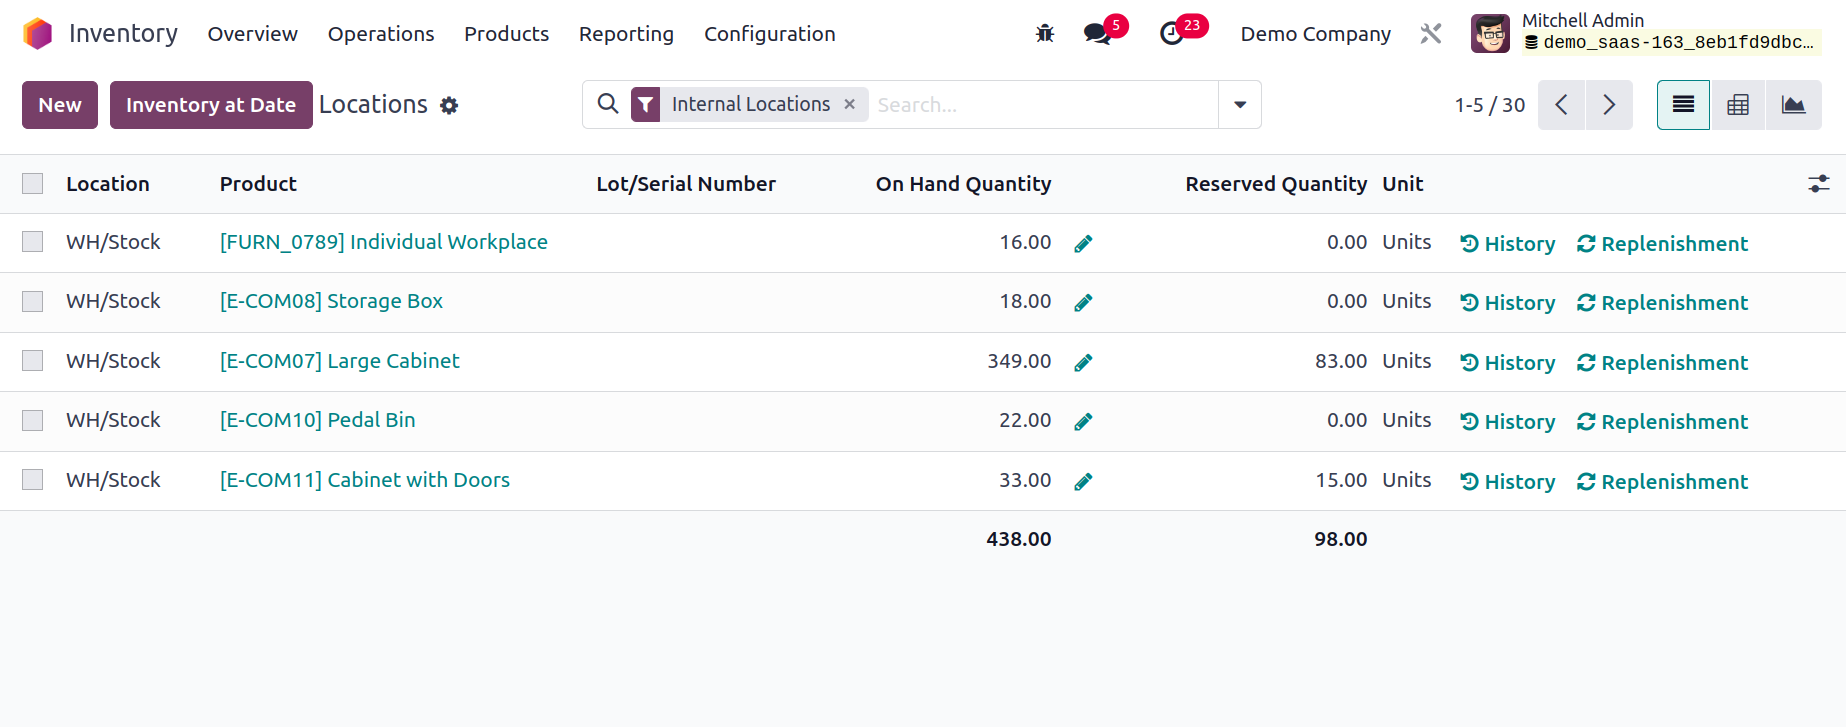
As we already indicated, you may restock the products using the Replenishment button and view the history of the moves using the History button from the Location reporting window. Utilizing the smart button on the screen, the inventory adjustment may be done.
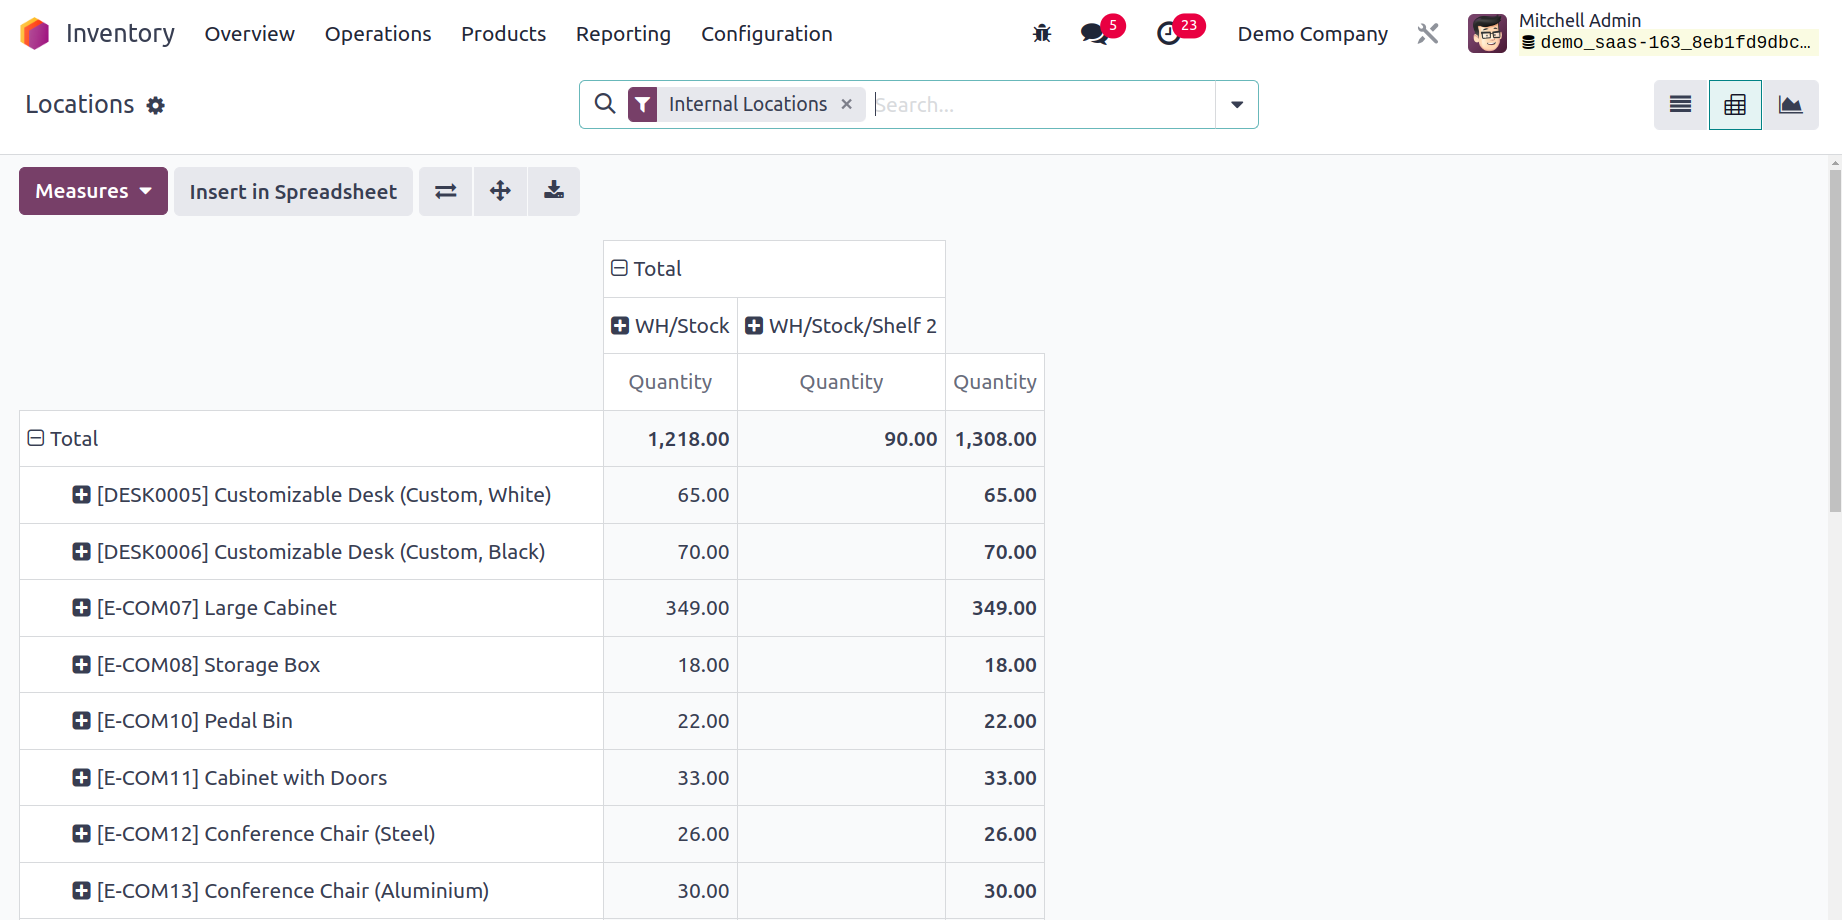
The pivot table view of the Locations is displayed in this screenshot. Measures, Filters, and Group By options can be used to create reports that are ideal for your needs. You can also convert this window into a graphical view, where you can change the graph's type to a line, pie, or bar chart as it suits you best.
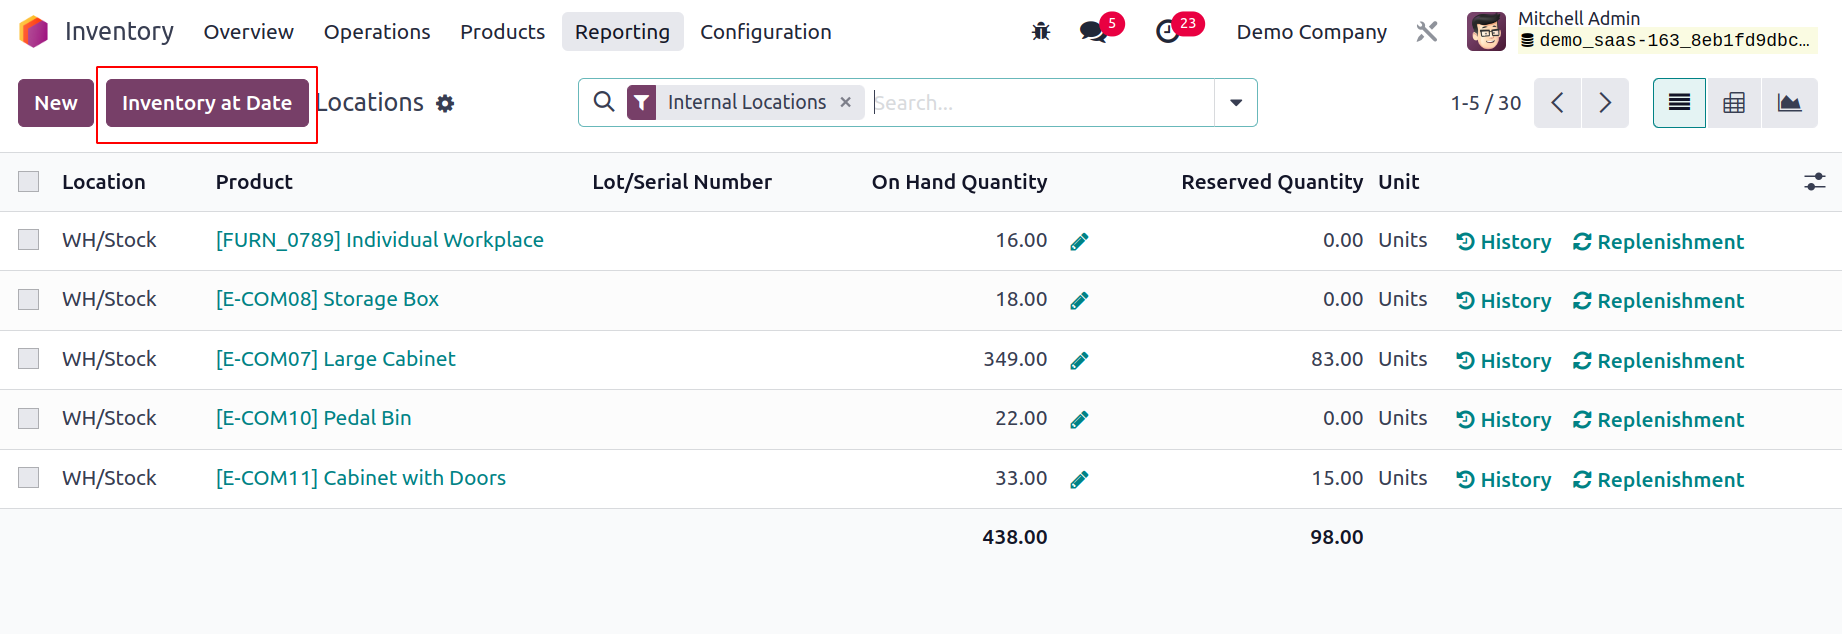
You may access the Stock Valuation Report for each product by selecting Inventory at the Date from the menu.
You will see a pop-up window asking you to select a date so that you can receive the value report on that day. After mentioning
the date, press the Confirm button. On your screen, Odoo17 will display the stock valuation report for the chosen date.

A product's stock valuation report will include the following information like product name, Reference, Variants, Sales price, Cost, Onhand quantity and Forecasted quantity, etc.
By selecting the Valuation at Date option, you can obtain the stock valuation report for the products as of a specific date.
Moves History
Odoo17 provides a separate platform where you may view the history of all product moves for all items listed in your inventory. You will have a clear understanding of
the movement of the items in your inventory on a specific day thanks to this report.
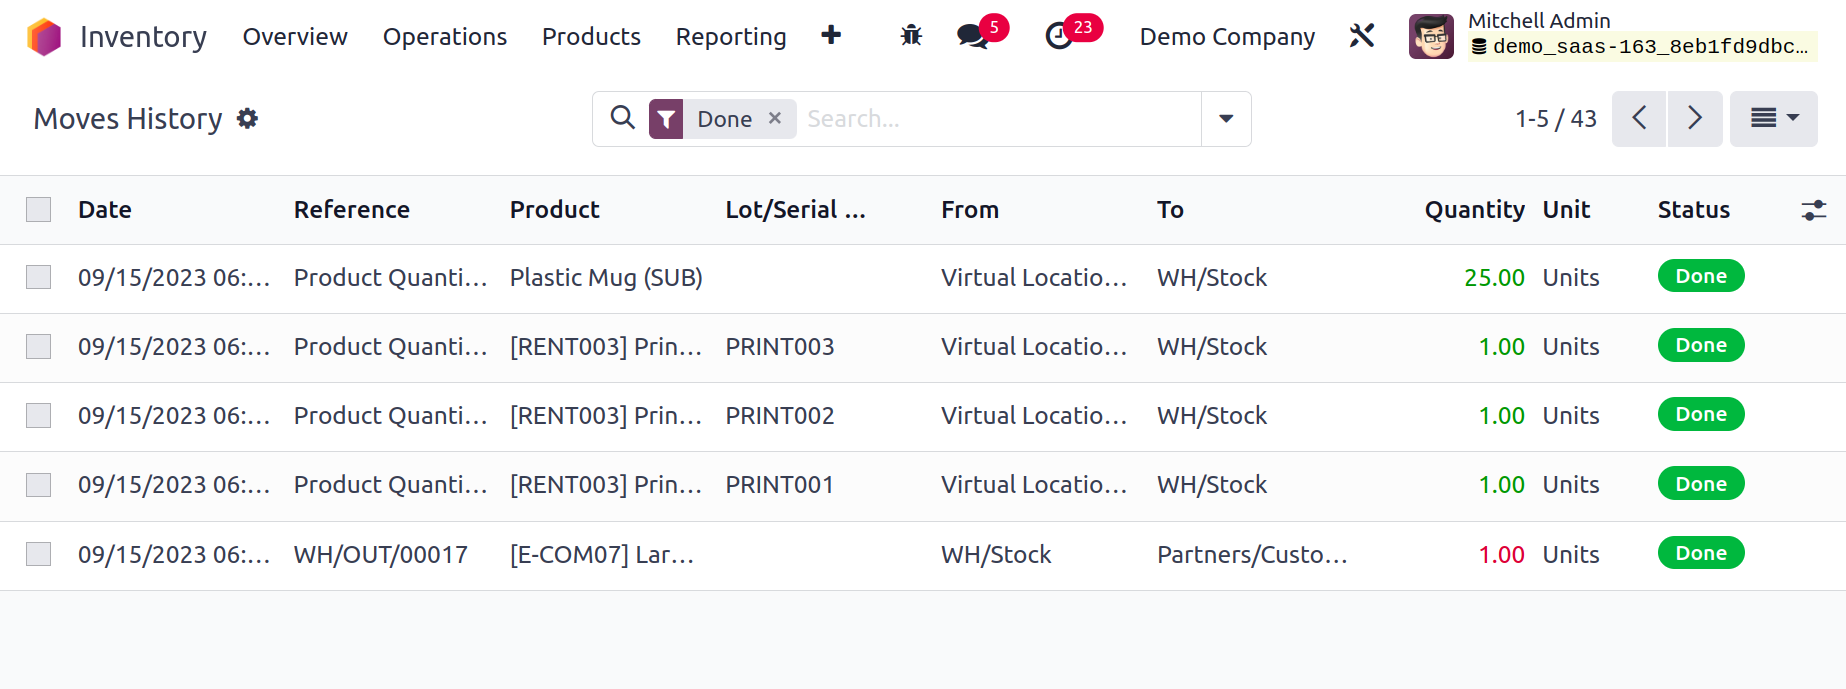
From the list view of the platform, you will also receive the Reference, Product, Lot/Serial Number, From, To, Quantity, and Status in addition to the date of operation. Additionally, it offers options for seeing the history of moves in both Kanban and Pivot perspectives.
Moves Analysis
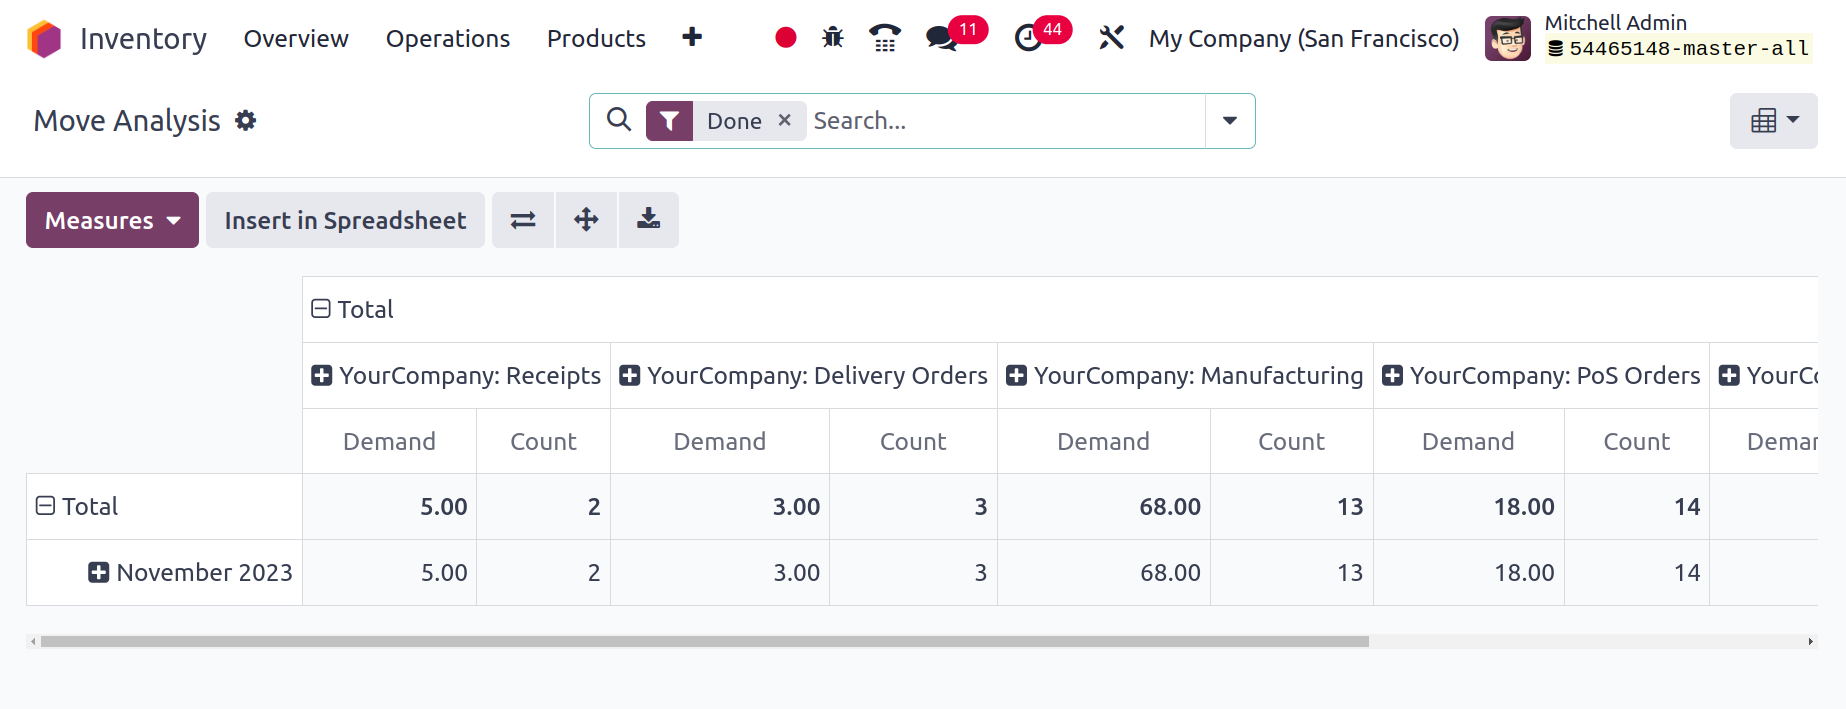
Moves history and Moves analysis are comparable as well. Here, the movement of the products is displayed according to stock. Here, the Pivot View will be used to display the movement. Additional views, such as the List View, Kanban View, and Graph View are also offered.
Valuation
The Valuation option, which can be found in the Inventory module's Reporting menu, can be used to generate reports on stock valuation. This report can be used to analyze stock valuation properly.
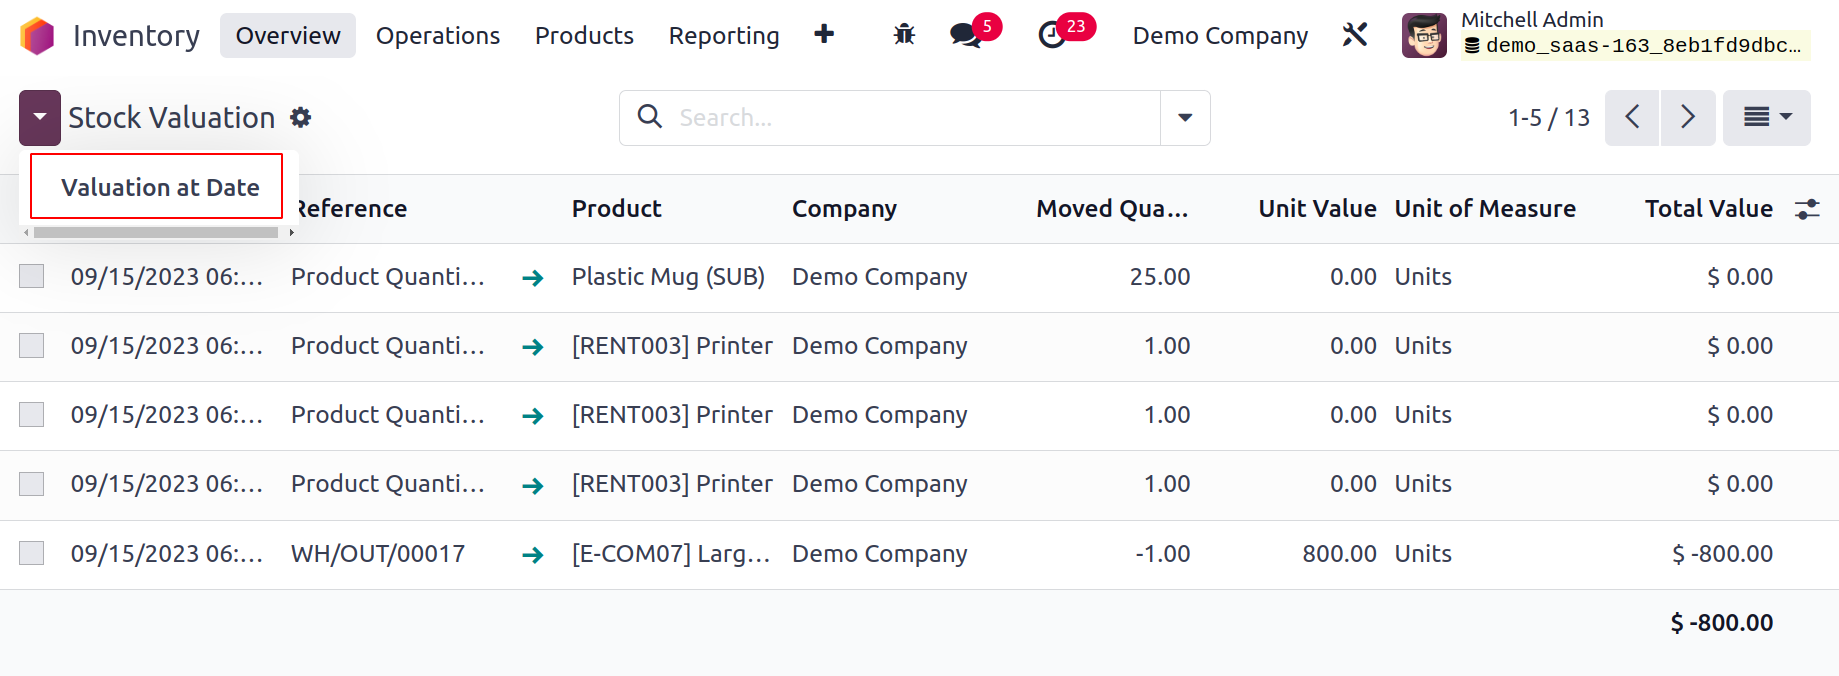
You can access the Date, Reference, Product, Company, Moved Quantity, Unit Value, and Total Value of the inventory valuation from this platform's list view. You can click the Valuation at Date button to acquire the valuation report for a specific date, at which point a pop-up window asking for the date will appear.

When you choose a date and press the Confirm button, Odoo17 will show you the valuation report for that specific date.
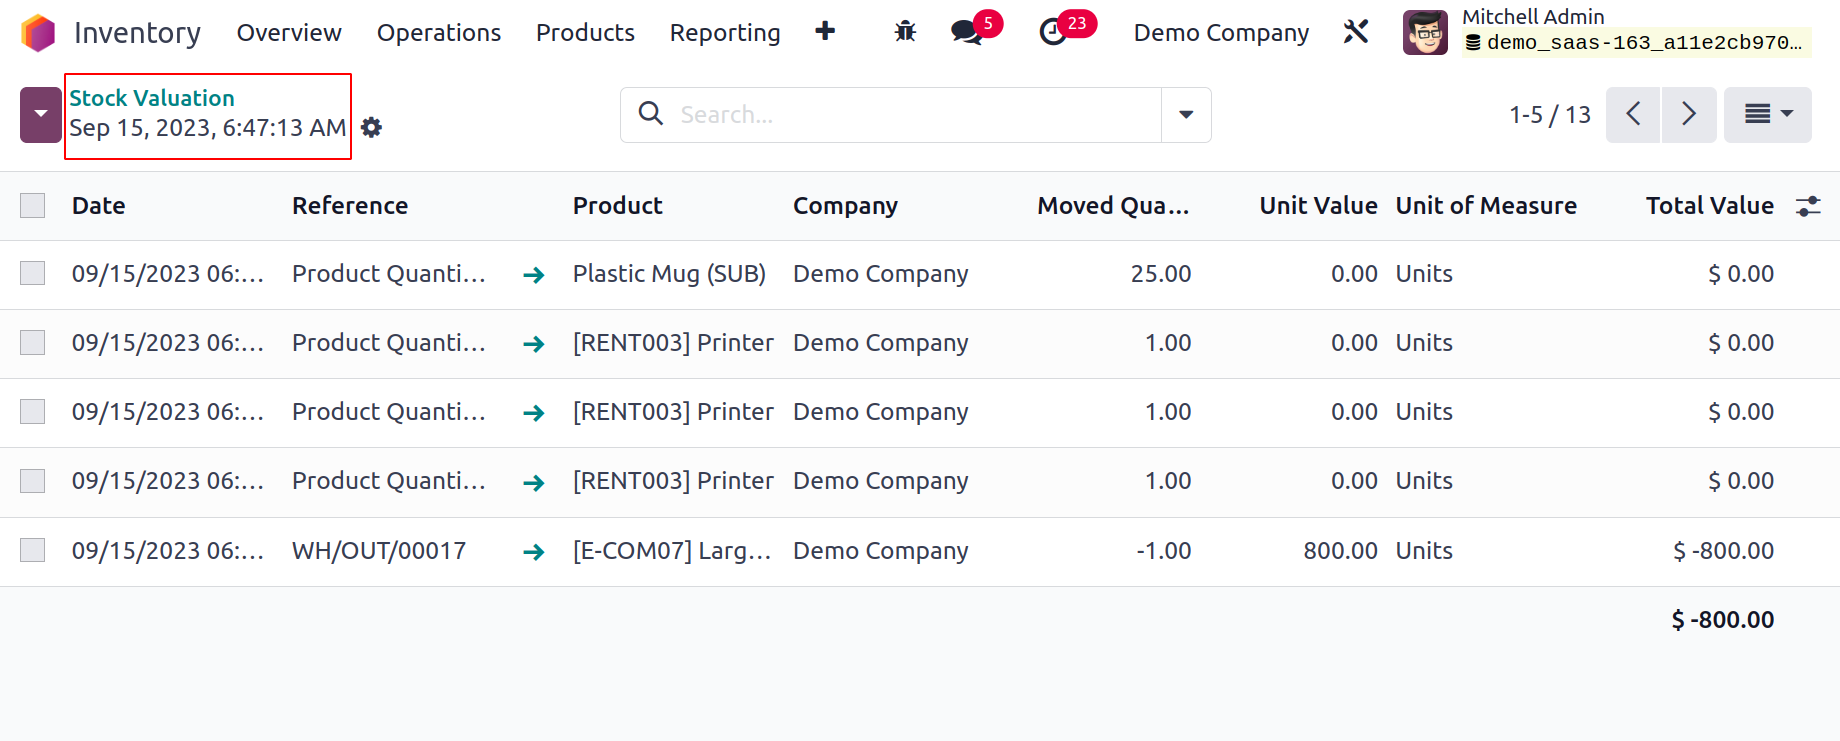
Above is the pivot view of the stock valuation report. As measures for the pivot table, you can use Quantity,
Remaining Quantity, Remaining Value, Total Value, Unit Value, and Count. To obtain the anticipated report of the
stock value, use the unique features offered by the Filters and Group By options.

You can plan and keep track of all inventory operations in one location by using Odoo17's specialized inventory management system. You can rely on the highly integrated Inventory module to handle your inventory
and warehouse operations completely while ensuring optimum workflow efficiency.
Inventory Aging
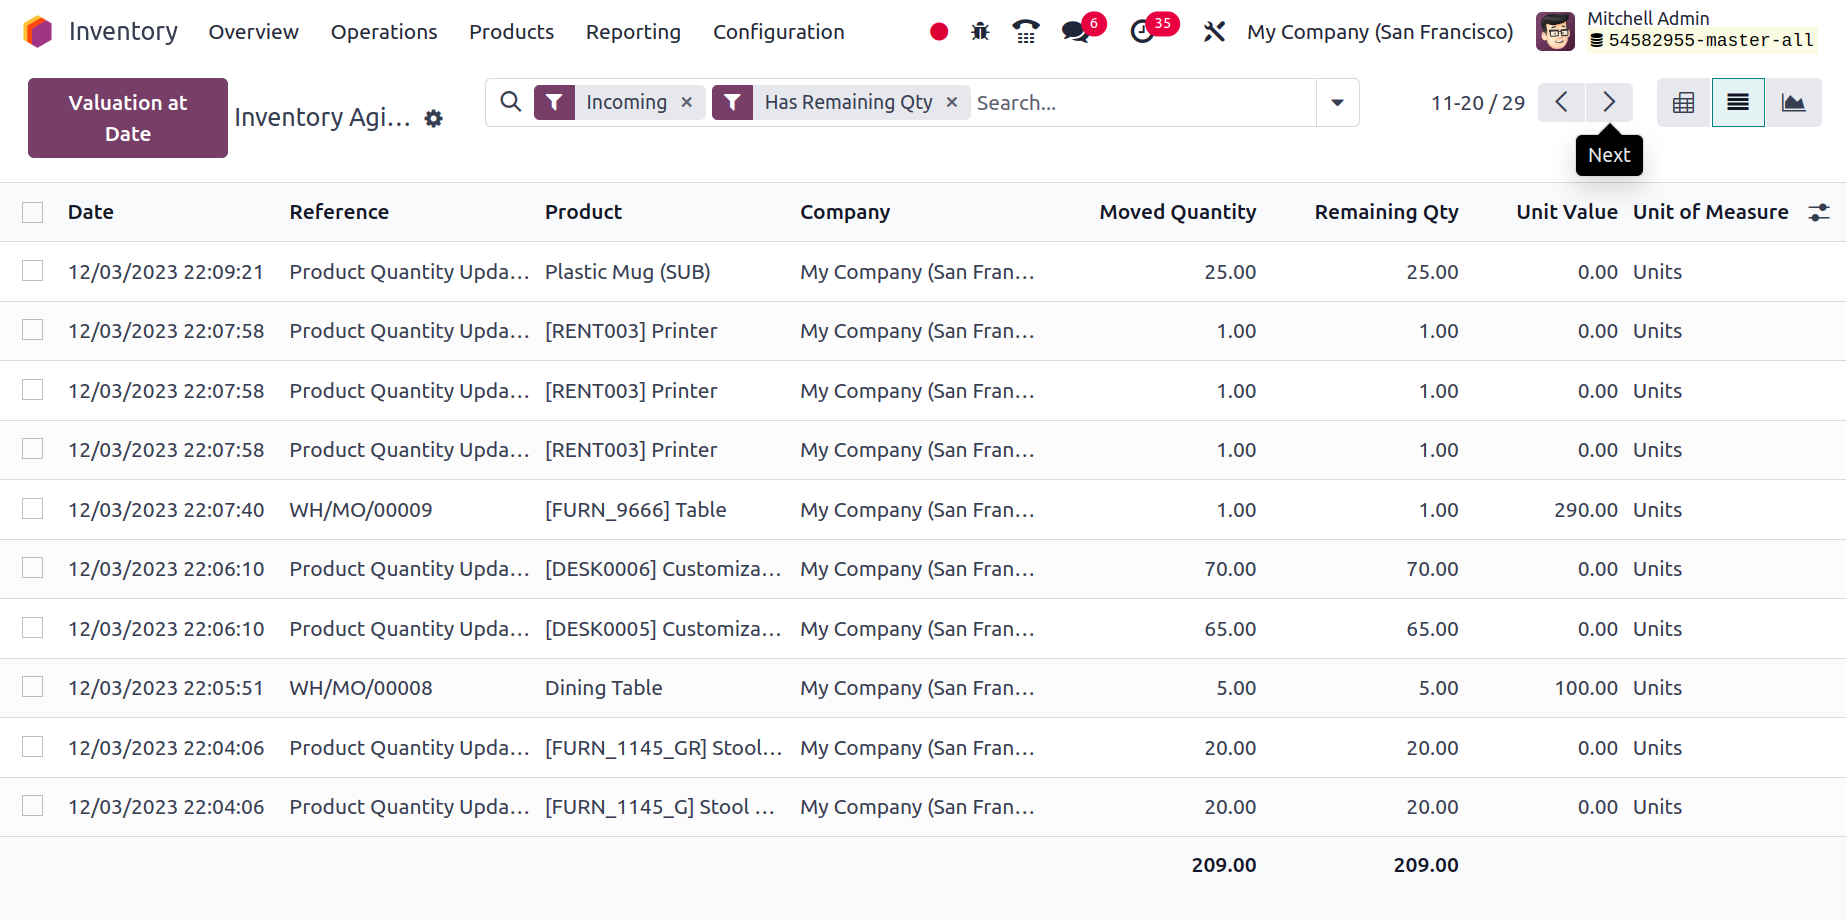
A list of incoming products is displayed in the Inventory Ageing report. The user can view the specifics of aged stocks with the use of this report. The user obtains information from the list regarding the date of transfer, product, reference, moved quantity, remaining quantity, unit value, and unit of measure, among other things.
Performance
The Reporting menu's Performance button can be used to analyze the effectiveness of warehouse activities.
Odoo 17 will offer helpful warehouse analysis reports that
may be used going forward to improve performance over the present.
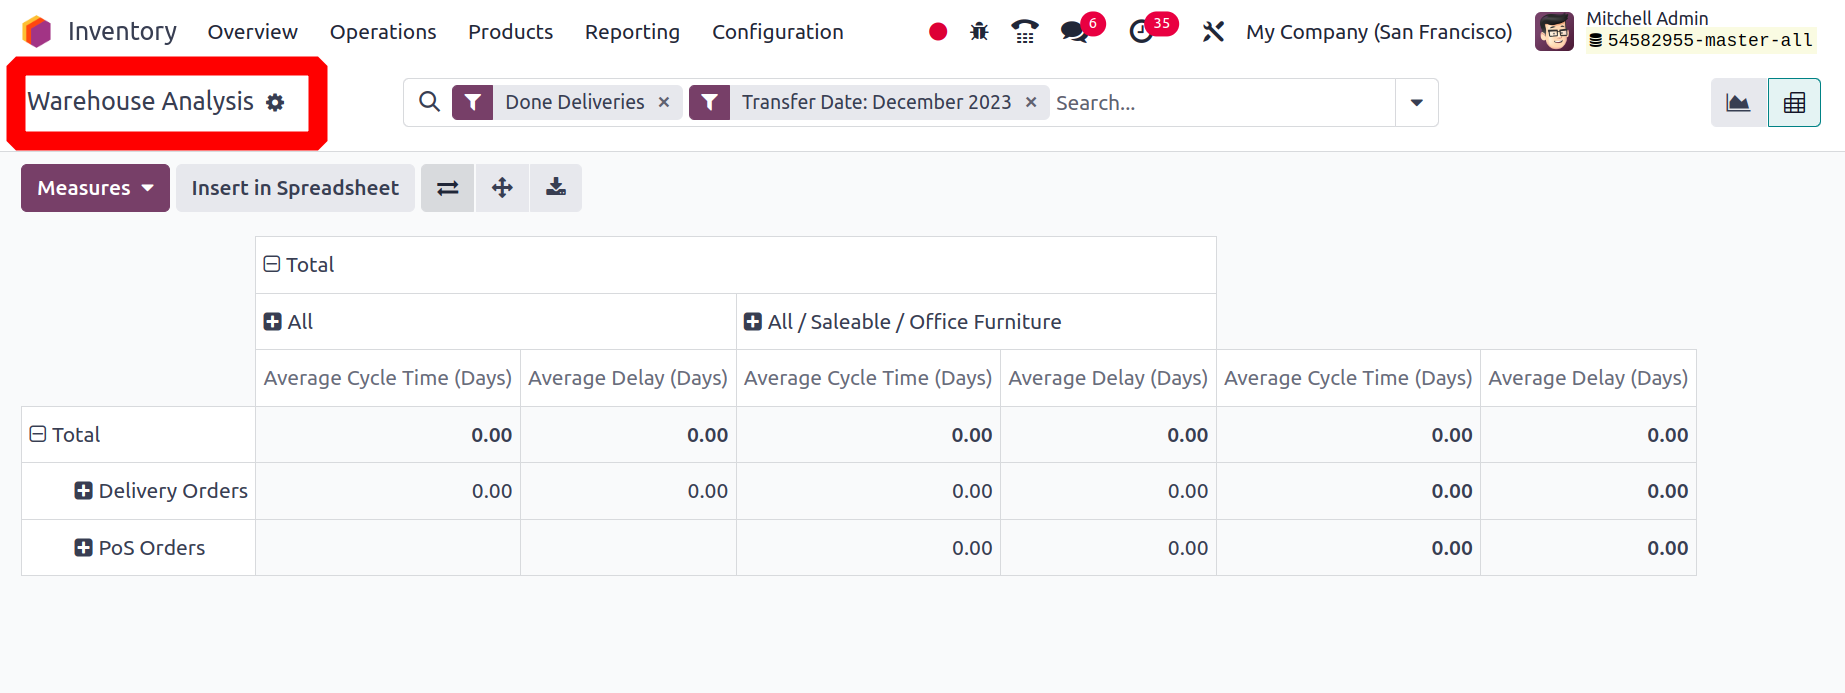
This platform is viewable in both Pivot and Graphical formats. Depending on the need, you can choose between Pie, Line,
or Bar charts in the graphical display. To acquire precise information, you can adjust the Measures in accordance with your
goals. Cycle time, delay, product quantity, and count are all applicable as metrics. Done Transfers, Done Deliveries, Done Receipts,
and Transfer Date are the criteria that can be used to filter the report.
You can plan and keep an eye on all inventory-related tasks in one location with Odoo 17's dedicated inventory management system.
You can rely on the highly integrated Inventory module to handle every aspect of your inventory
and warehouse operations, ensuring optimal workflow efficiency.