Sales Analysis
You may assess the sales success of your organization by going to the Sales module's Reports tab. Additionally, you have the option to scale this data for a certain amount of time, which can improve productivity and overall sales success for your business. These reports may help you make the essential changes to impact the expansion of your company. It is possible to track sales statistics on a daily, weekly, monthly, or annual basis. In order to access the Sales Analysis window, click the Reporting tab.
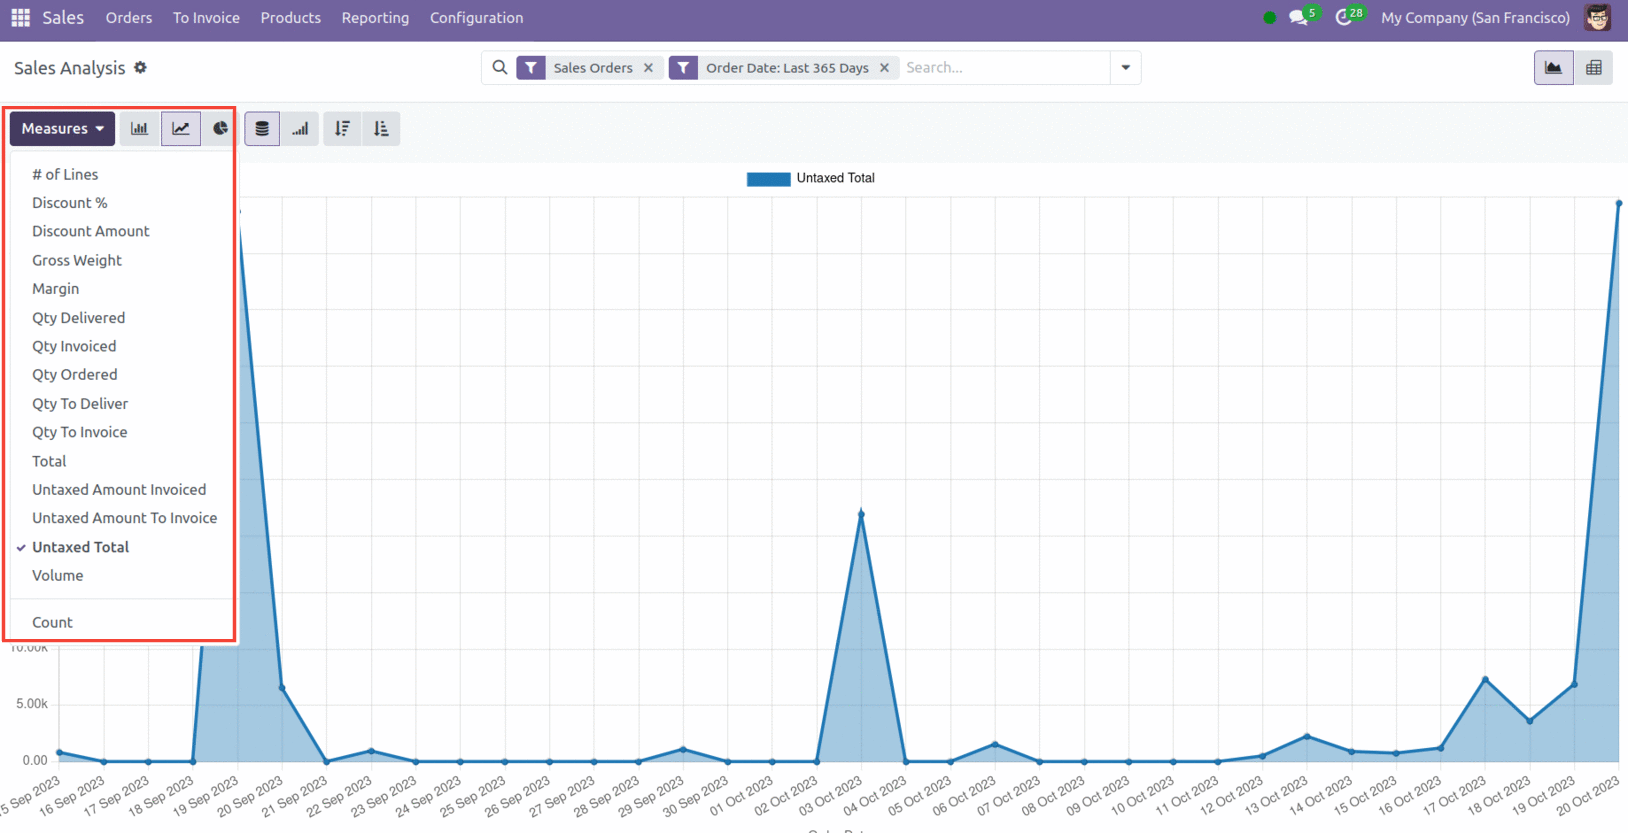
As shown above, click on "Measures" and choose from the dropdown list the category you wish to see on the graph. Using the icon in the upper right corner of the window, you may also change the view from "Graph" to "Pivot." This view provides your sales report in tabular form.

To switch the axes, click on the Flip axis icon. Whereas "Download xlsx" transfers your data to an Excel sheet, "Expand all" lets you expand the content of the records. Above, each of these symbols is highlighted.
Filters can be used to create reports on sales orders and quotations. You may get sales and quotes reports for a specific day, week, month, or year by selecting the "Order Date" option under Filters.
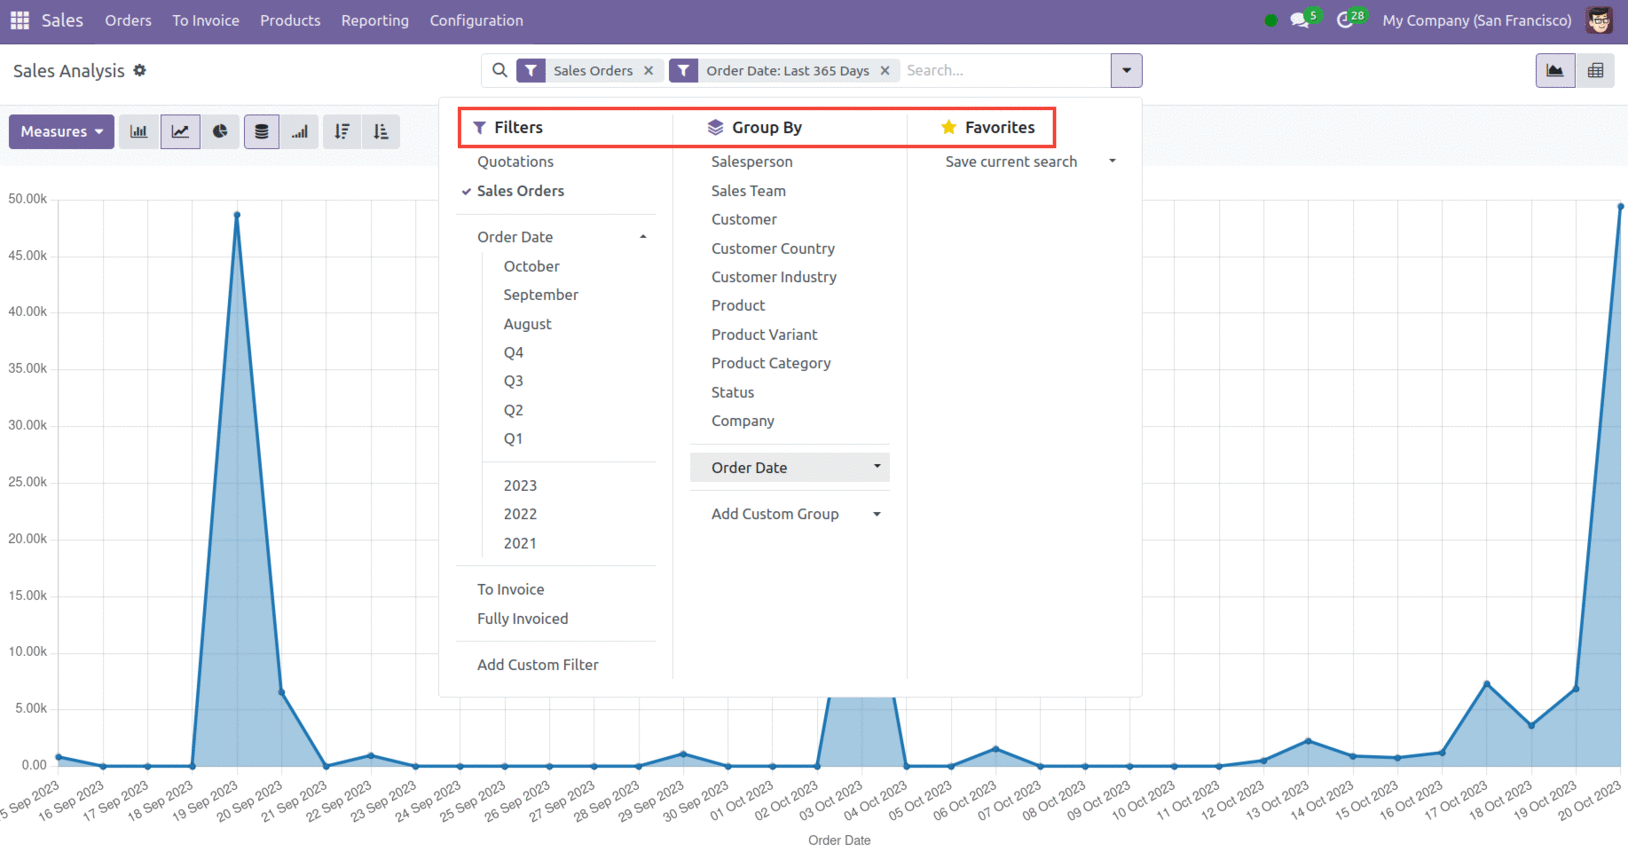
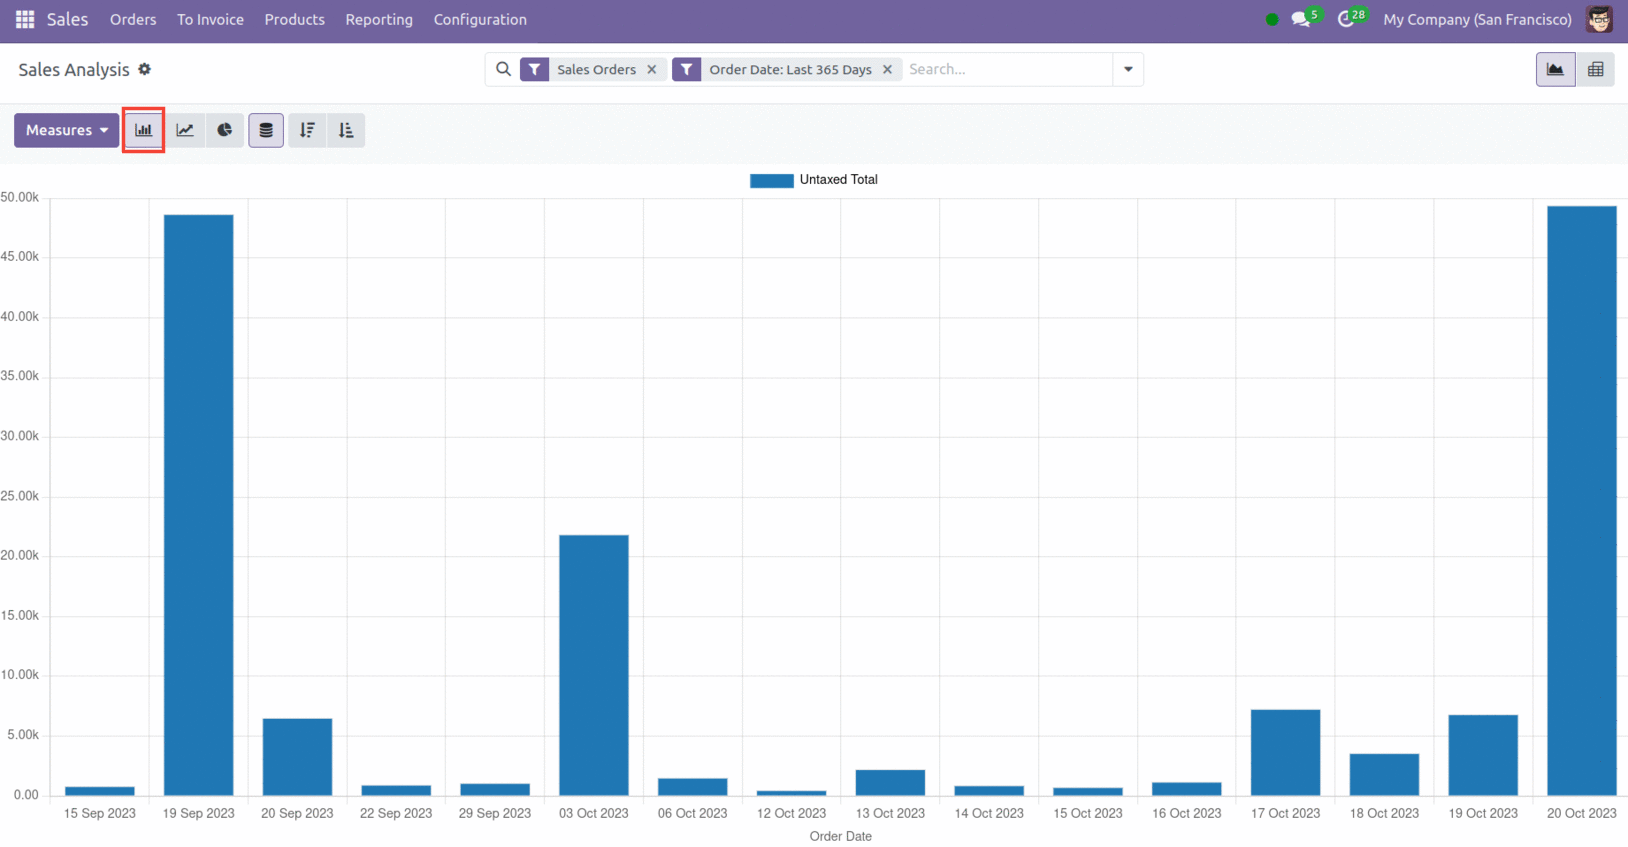
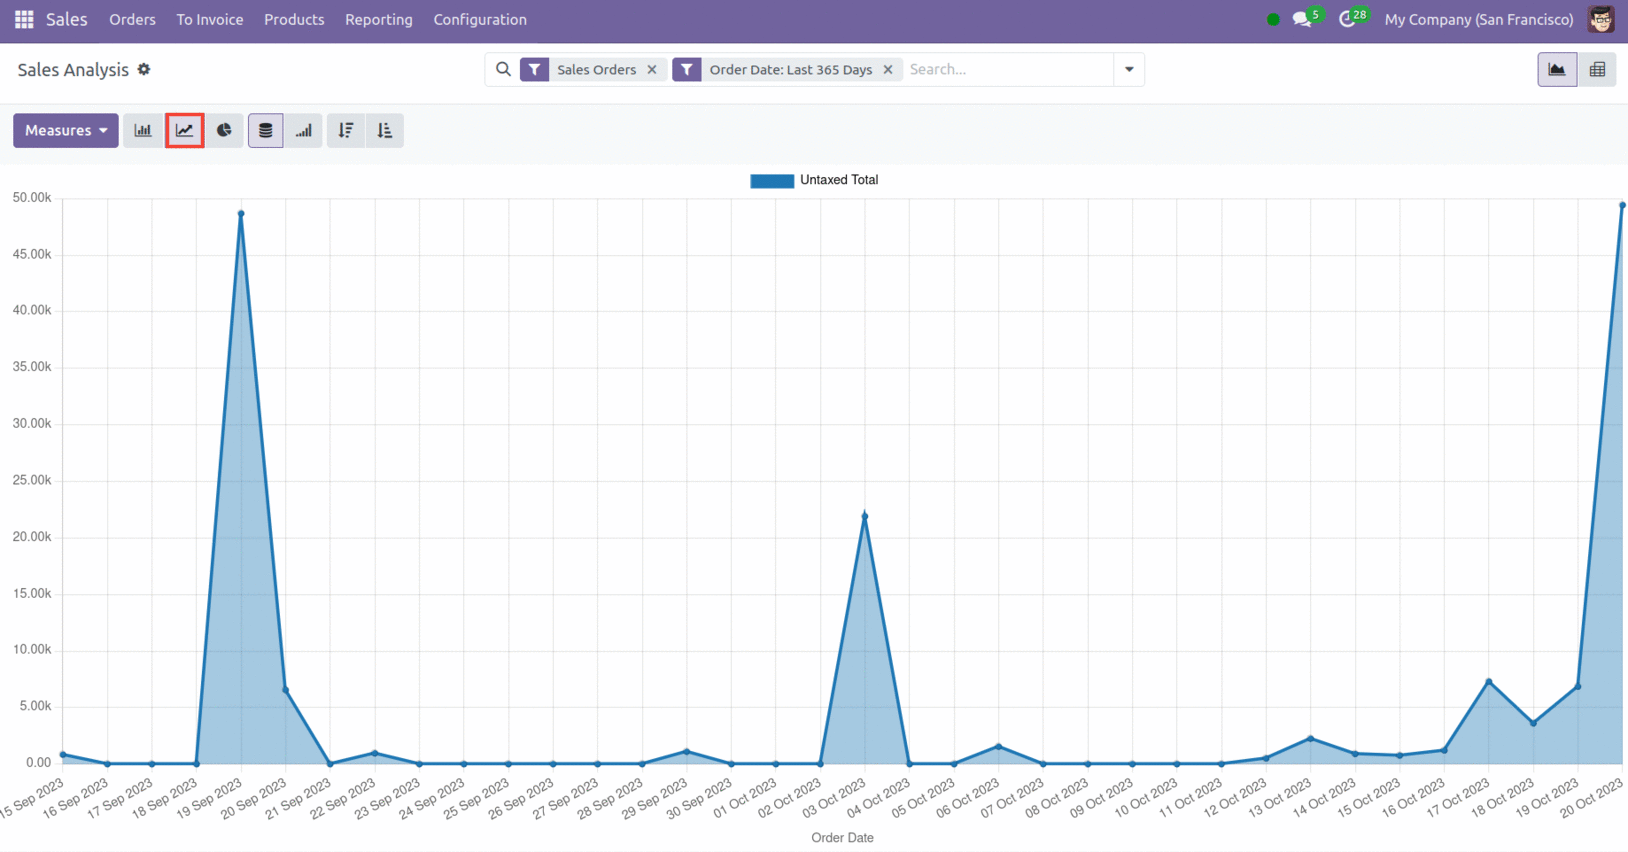
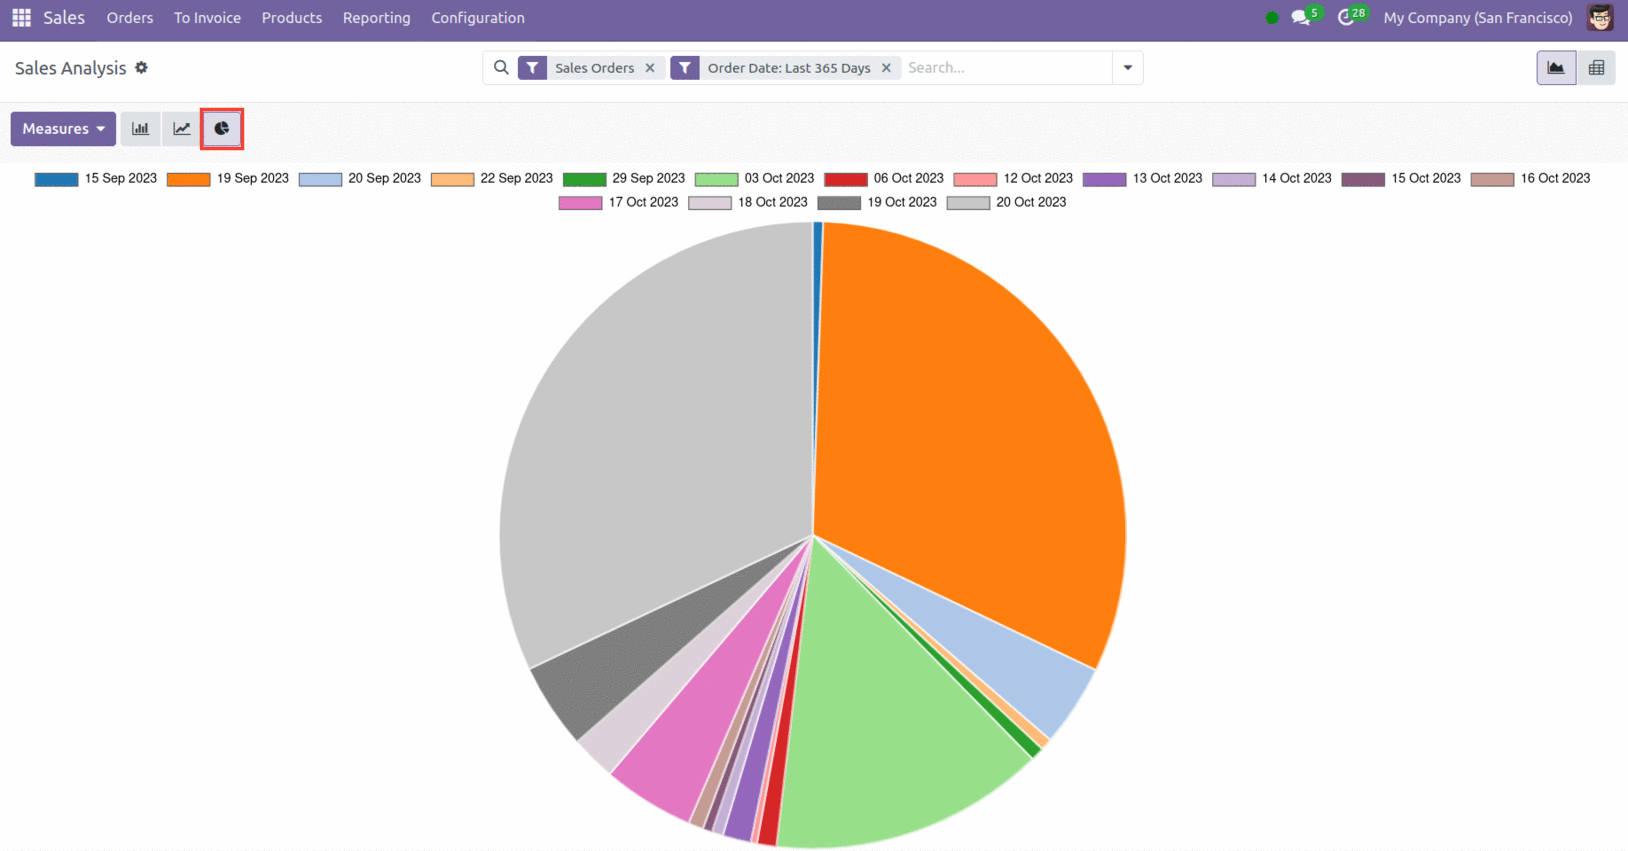
Reports may be seen in both pivot and graphical forms in Odoo 17. Three options are available in the Graphical view: Bar Chart, Line Chart, and Pie Chart. Below are some sample photos for each of these viewpoints.
Bar Chart
Line Chart
Pie Chart
The Odoo 17 Sales module makes it easier for all sales-related operations inside your business to run smoothly. Additionally, it serves as a special mechanism for micromanaging your quotes.