Reporting
You may efficiently create detailed reports of different records defined in its modules, both analytical and quantitative, with Odoo 17 ERP. They create an environment that encourages workers to perform at their highest level and come up with strategic ideas for the expansion of the business. You have the option of using customisable or preset reports when constructing these. Your reports are accurate and easy to read thanks to the Filters and Group By choices.
Stock
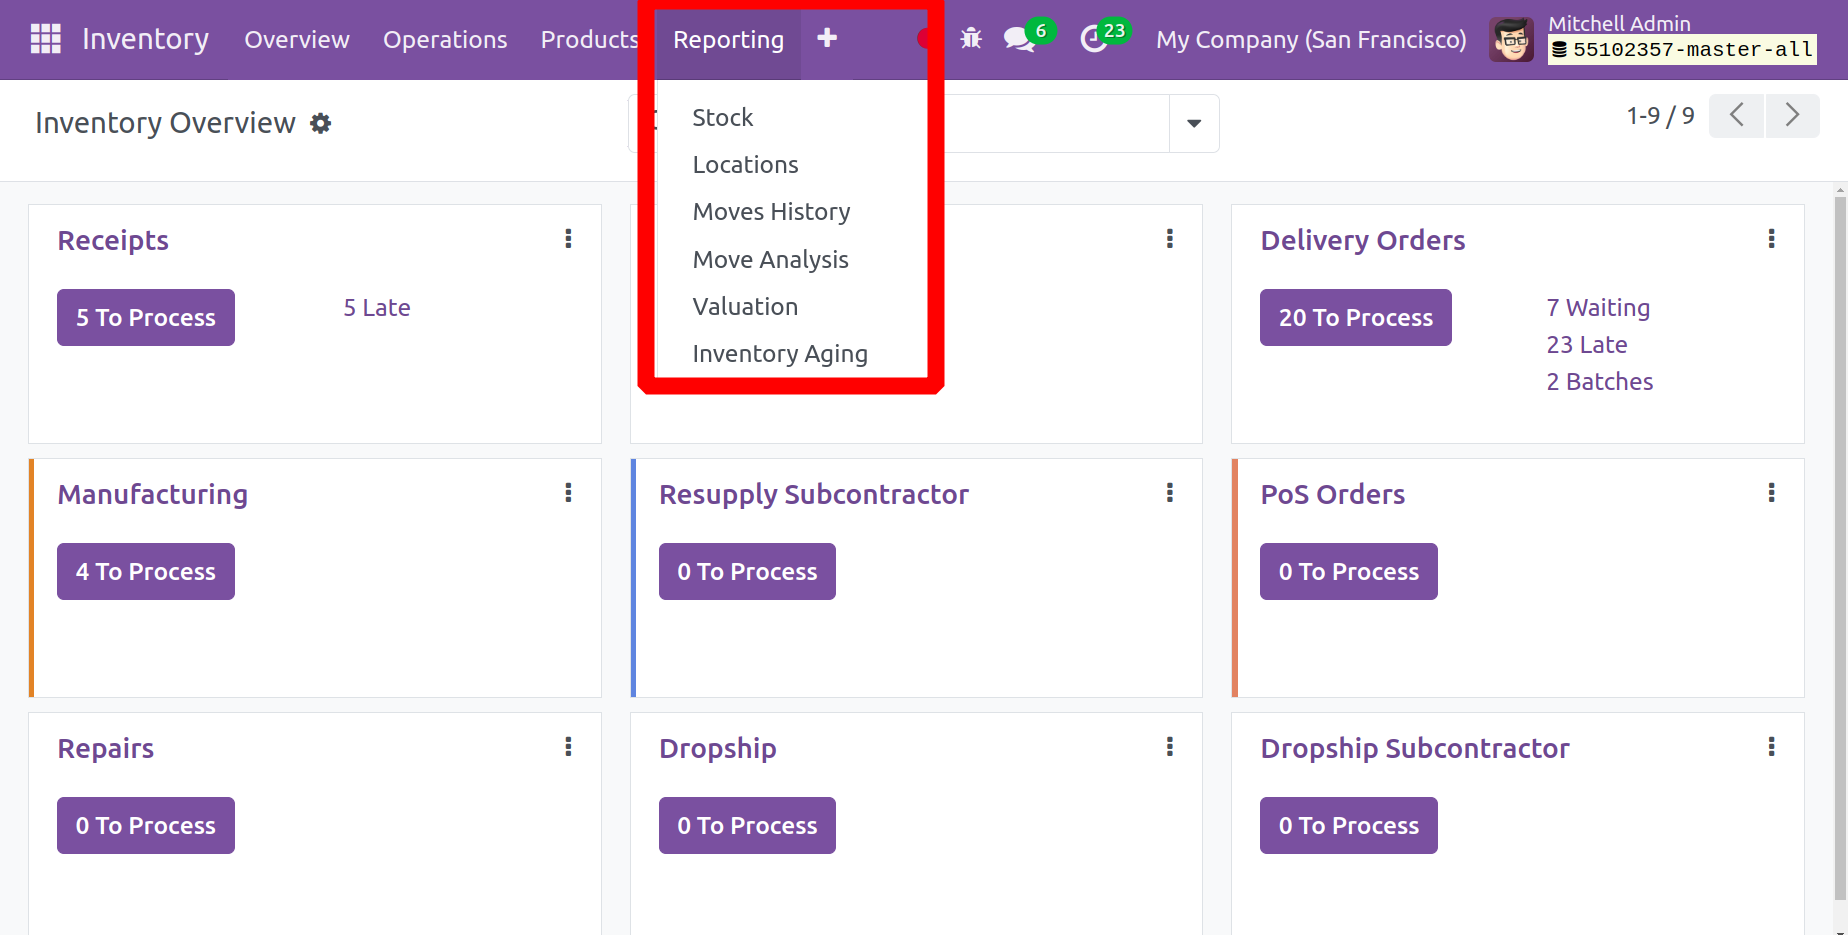
Every stock that is configured in the system is shown in the Stock window, along with information such as the Product name, Unit Cost, and Total Value. Here are the product quantities that are now on hand, free to use (the amount of products that are on hand less the quantity that is reserved), incoming (the amount of scheduled incoming goods), outgoing (the amount of planned outgoing goods), and unit (of measurement). Click the Stock menu in the Reporting tab dropdown list to open this window.
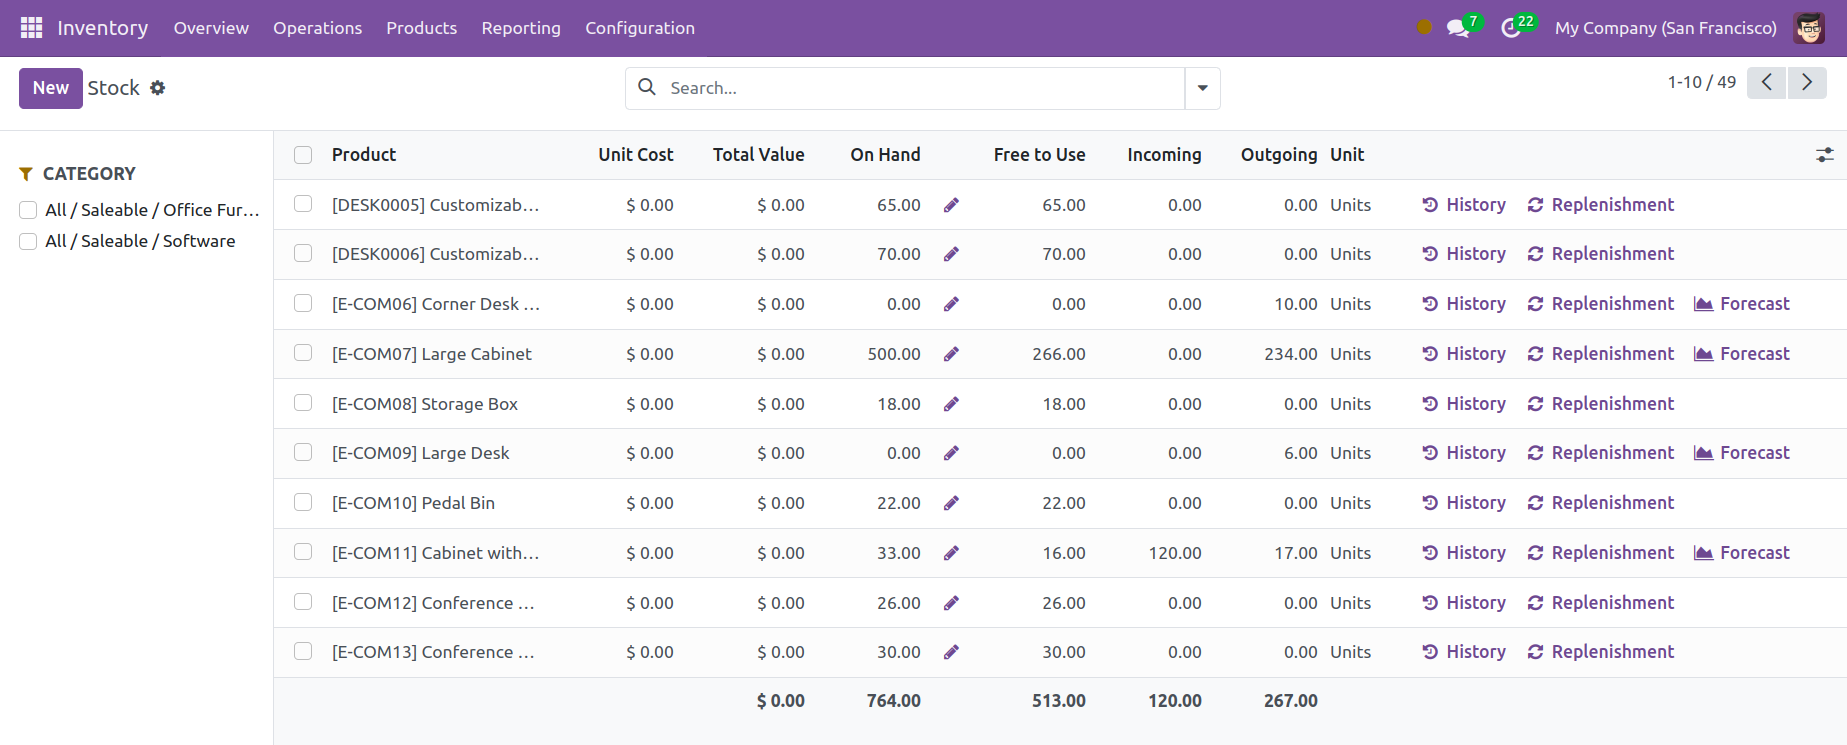
The system's product listings' classification criteria will show up on this window's left side. Warehouses and Category are two examples of these divisions in this section. You can tick the box next to a category to filter the stock based on that particular category. Only the products that match that description will be displayed in the resulting window. In a similar vein, you can choose a warehouse to have its related items displayed in the window.
To filter and group the products according to various criteria, use the Filters, Group By, and Favorites choices.
You can access other areas by clicking on the button located in the upper right corner of the window, as illustrated below.
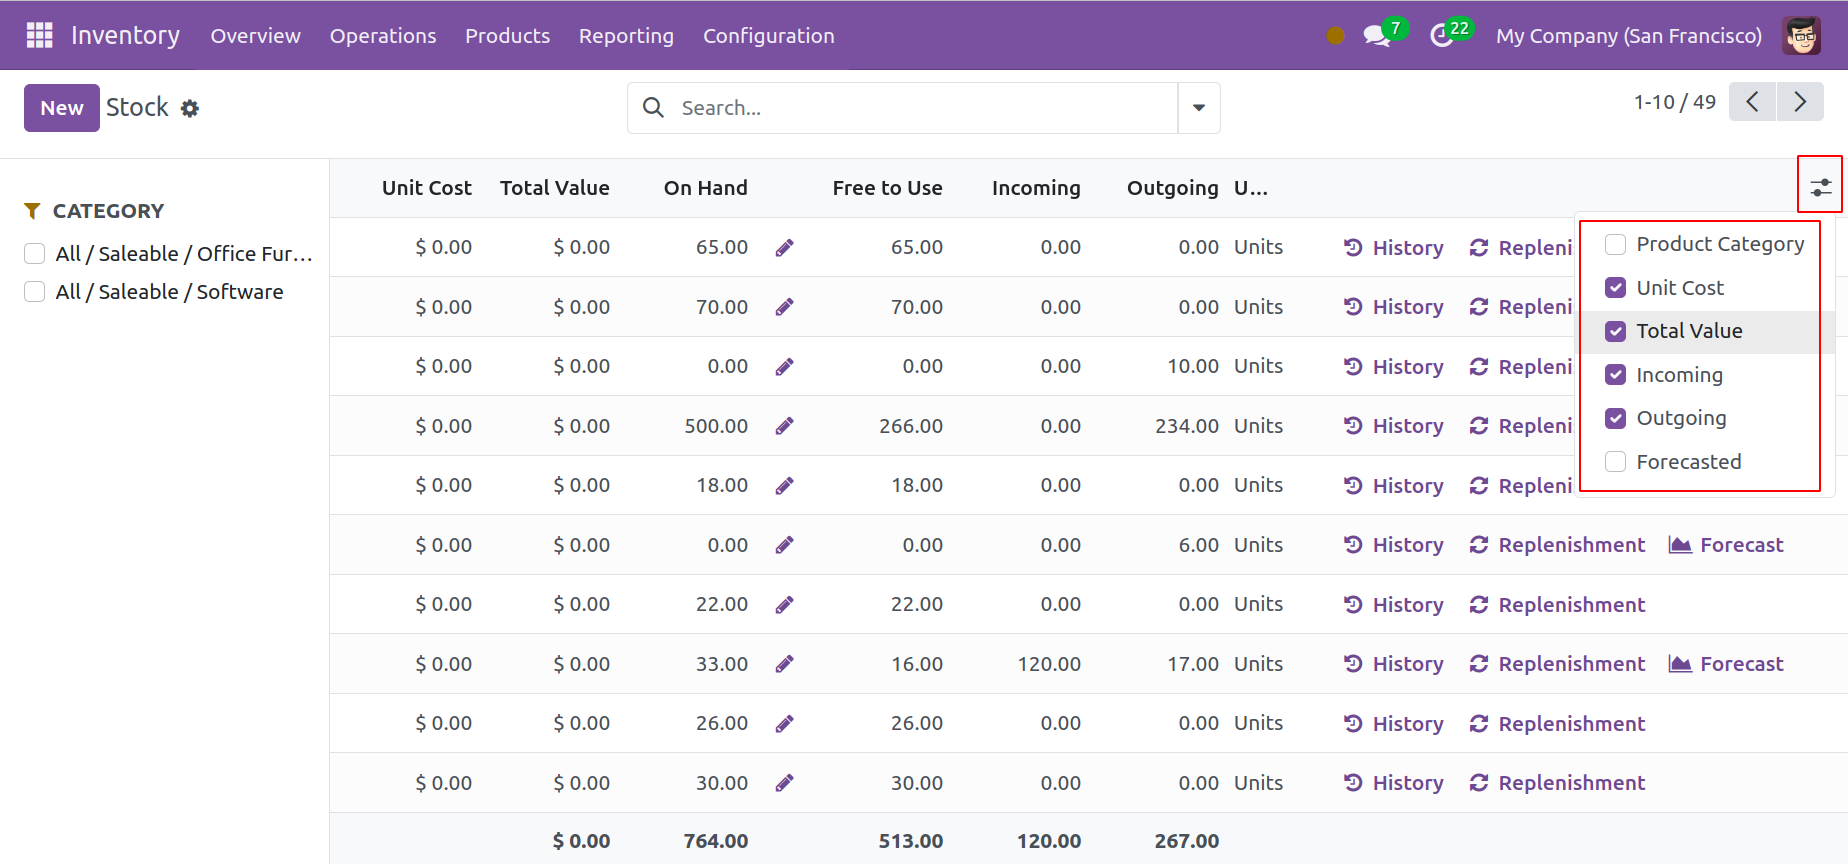
If you would like the details of any field to show up in the window, you can check the required fields.
Location
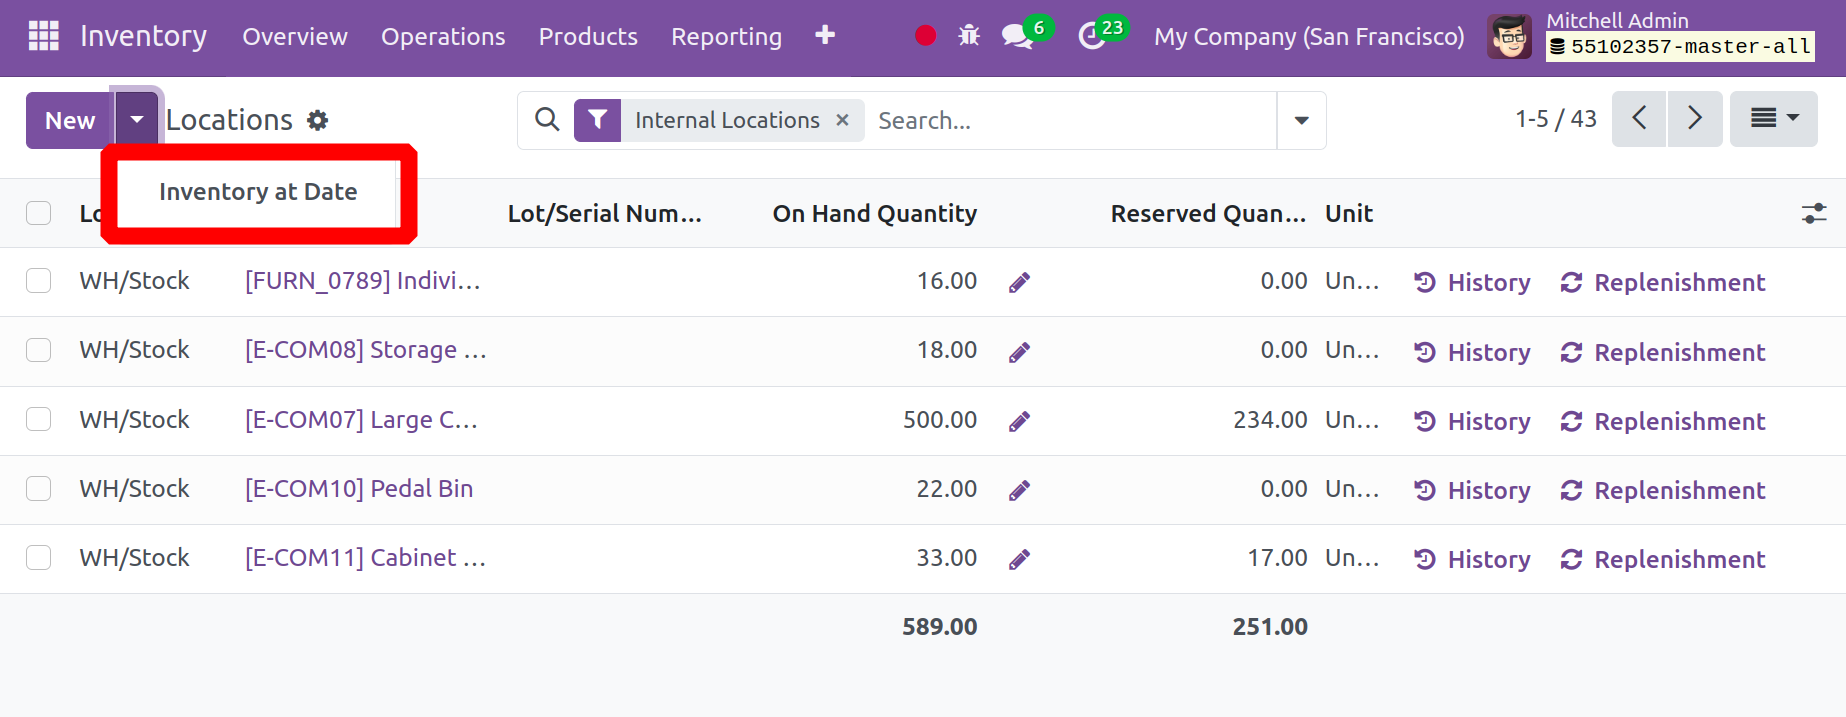
Below is a list view of the Location report. This section shows the Lot/Serial Number, Product, Package, Location, On Hand Quantity, and Reserved Quantity.
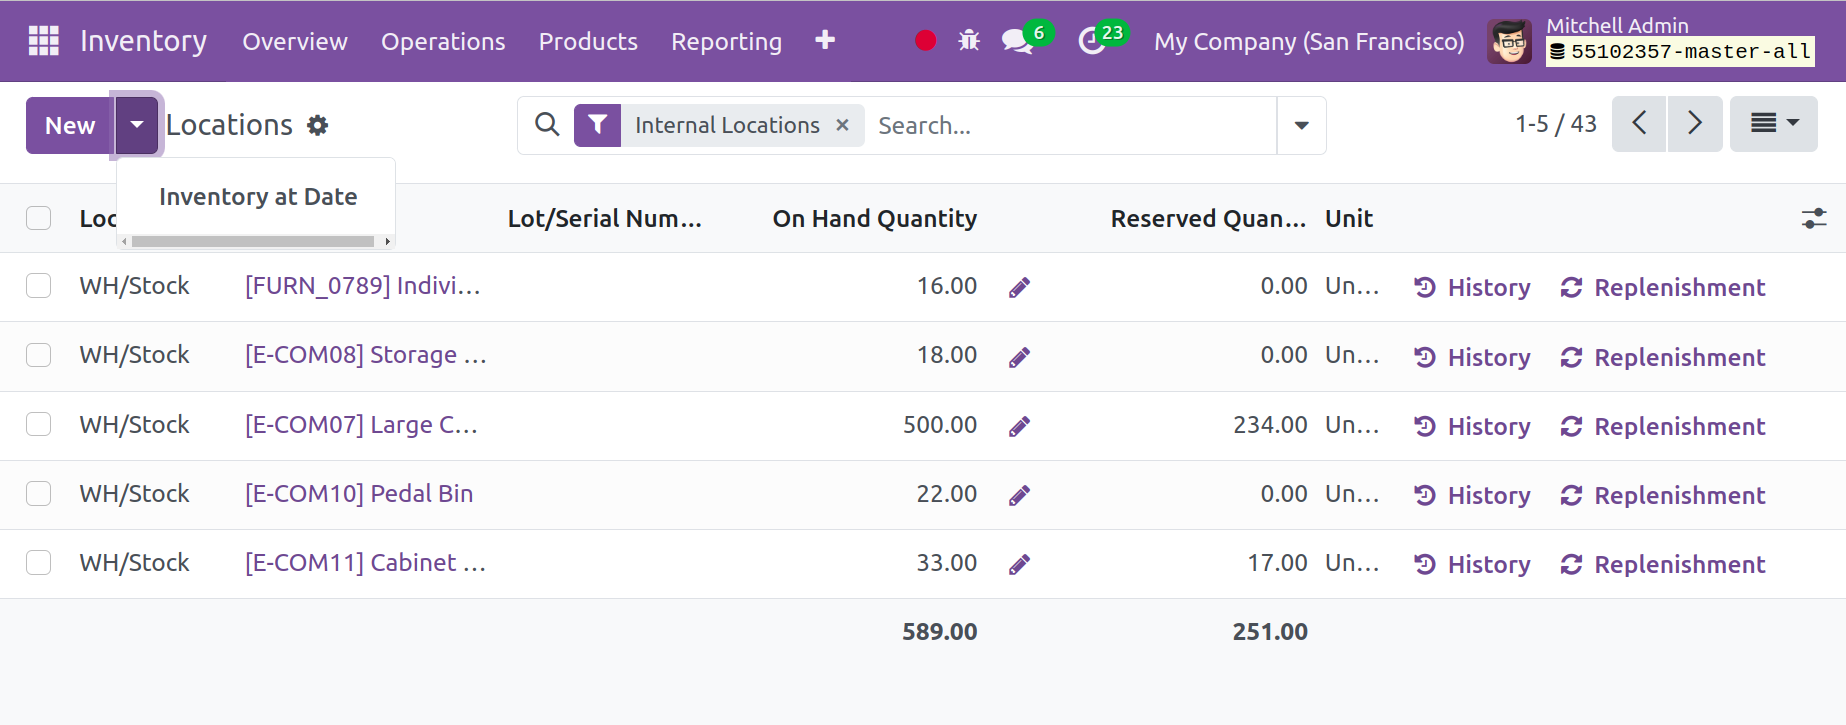
As previously mentioned, from the Location reporting window, you can use the Replenishment button to refill the products and the History button to check the history of the moves. The inventory can be adjusted by using the smart button on the screen.
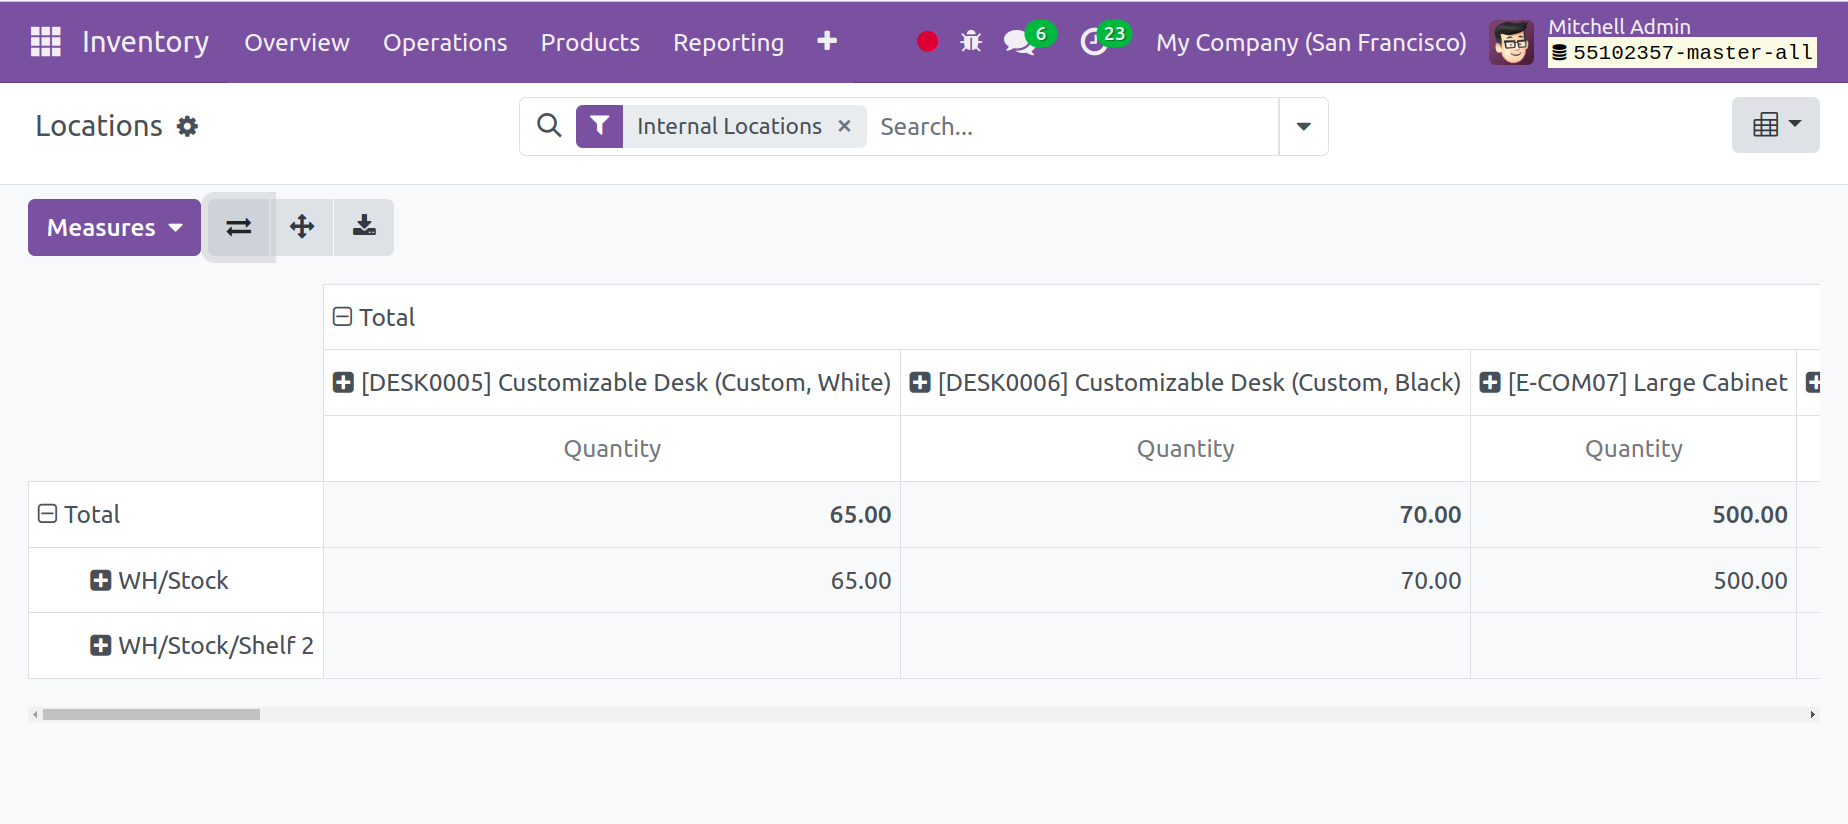
This screenshot shows the Locations in a pivot table view. You can utilize Measures, Filters, and Group By options to tailor reports to your specific requirements. Alternatively, you can switch this window to a graphical view and modify the graph's type to a bar, pie, or line chart, whichever you want.
To view the Stock Valuation Report for every product, navigate to the menu and pick Inventory at the Date.
A pop-up window will appear and ask you to choose a date so that you can get the value report that day. Once the date has been mentioned, click the Confirm button. Odoo17 will show you the stock valuation data for the selected date on your screen.

The following details are included in a stock valuation report for a product: product name, reference, variations, sales price, cost, quantity on hand, quantity forecasted, etc.
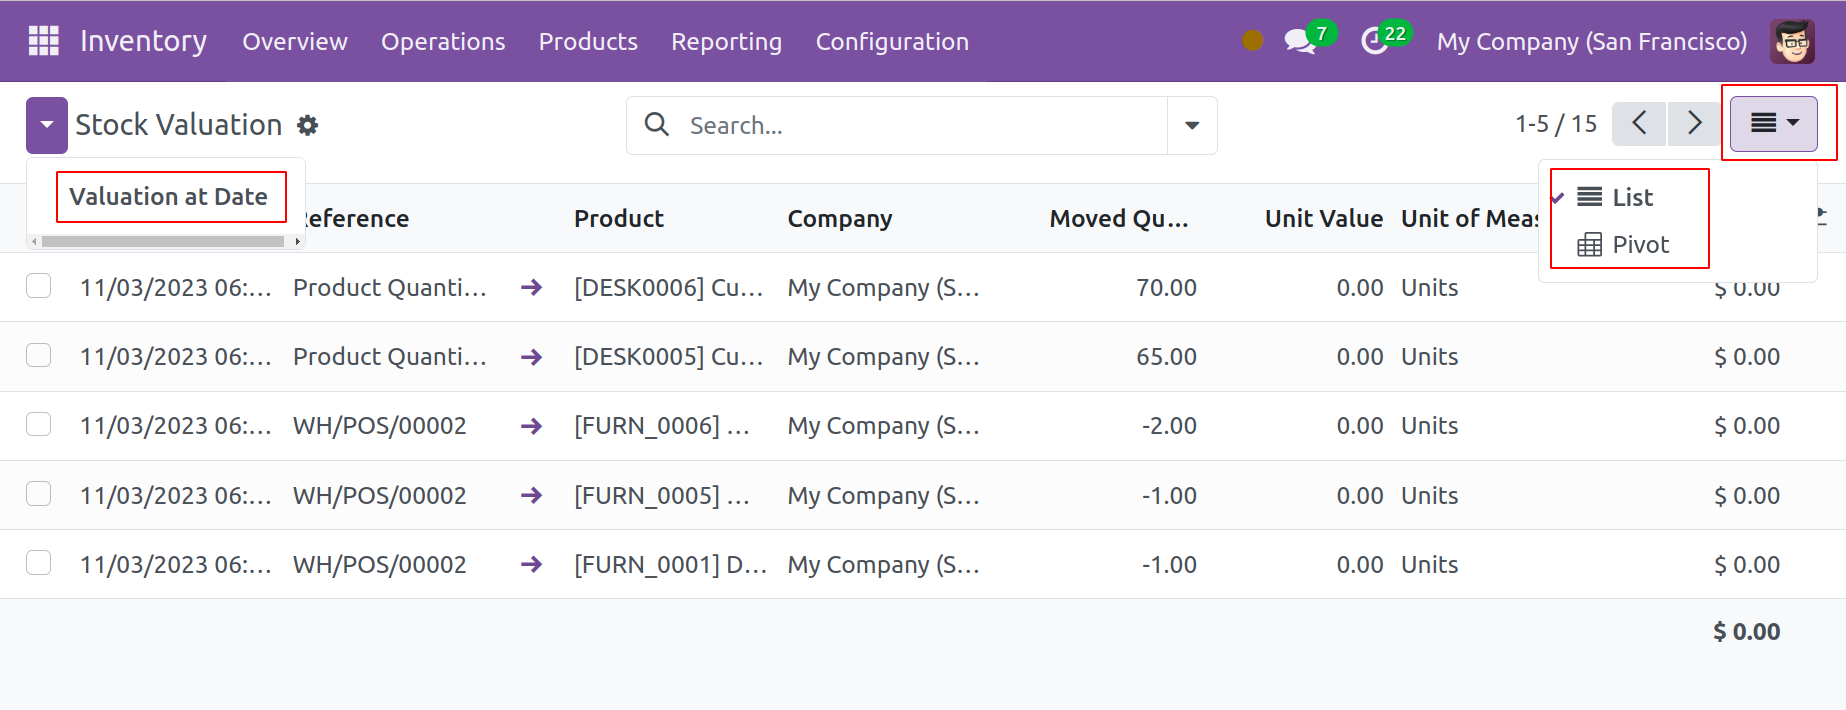
You can get the stock valuation report for the items as of a particular date by choosing the Valuation at Date option.
Moves History
The Moves History window keeps thorough records of every action pertaining to product movements. Choose "Moves History" from the Reports menu.
Details such as the product name, lot/serial number, date of movement, and reference are displayed in the window. Quantity, Unit, Status, From (the place the product is moved from), and To (the location the product is moved to).
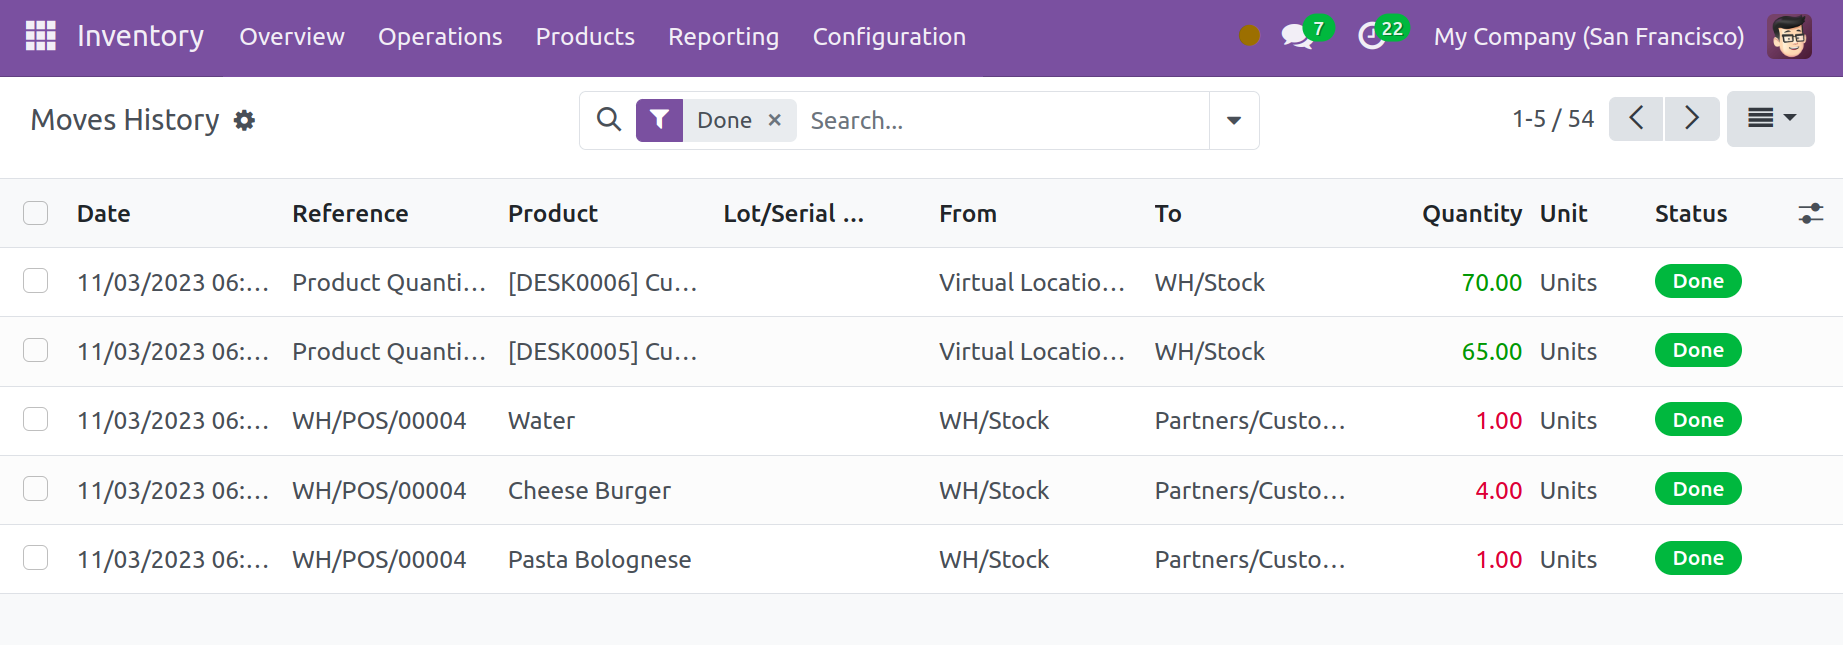
Utilizing "Filters," "Group By," and "Favorites," you can apply different standards and identify the necessary data. By choosing the corresponding icon from the window's upper right corner, you can see this window in the List, Kanban, or Pivot modes.
Moves Analysis
Additionally comparable are Moves analysis and Moves history. The products' movement is shown here based on stock levels. The movement will be seen in this case using the Pivot View.
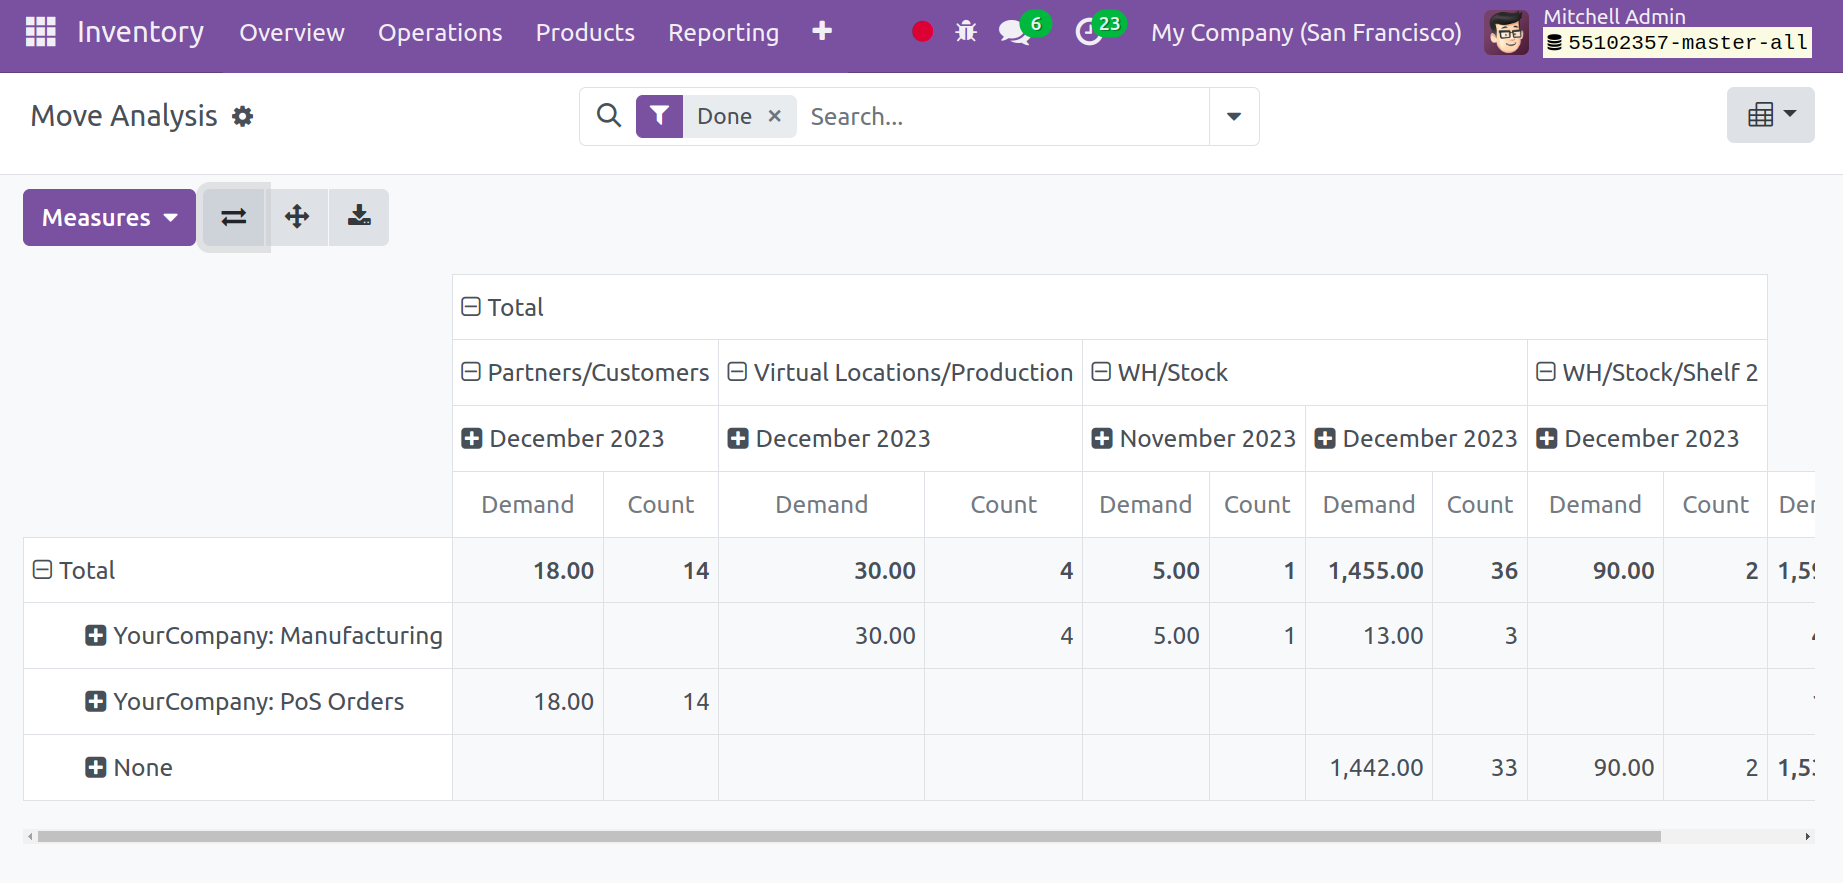
There are several views available as well, like the List View, Kanban View, and Graph View.
Valuation
Under the Valuation option, you can perform different types of stock valuations. From the Reporting tab's selection list, choose "Valuation."
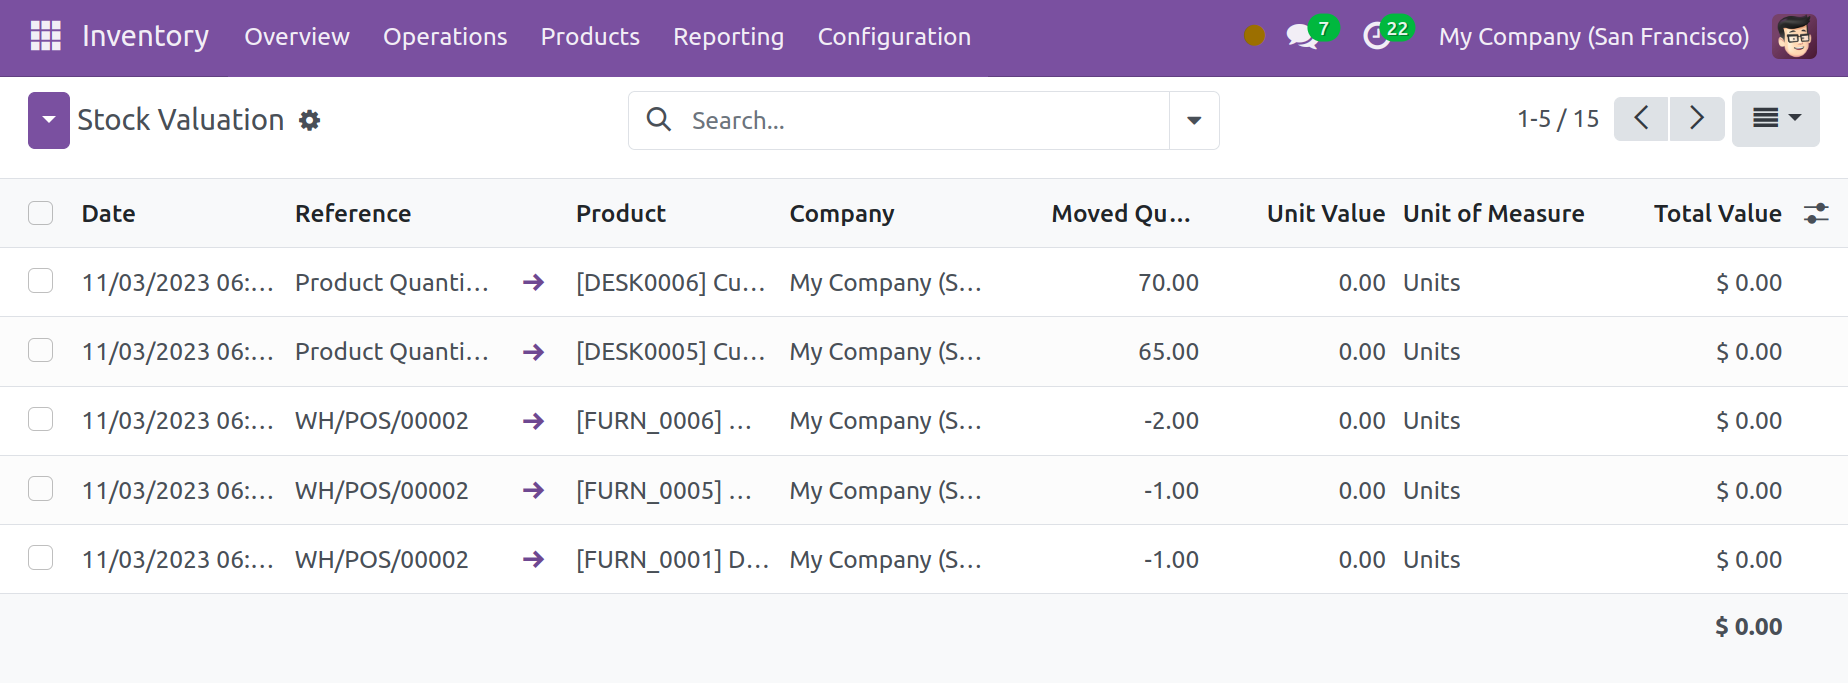
Information such as Date, Reference, Product, Company, Moved Quantity, Unit Value, Remaining Quantity, Unit of Measure, and Remaining Value are listed in the Stock Valuation pane. Filters, Group By, and Favourites allow you to categorize and order these records. Additionally, the window has List and Pivot as its two view modes. Select the necessary mode by clicking on the corresponding icons, as indicated below.
Inventory Aging
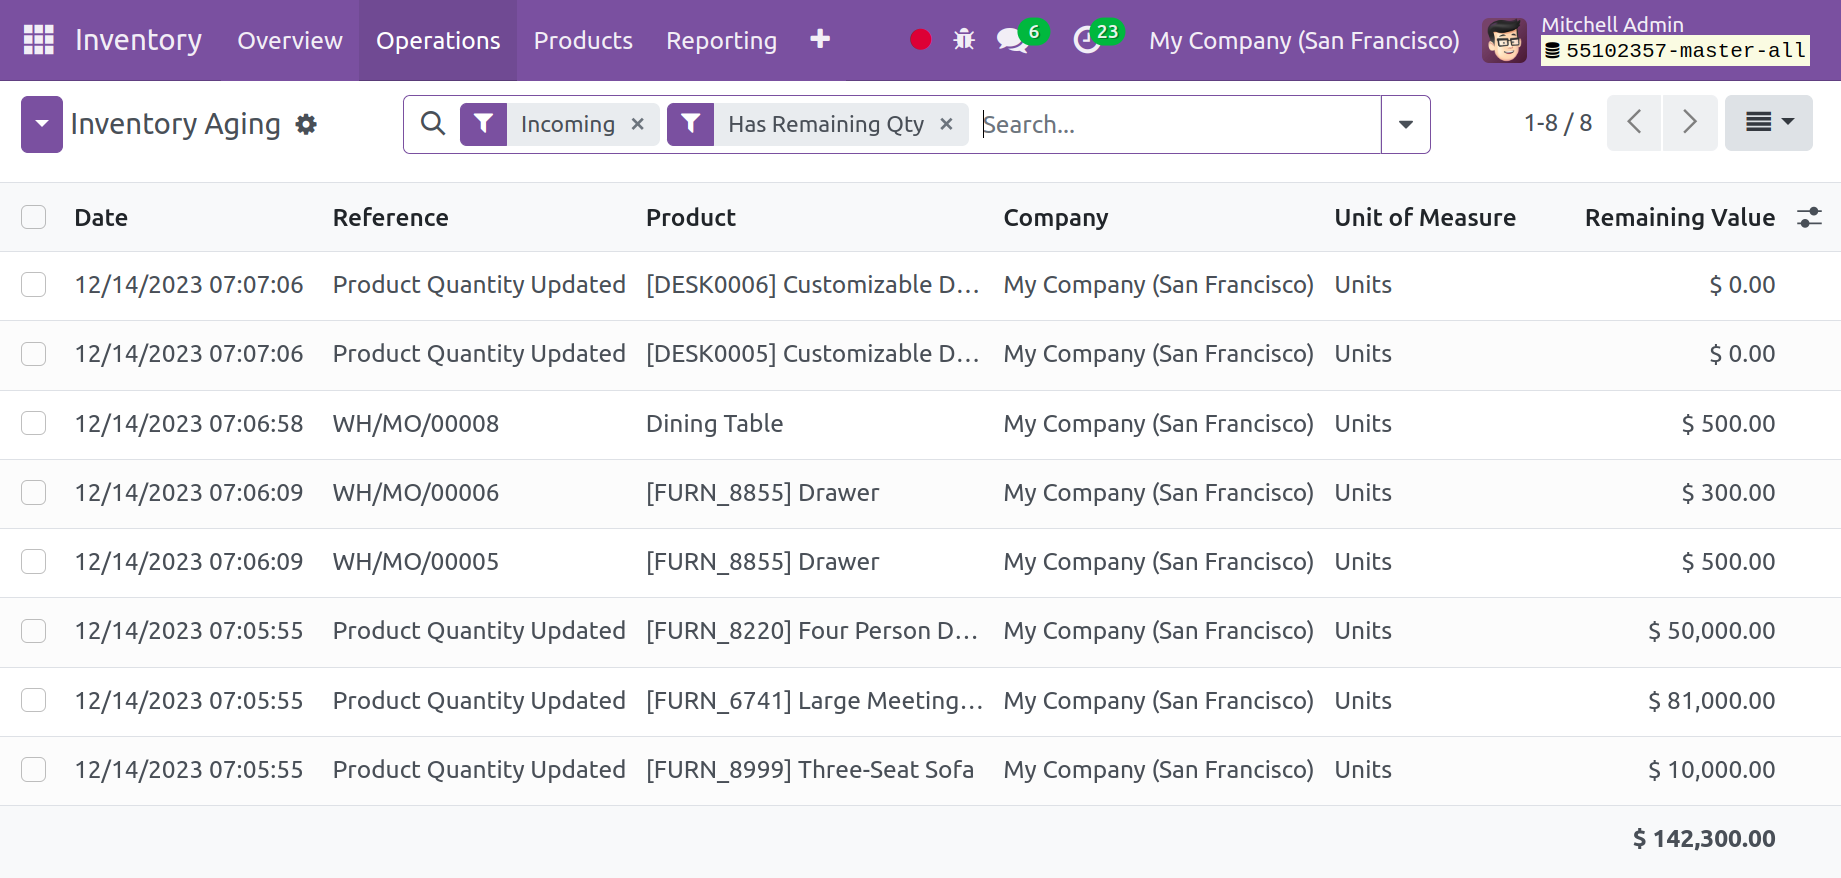
The Inventory Aging report shows a list of inbound products. This report allows the user to view the details of aged stocks. The list provides the user with details about the product, date of transfer, quantity moved, quantity left, unit value, and unit of measure, among other information.
We wrap up our in-depth examination of the Inventory module with this functionality. This module can be used to monitor and control every aspect of your business's inventory management.