Reporting
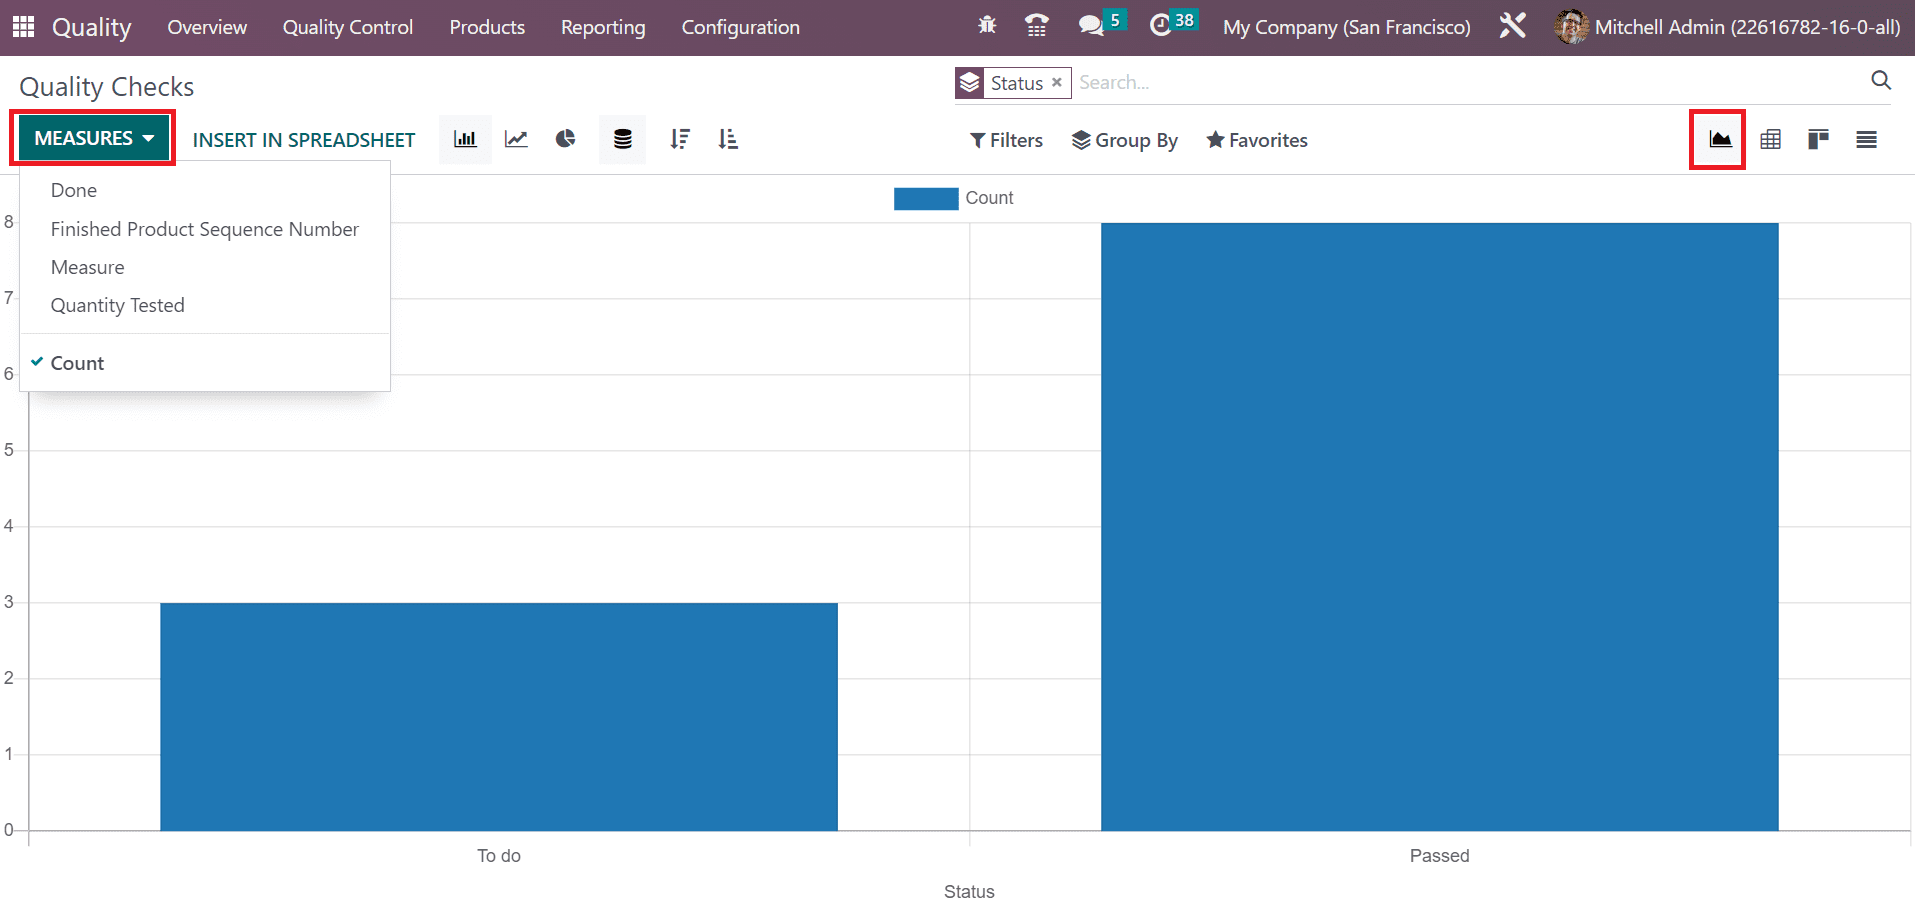
As per the recorded actions, Odoo 16 provides various reporting features for each module. Reporting feature of the Odoo 16 Quality module shows Quality Checks and Quality Alert reports. Choose Quality Checks in the Reporting tab, and a graphical representation of the quality check status is viewable in the new window. In the Graph view, you can see Status data on X-axis, and Y-axis depicts the Count. Users can apply various measures to graphical representation to analyze quality checks. By selecting the MEASURE icon, we can use the values such as Done, Measure, Finished Product Sequence Number, and Quantity Tested.
Here, quality checks are grouped based on the status. Other ways to group quality checks are based on Product, Finished Lot/Serial, Add Custom Group, Control Point, and Team. By choosing the Group menu, you can apply these values to the graph.
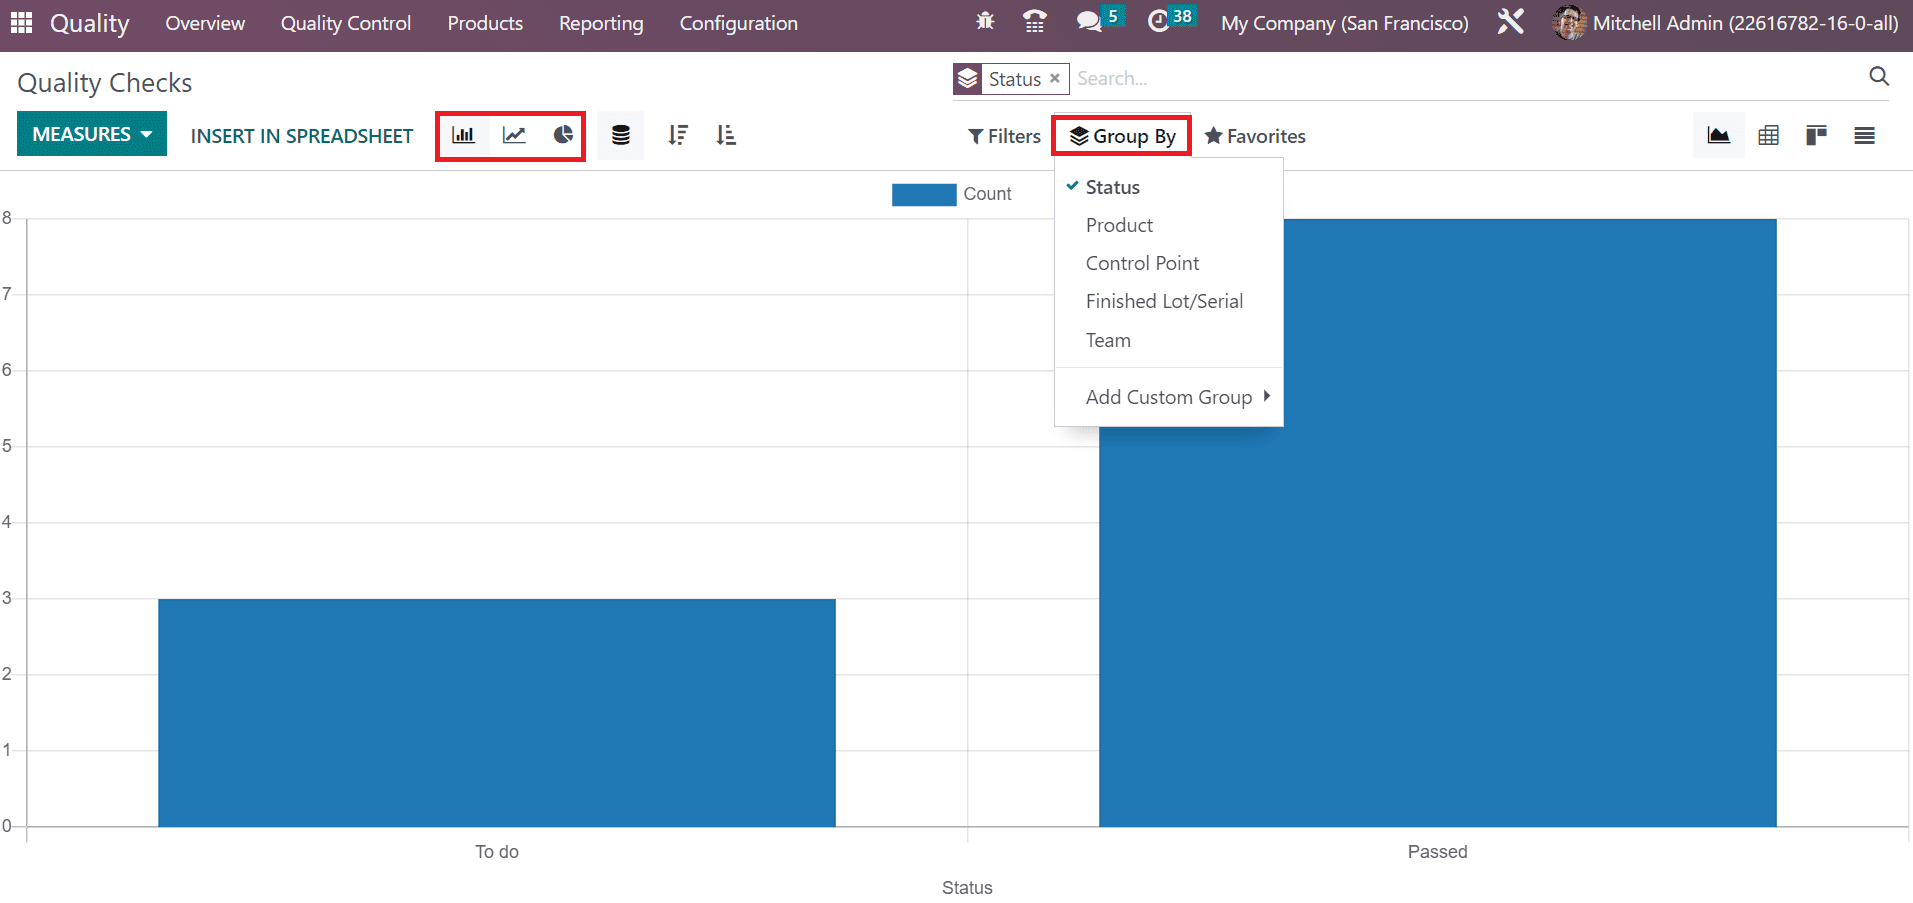
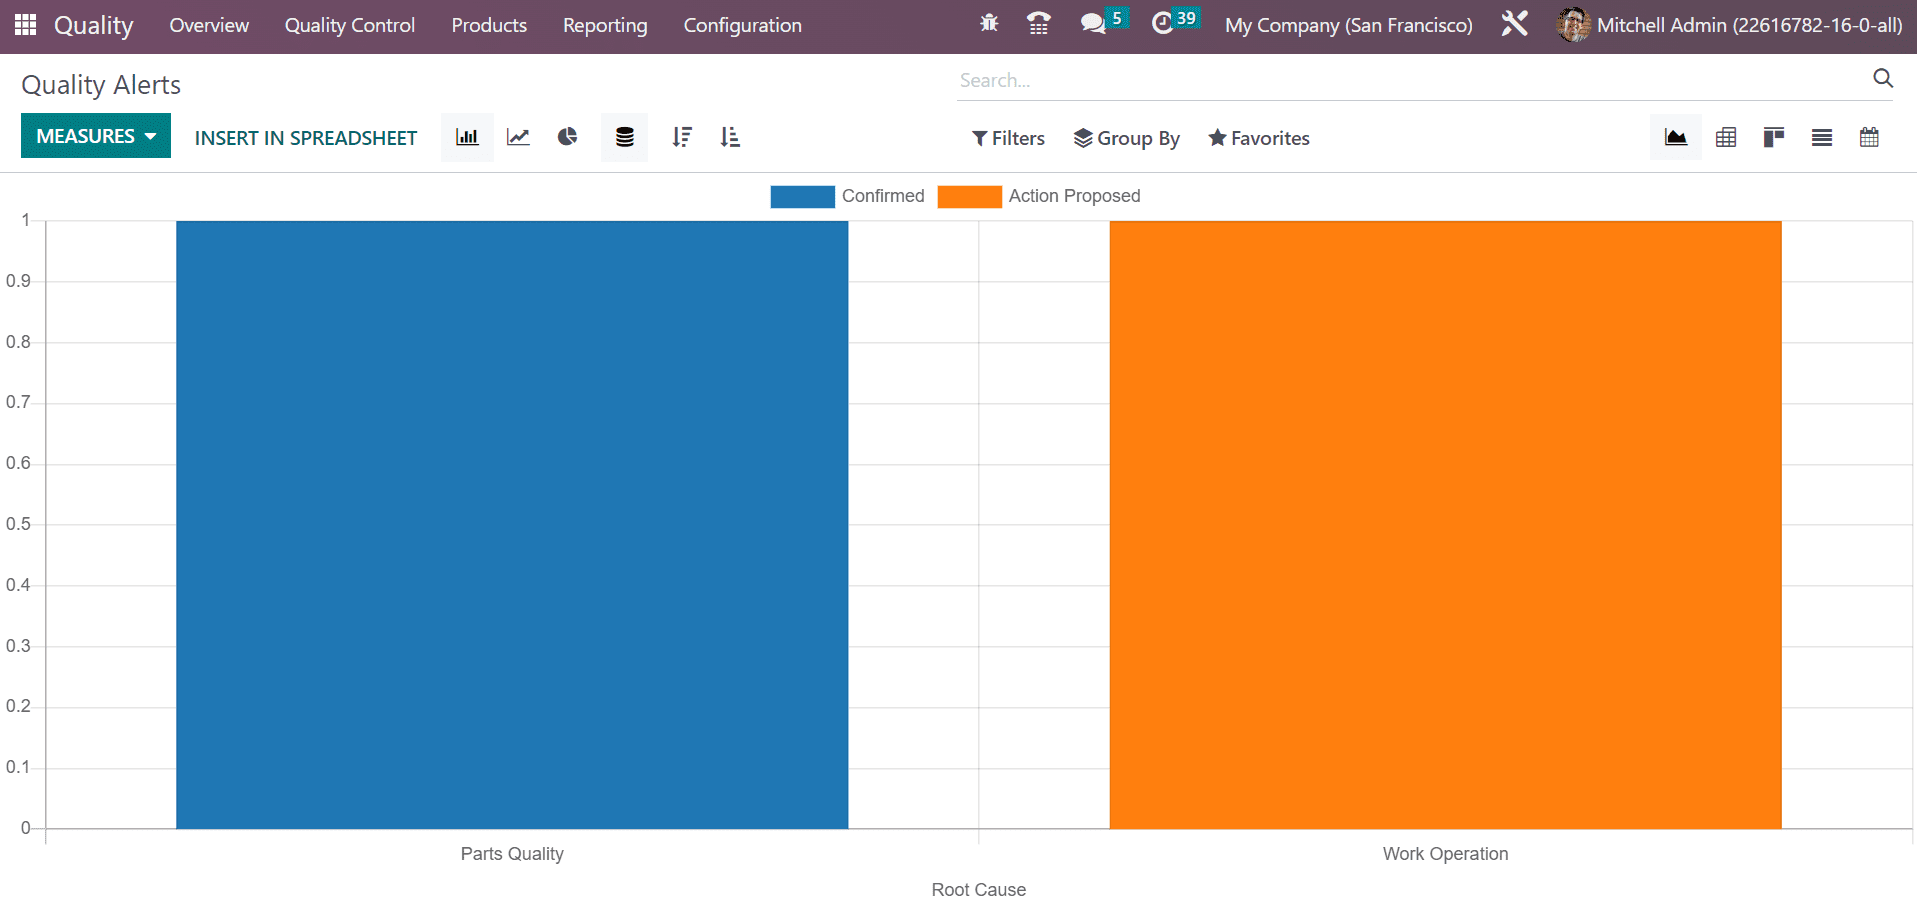
You can also view the graph in the form of line, pie, and bar chart formats. To evaluate Alerts, select the Quality Alerts menu in Reporting tab. On the displayed page, the quality alert report is entirely based on the root cause. Once analyzing the report, you can identify the issues and take corrective measures.
Quality Worksheet Templates
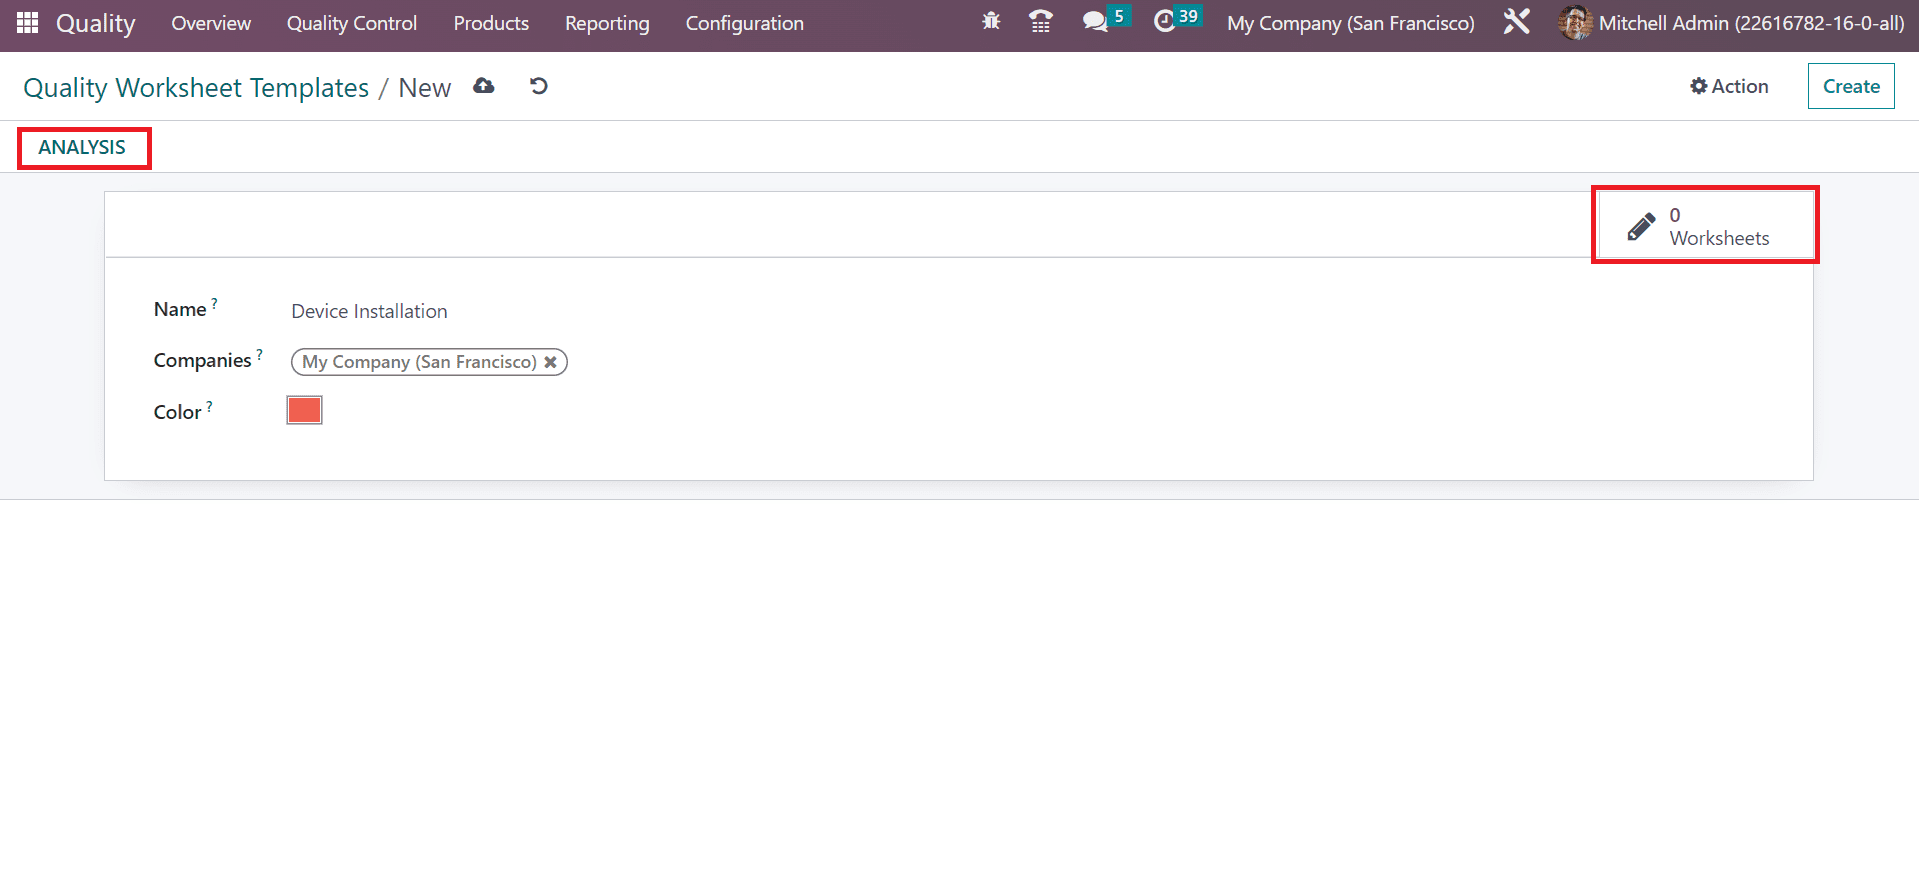
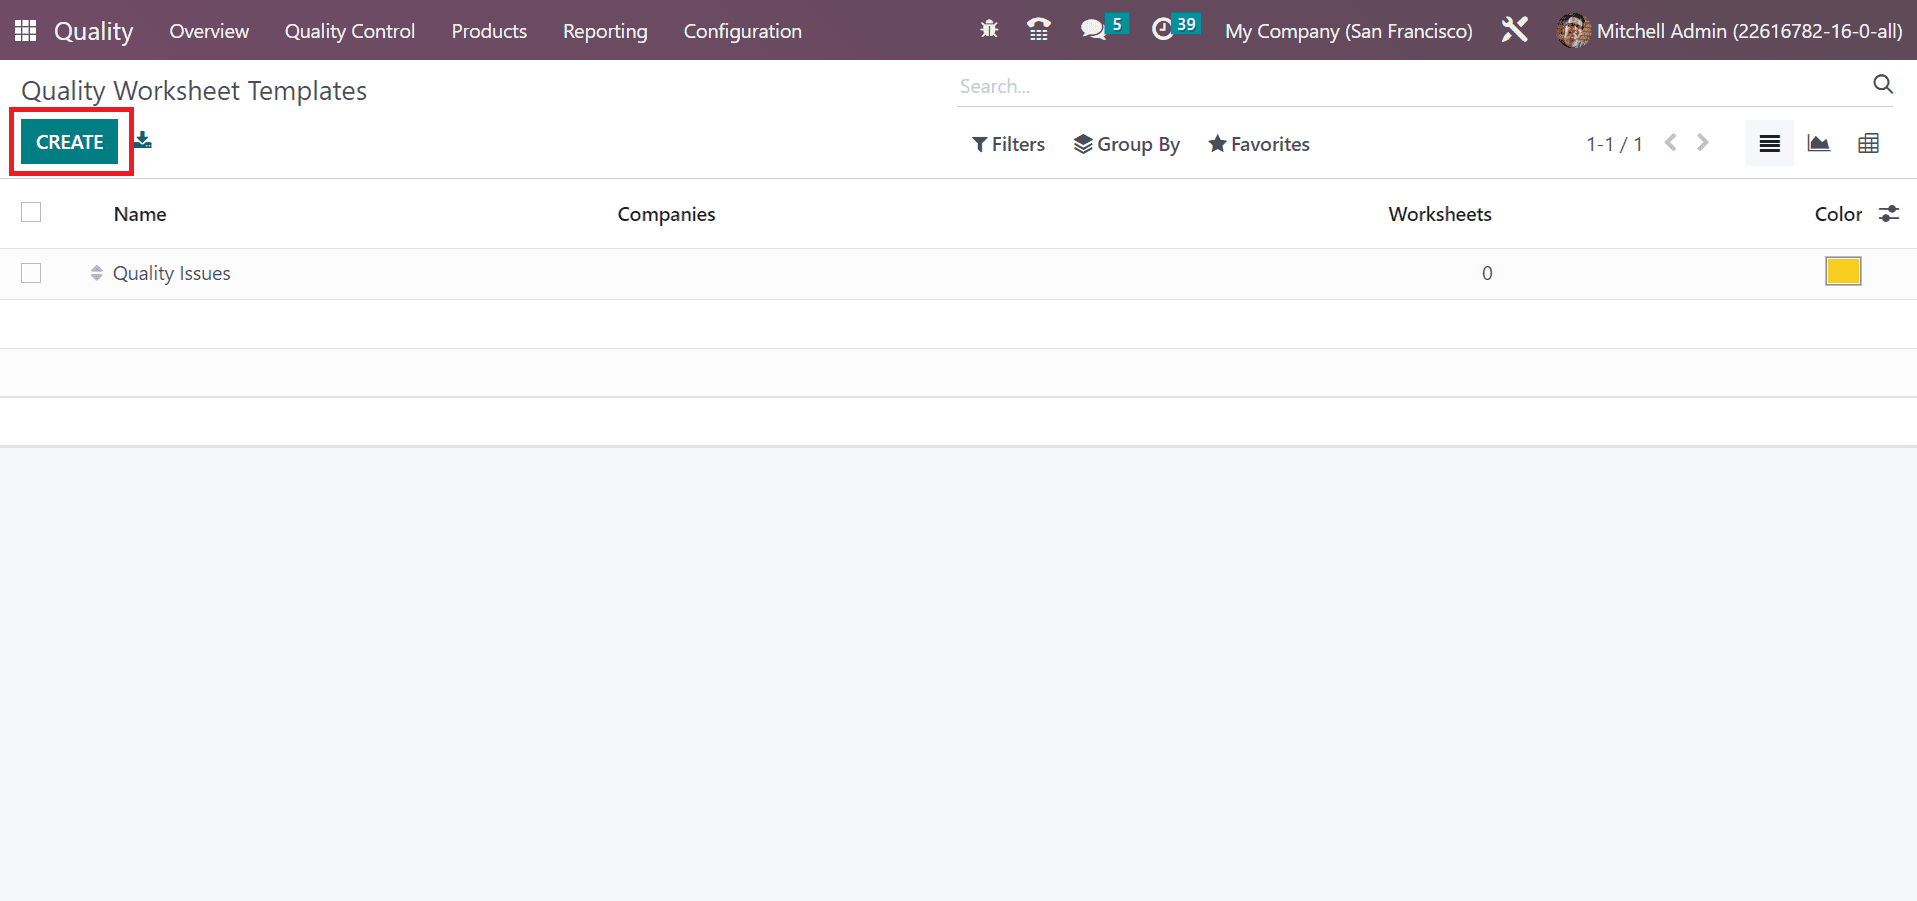
You can configure worksheets in the quality module within the Configuration tab. All pre-configured worksheet templates are visible in the open windows and show data such as Name, Color, Companies, and Worksheets. We can design a new template by selecting the CREATE button.
On the open page, enter the template title in the Name field and pick the name of the companies. Afterward, apply a color to identify the template quickly based on your requirements.
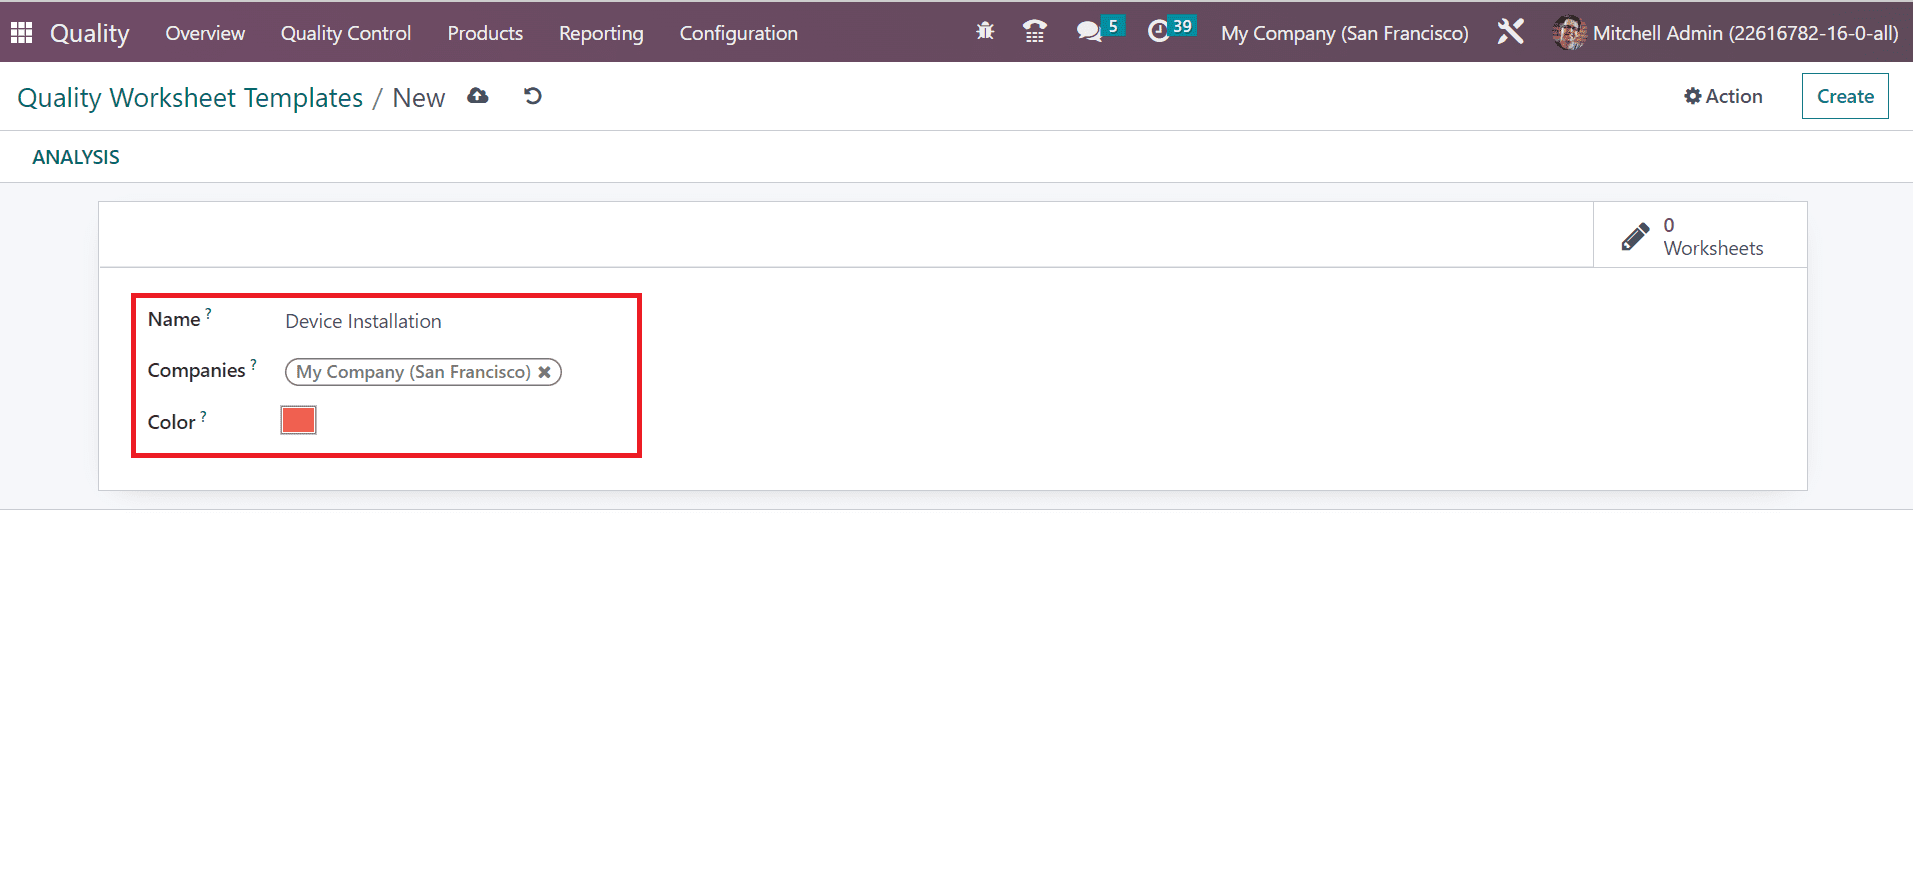
The count of all worksheets concerning your template is acquirable in the Worksheets smart menu. Also, it is possible to evaluate the worksheet in a detailed manner by choosing the ANALYSIS icon.
