Reporting
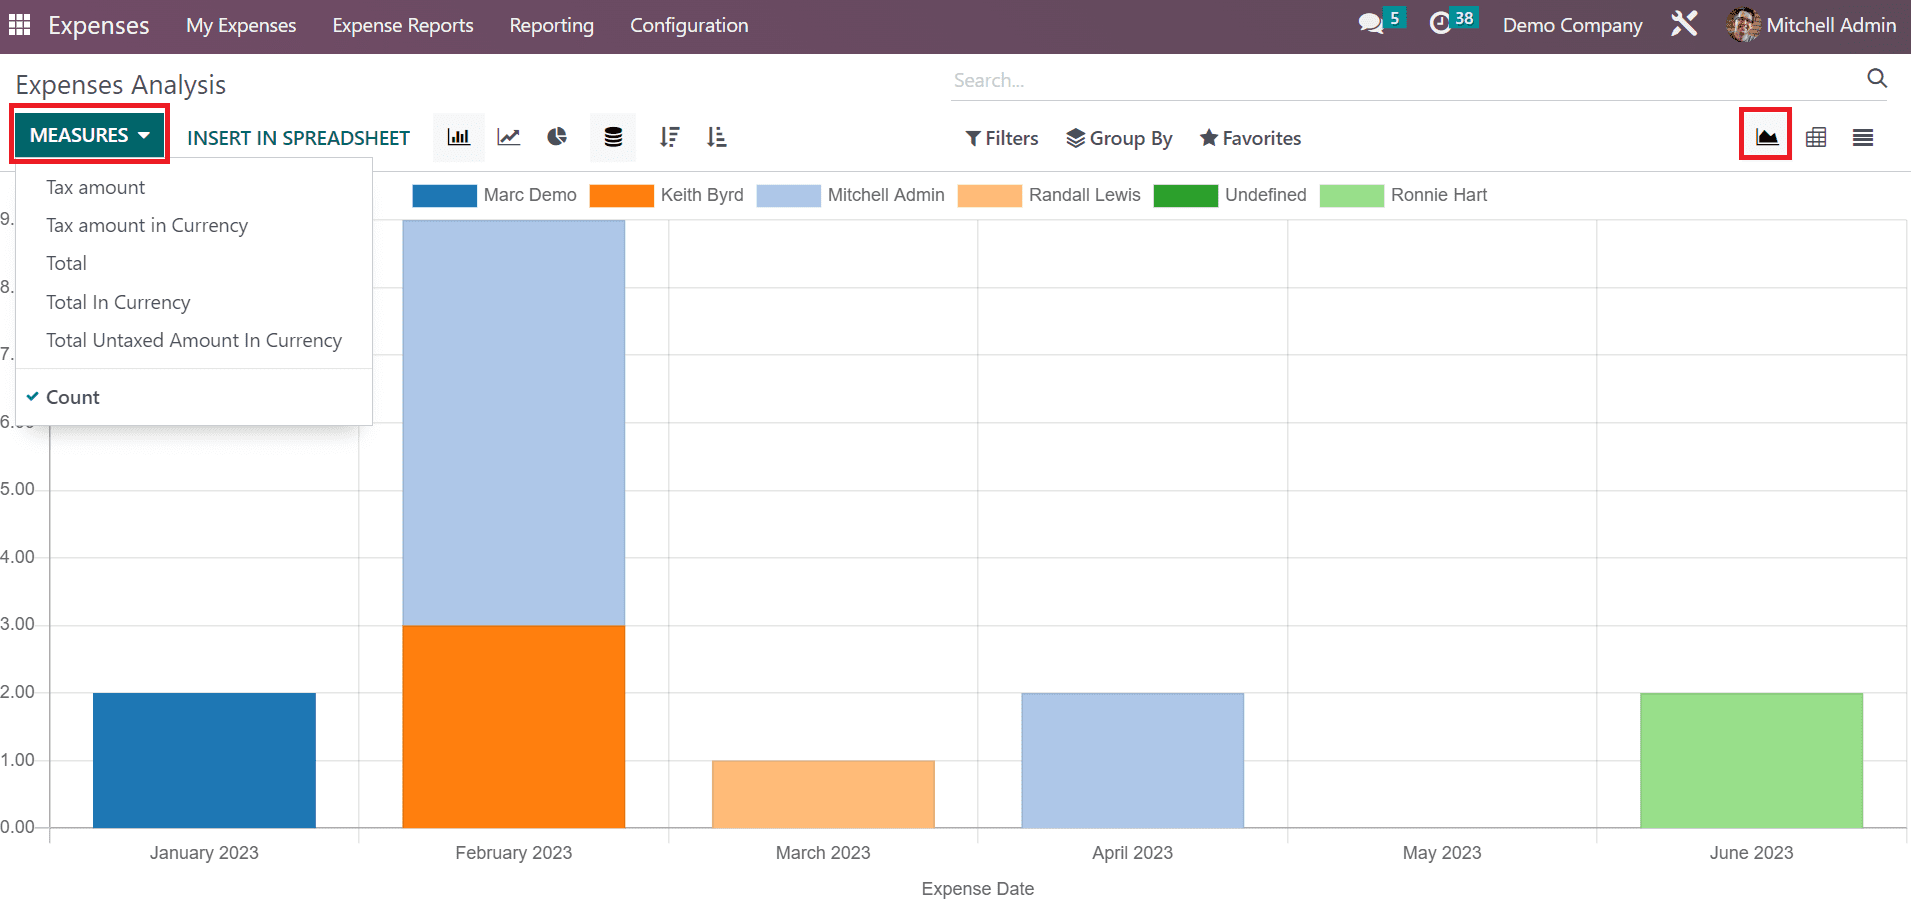
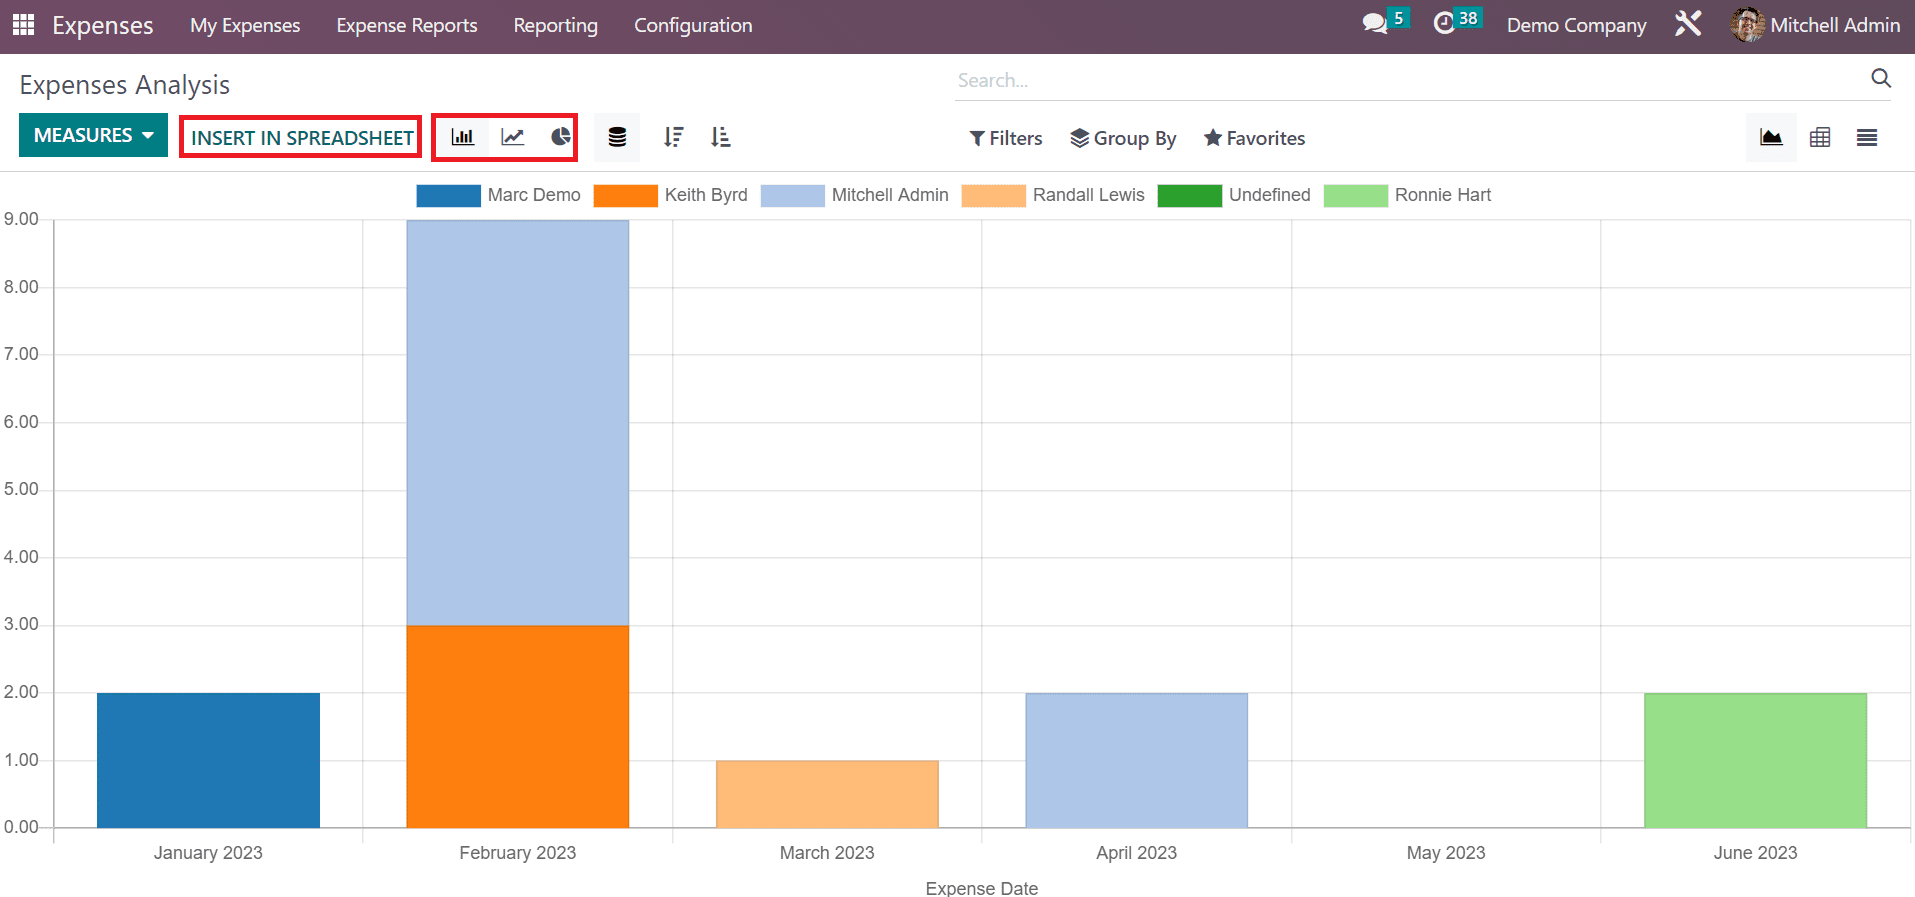
We can evaluate company expenses with the use of Reporting feature in the Odoo 16 Expenses. By choosing the Expenses Analysis menu in Reporting, a graphical representation appears before you. The Graph view denotes the Expense Date on X-axis, and Y-axis points out the total expense count. We can view the expense count of each employee in various colors on the graph. Also, you can apply different values to the graph after clicking on the MEASURES icon.

A few of the measures include Tax amount, Total, Total untaxed amount in currency, tax amount in currency, count, and more. It is possible to view the graph in bar, pie, and line chart formats. You can click the INSERT IN SPREADSHEET button if you need to upload a file.

We get an overview of company expenses through the reporting feature of Odoo 16.