Reporting
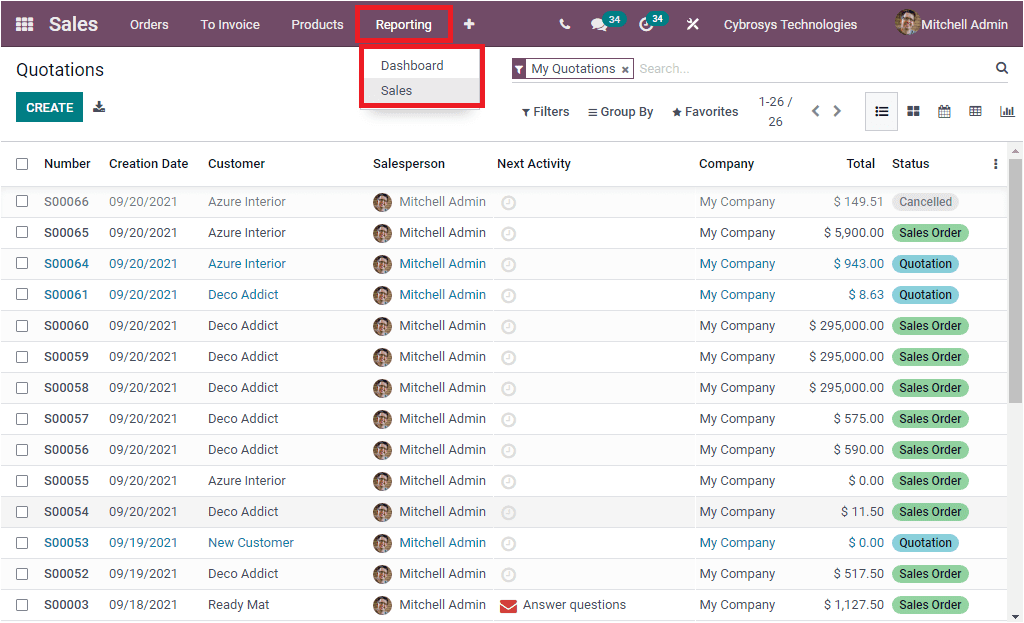
Regular analysis of your sales operations and other activities in your business are very essential for a sustainable and successful business. Odoo ERP gives so much prominents for the report management in its each and every module. In the Sales module also, you can view a separate Report tab to manage your Sales report management. Under the Report tab, you can view the Dashboard and the Sales menu as shown in the below image.

Dashboard
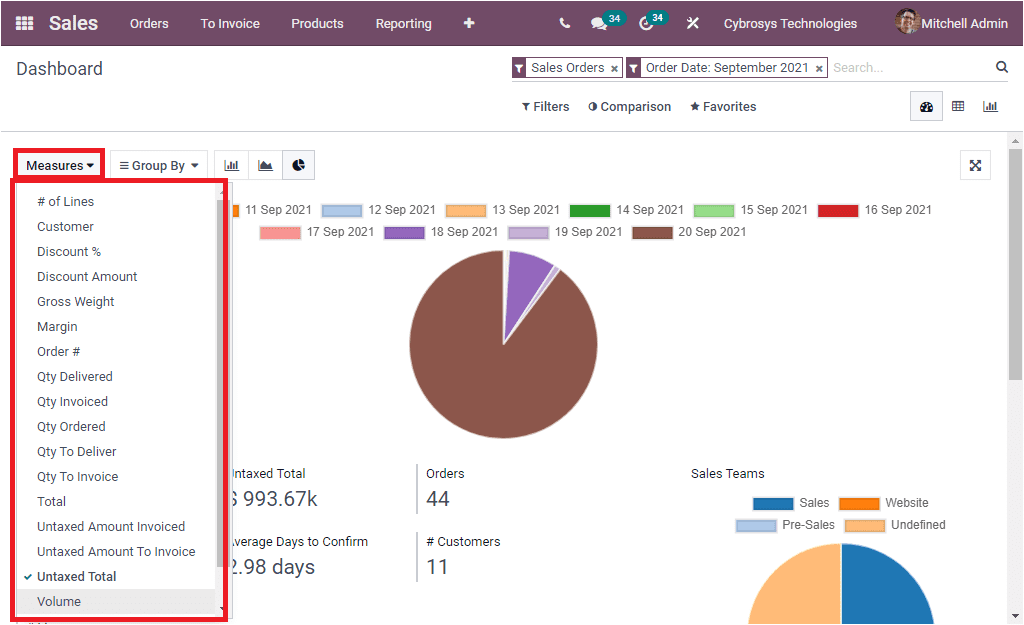
Under the Dashboard menu, you can view all of your dashboard reports. The window depicts a report in Graphical, Pivot and Dashboard view. Here you can view the Total Sales, Untaxed Total, Orders, Average Order, Average Days to Confirm, total number of customers and the Order lines. In addition the Sales Team can also be done with a graphical pie chart view. The Dashboard analysis can be done in Bar, Line and Pie Chart. Moreover, the report can be viewed in various measures by clicking on the MEASURES tab available.

The report can be generated on the basis of the measures such as Of Lines, Customers, Discount percentage, Discount Amount, Gross Weight, Margin, Order, Quantity Delivered, Quantity Invoiced, Quantity to Deliver, Quantity to Invoice, Total, Untaxed Amount Invoiced, Untaxed Amount to Invoice, Untaxed Total, Volume and Count. And the reports on various measures can be viewed in Bar Chart, Line Chart and Pie Chart.
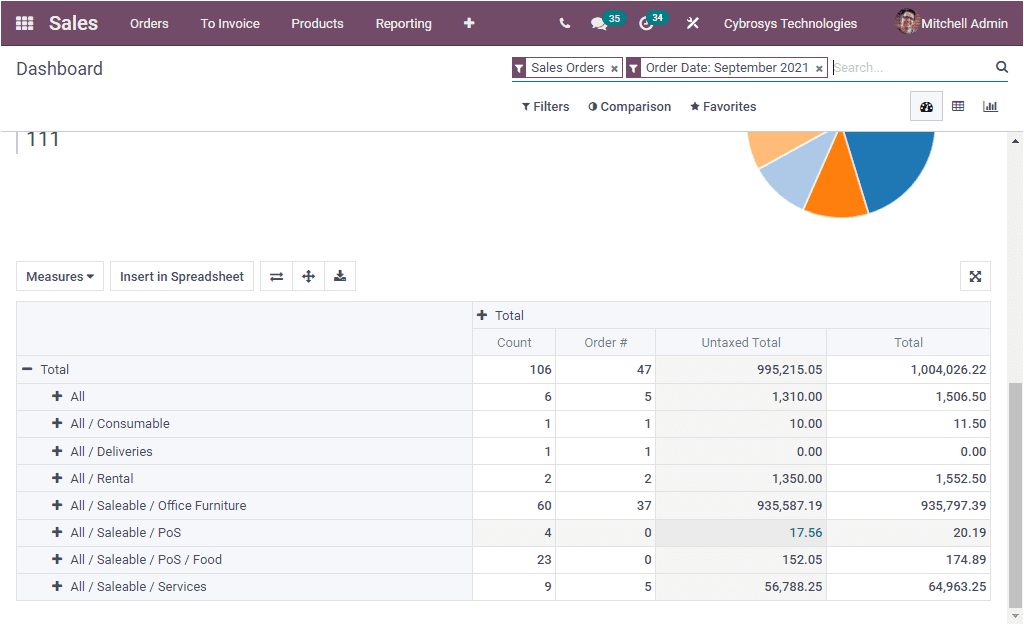
The Pivot view of the window can also be viewed under the same window as shown in the below image.

Here also you can see the report in various measures. Moreover the data in the window can be inserted into the spreadsheet by clicking on the Insert In Spreadsheet option available. Furthermore, the Flip axis, Expand all, Download XLSX option are also available. The report can be viewed in full screen by selecting the Full Screen View button available on the right top of the Pivot view or the Pivot button available on the top right corner of the Dashboard window.
Sales Analysis
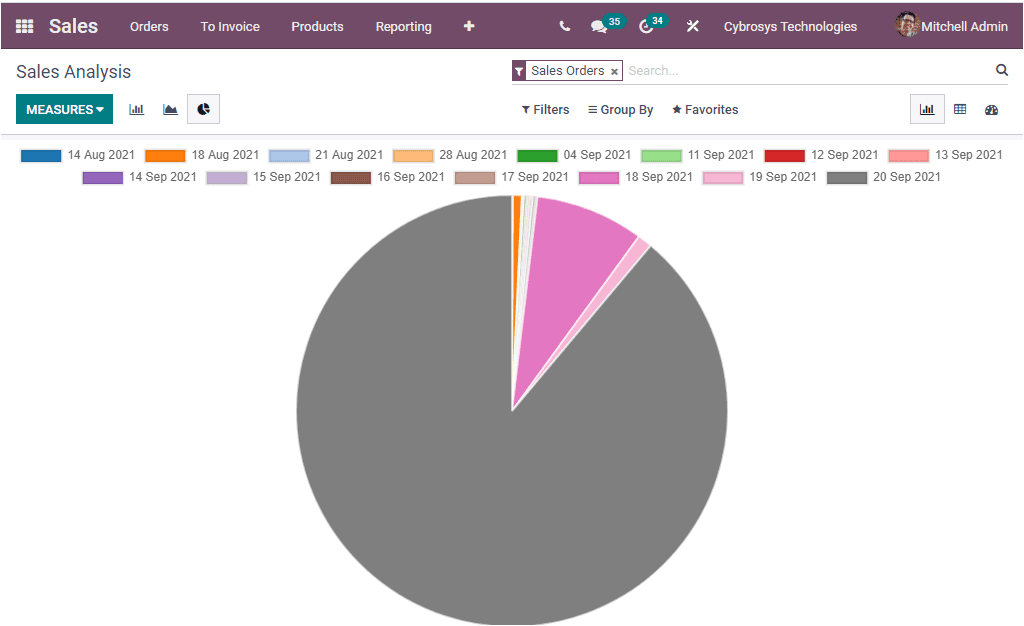
The Sales Analysis window of the Odoo Sales module will depict the Sales Analysis report and by viewing this window, you will get a clear view on your Sales analysis and you can take better decisions and actions regarding your Sales and business.

The window can also be viewed in Graph, Pivot and Dashboard view. The report can be generated by Bar Chart, Line Chart and Pie Chart. You are also able to apply various default as well as customizable filters using the Filters option available. The Group By option allows you to group reports in various default as well as custom groups. The Favourites tab allows you to save the current search by clicking on the Save Current Search option available. Also the menu includes the options such as Link menu in spreadsheet, Add to my dashboard, and Add to Google spreadsheet.
In the Odoo 15 Sales module your sales activities will be operated and managed in a professional way. The highly integrated nature of the module makes you more connected with other core modules in Odoo especially with CRM, Accounting, Inventory, Purchase and many more and it will ensure more operational efficiency.