Reporting
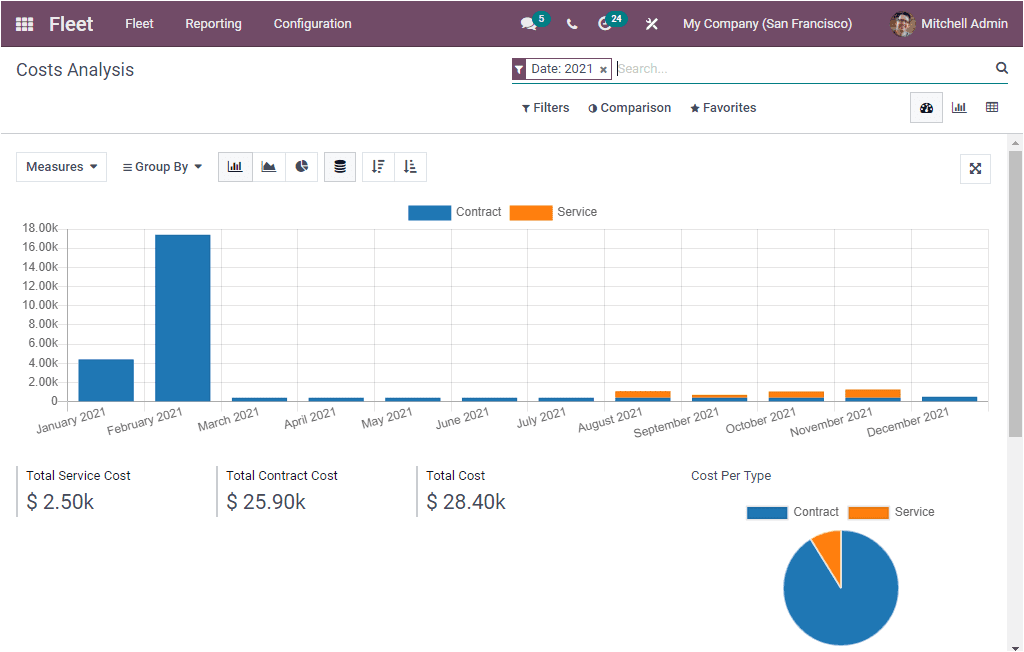
Like any other modules in Odoo, the Fleet Management module is also furnished with an exclusive report management feature that will let you generate reports in various measures. Under the Reporting tab, you can view the Costs menu. Upon selecting this menu, you can enter into the Reporting window. The screenshot of the window is depicted below.

The Cost Analysis window will record the Total Service Cost, Total Contract Cost, and Total Cost. You can generate the report in graphs by clicking on these reports. The blue shade is marked for the Contract in the graphical representation, and the Orange shade denotes the Services. In addition, you can sort out the data based on the Vehicle and also Driver. This window also allows you to generate Bar charts, Line Charts, and Pie charts reports. You can arrange the graph views in both ascending and descending order. Under the Filters tab, you have the default and customizable options that will allow you to view your reports from different perspectives. The window allows you to compare your current year's reports with previous years. This can be done by using the options available under the Comparison tab.
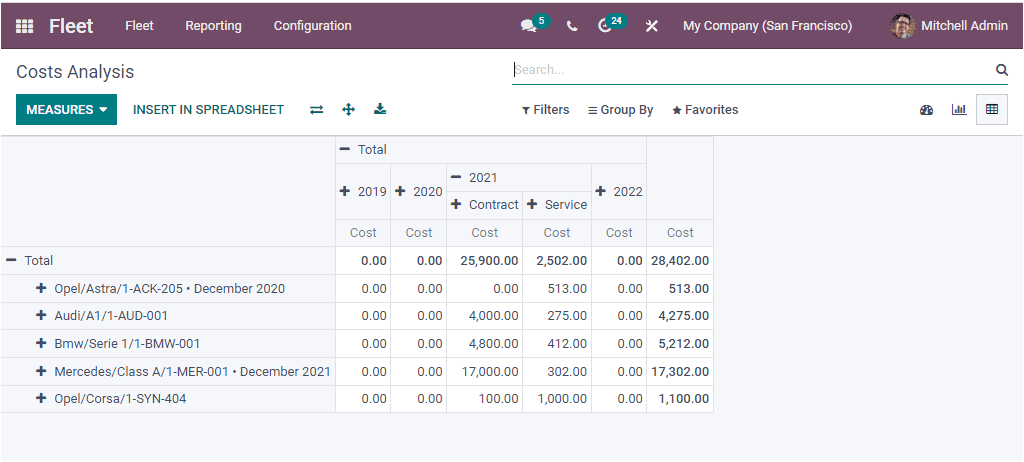
Furthermore, the reports can also be viewed in tabular format using the Pivot menu available.

Here also you have all the options we discussed in the graph view, and also you will be able to view extra options such as INSERT IN SPREADSHEET, Flip axis, Expand All, and Download XLSX.
Odoo Fleet management module is the complete solution for supervising commercial vehicles of your organization to improve the revenue and efficiency of your fleet. Odoo Fleet management system helps you manage your fleet and handle all the operations associated with the vehicle management, especially the maintenance and the repair works along with the driver in charge.