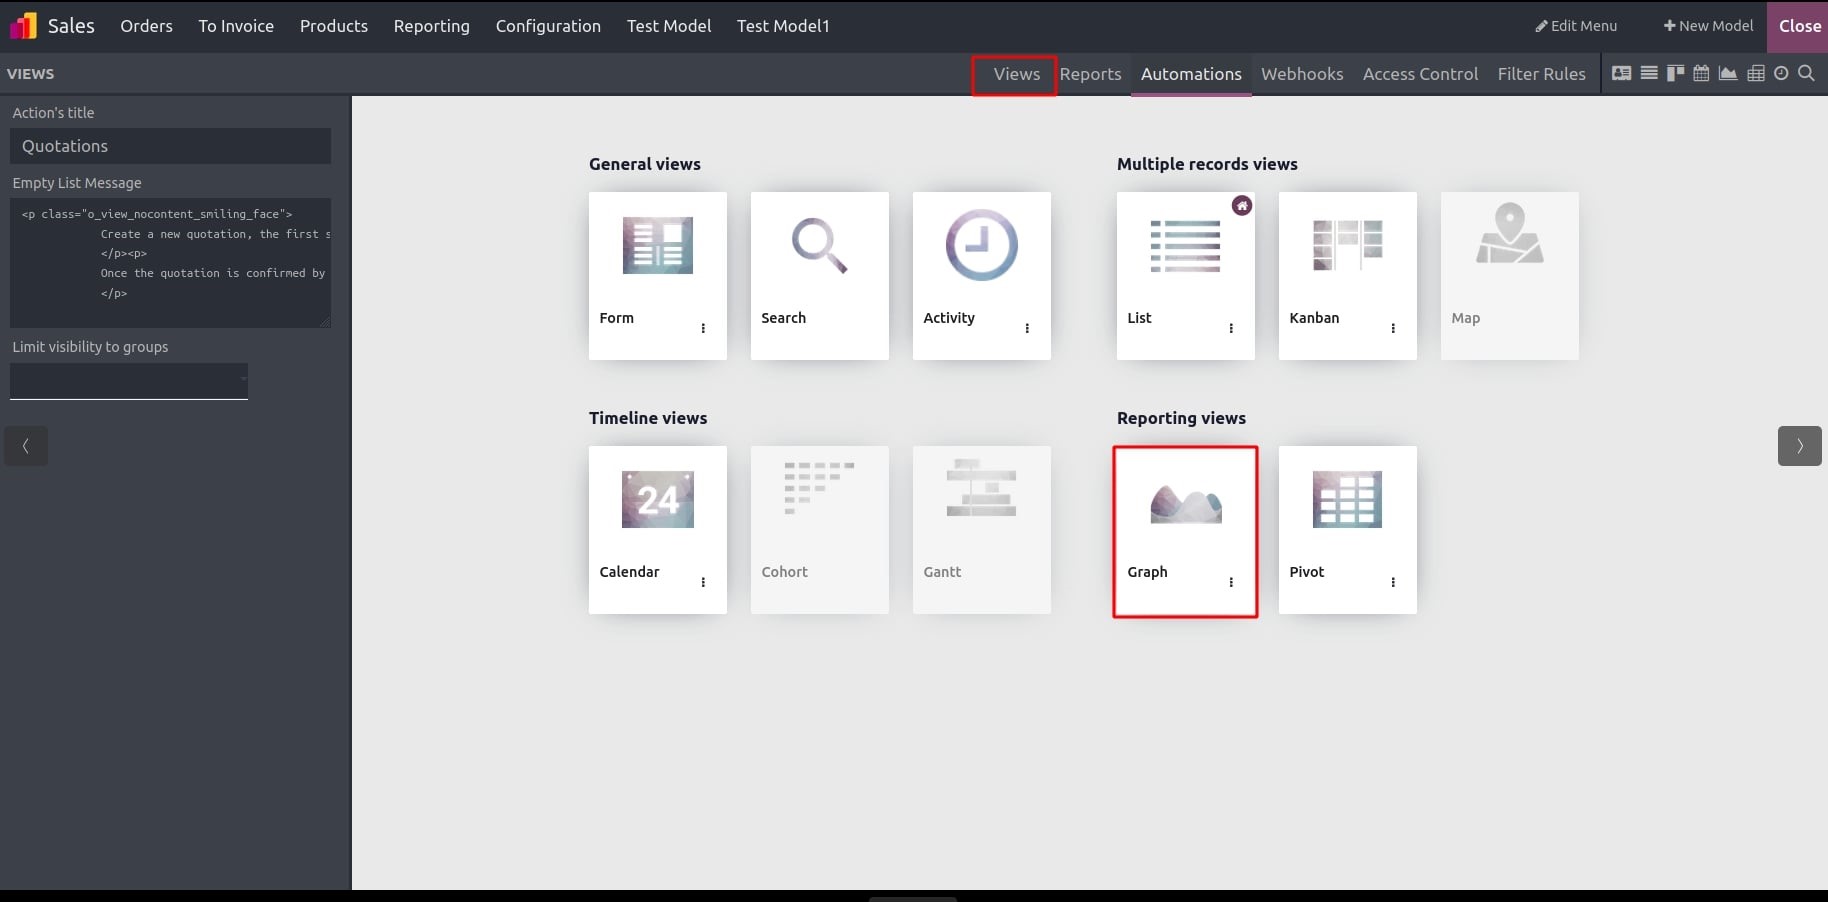
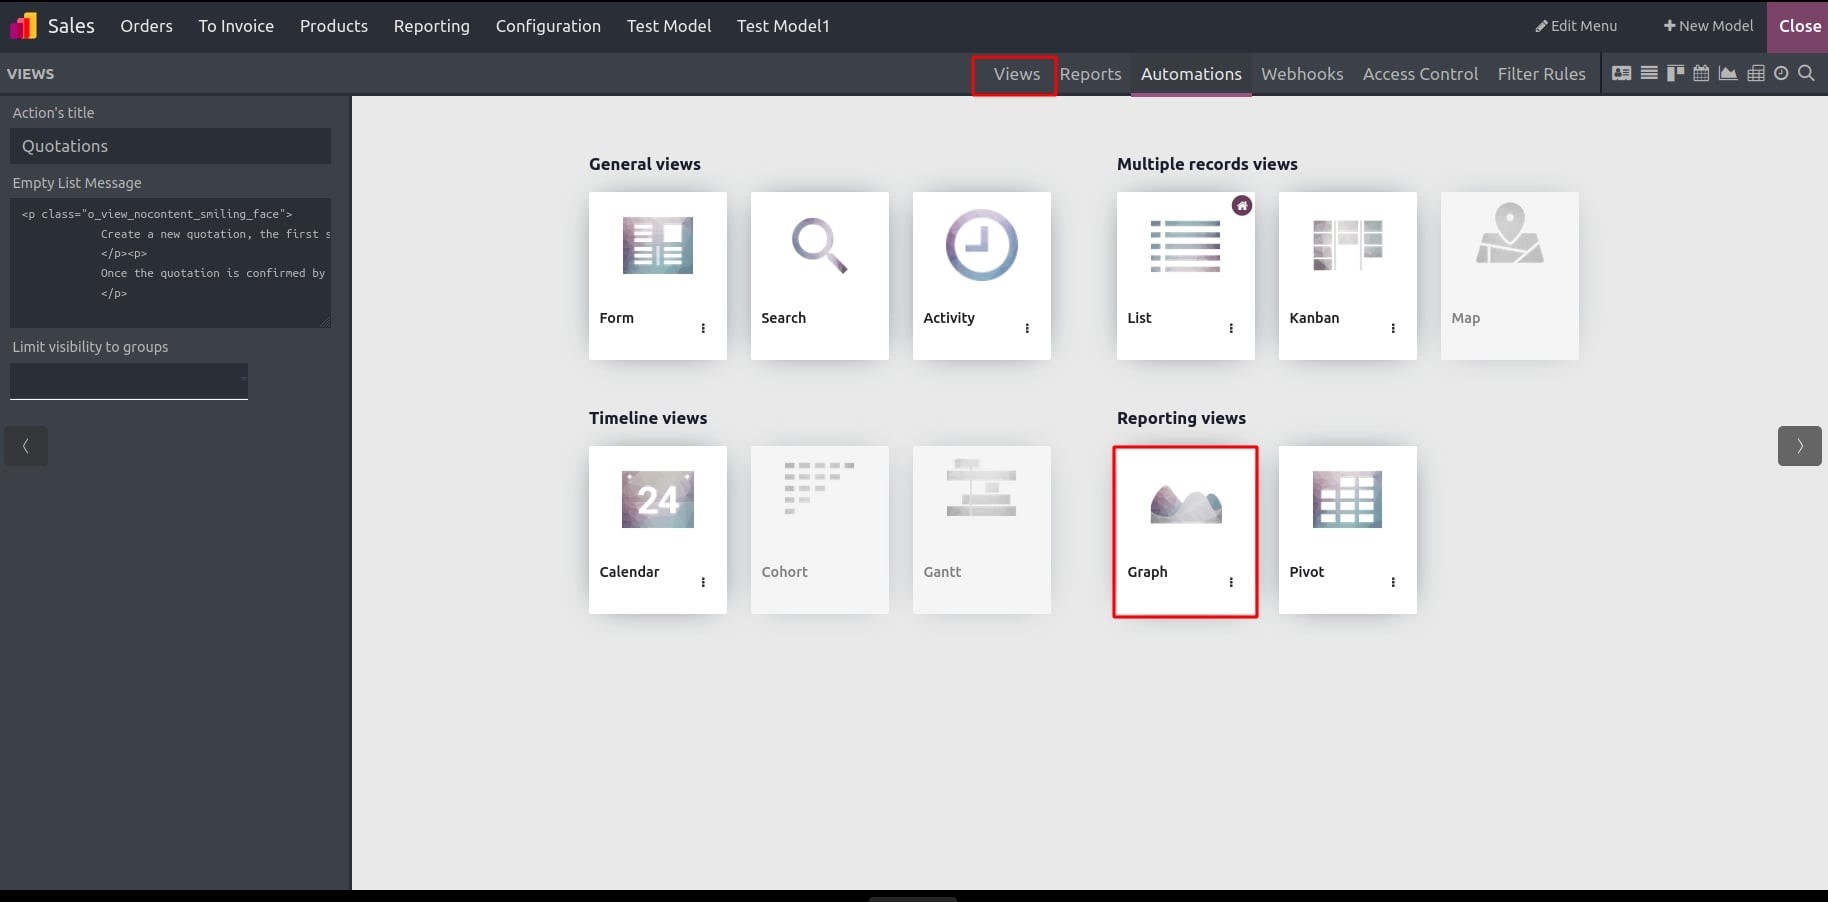
The Graph View serves as a visual representation of data, and Odoo supports various types such as bar charts, pie charts, and line charts. To access the Graph option, navigate to the Reporting Views category within the Views section of the Odoo Studio module. Activating it is as simple as clicking on the Graph option.

Upon activation, a new window will appear, allowing you to customize the graph using the "View" option. Within the "View" option, you will find the following choices:
- Type: In the "Type" option, you can modify the default chart type, choosing from options like Pie, Bar, or Line.
- Sorting: The "Sorting" option is available exclusively in Bar and Line charts, allowing you to sort data in Ascending or Descending order.
- First Dimension: Select the default data dimension or category by choosing a field under the "First Dimension" option.
- Second Dimension: Similarly, if you desire an additional dimension, you can select a field under the "Second Dimension."
- Measure: Under "Measure," choose a field to specify the default type of data to be measured in the view.
- Access Records from Graph: This option, applicable to Bar and Pie charts, allows you to access all records categorized under a specific data category on the chart by ticking the "Access Records from Graph" box.
- Stacked Graph: Exclusive to Bar Charts, the "Stacked Graph" checkbox, when selected, displays two columns on top of each other by default when utilizing two data dimensions (categories).

You can alter the default type by choosing the desired option in the "Type" section. Additionally, within the "View" option, the "Access Records from Graph" feature is applicable specifically for Bar Charts and Pie Charts.