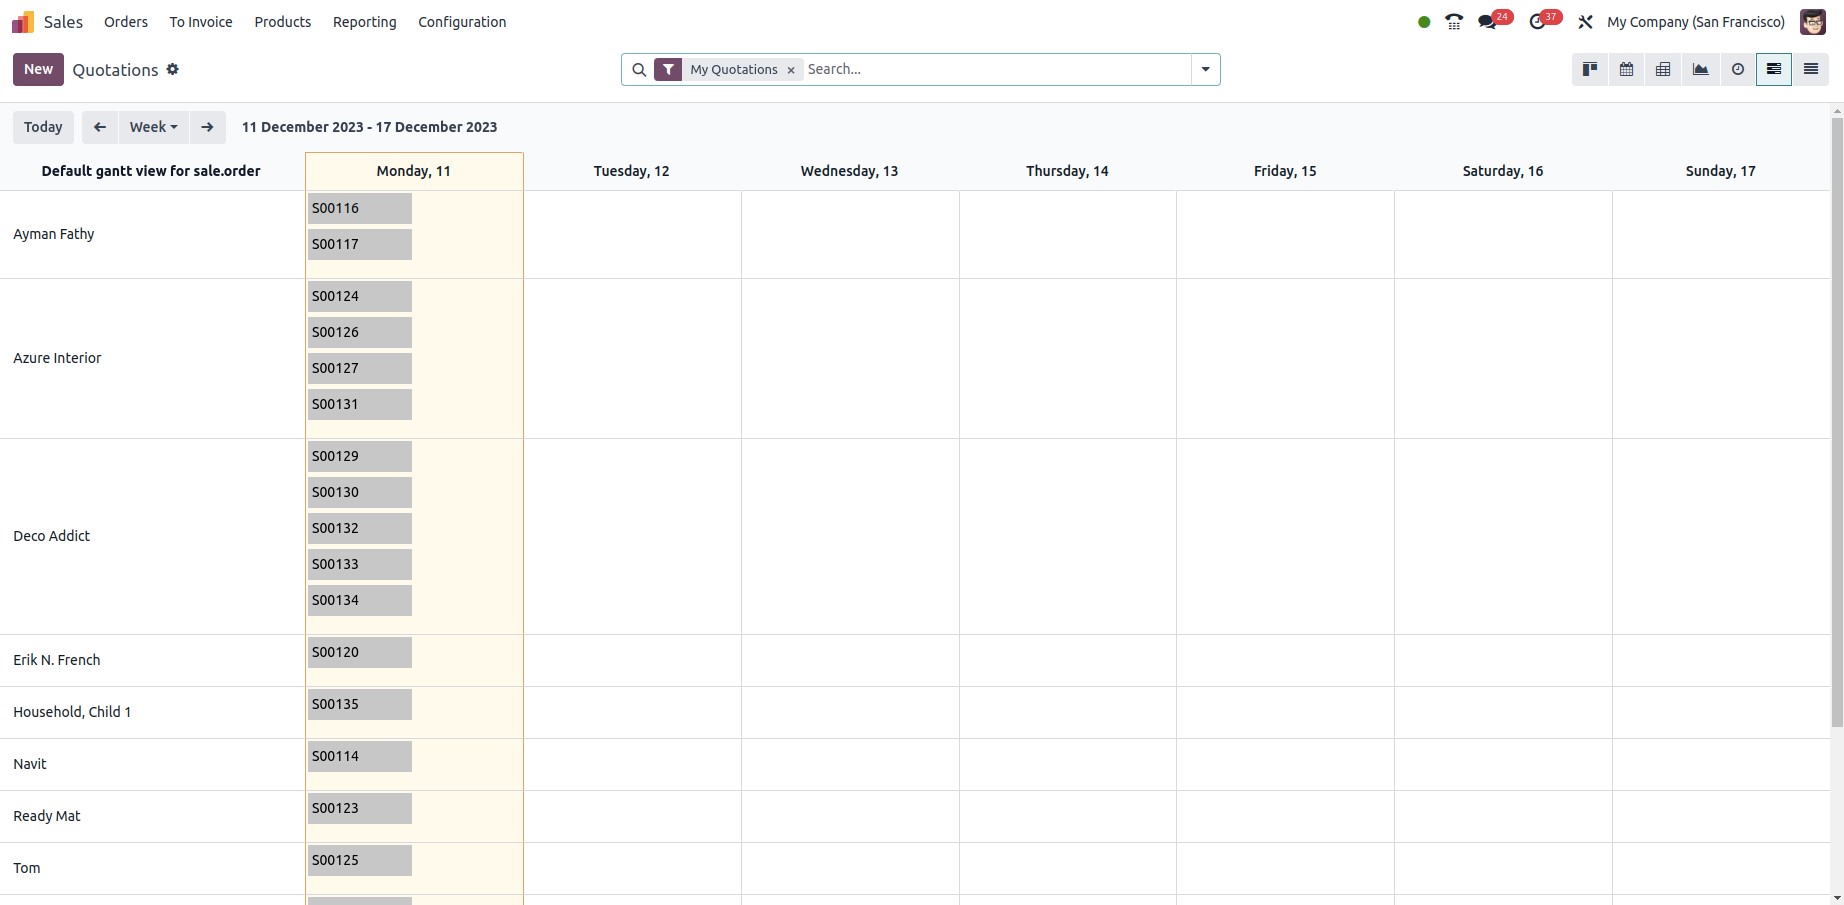
The Gantt chart, coined after its creator Henry Gantt in the early 1900s, serves as a graphical depiction of a project's timeline, showcasing the commencement and conclusion dates for individual tasks within the project. Its purpose lies in aiding the scheduling and oversight of extensive manufacturing projects.
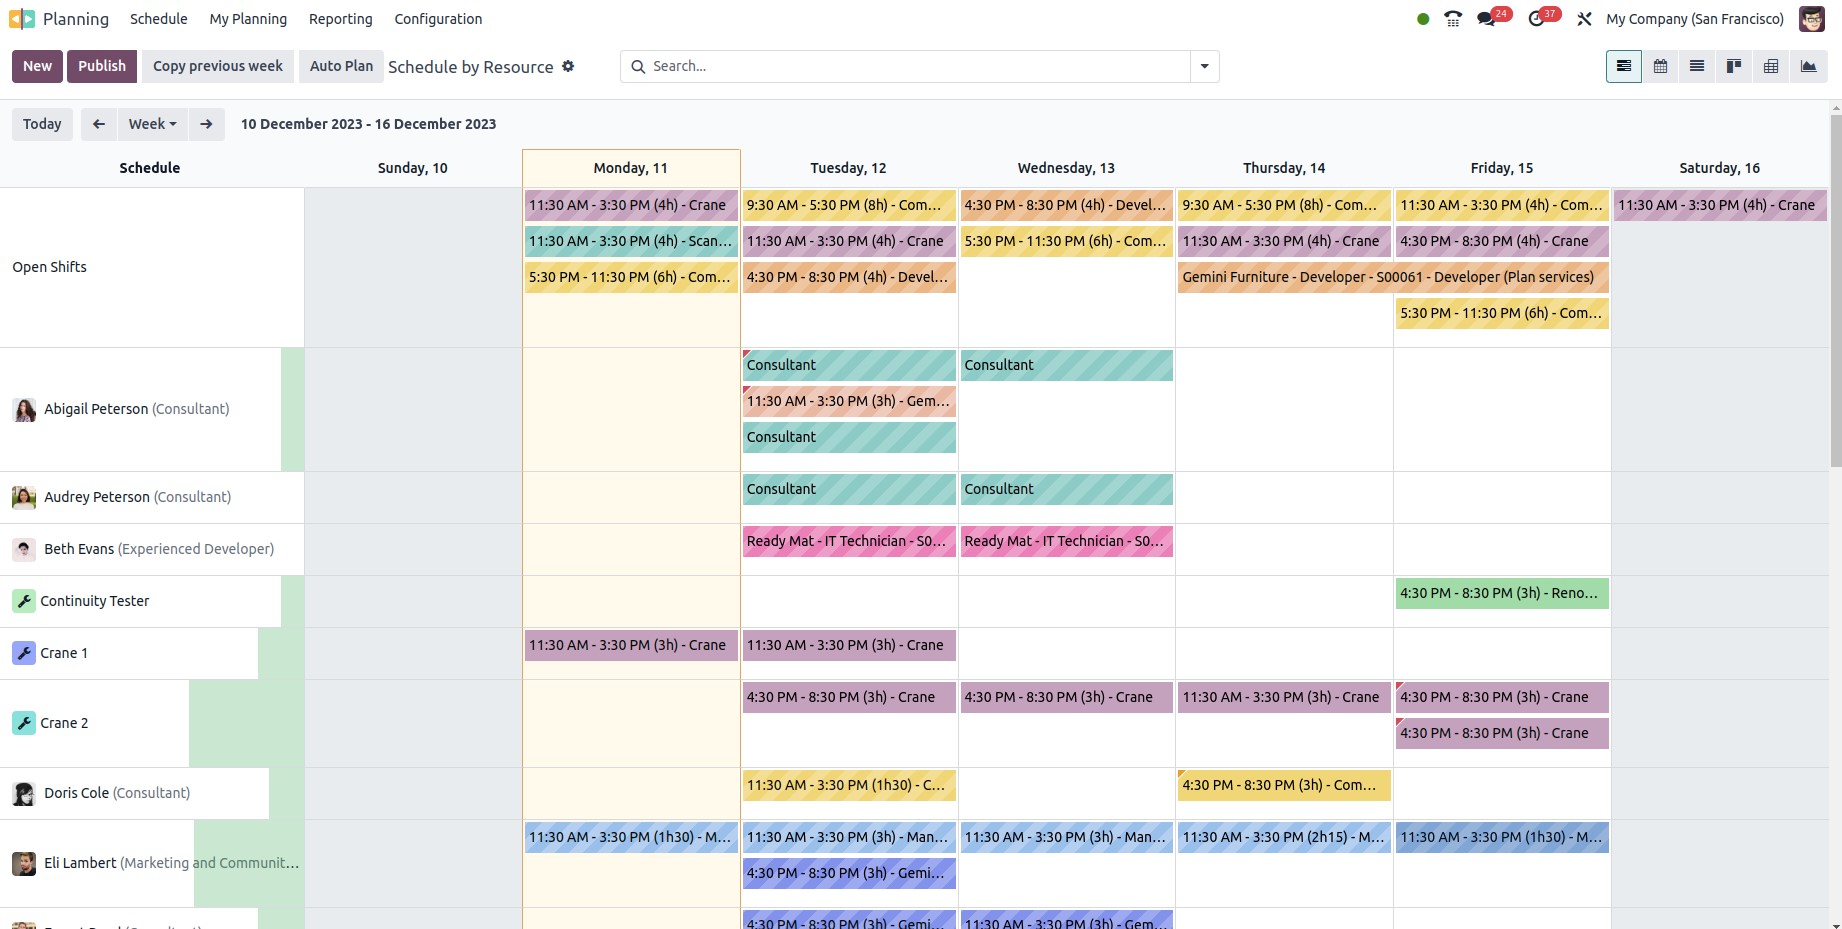
Let's now explore the process of incorporating a Gantt view through Studio:
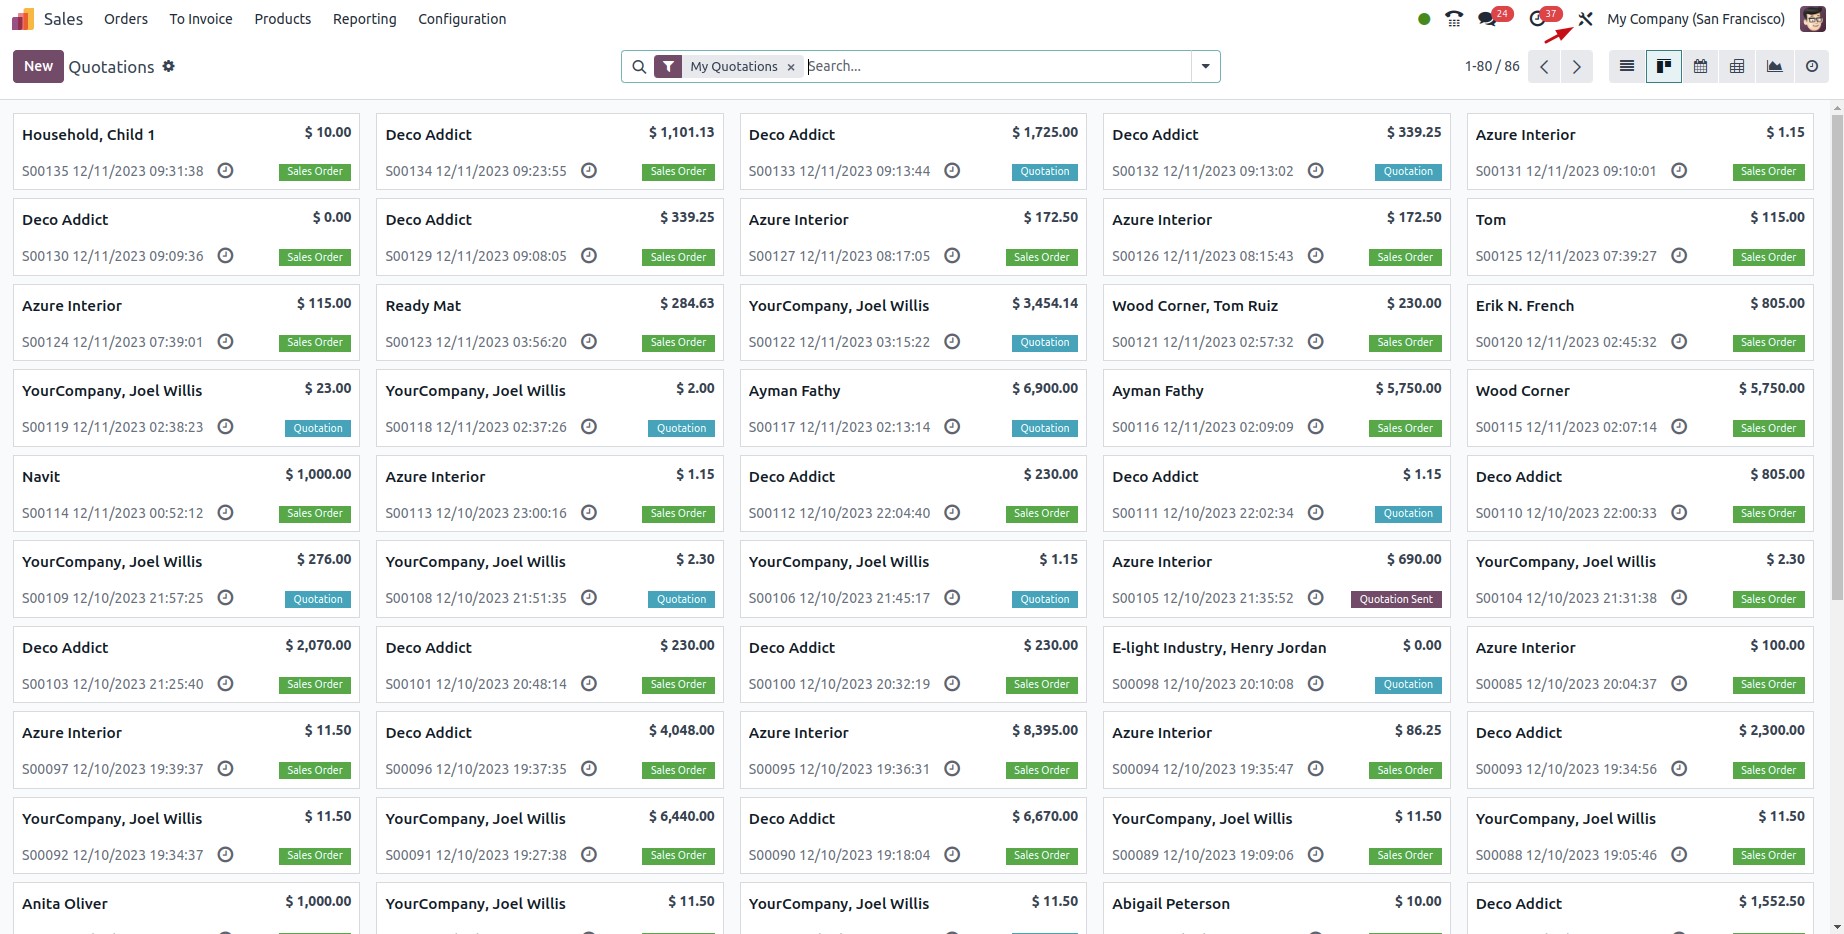
Select the module where you'd like to include a Gantt view, then click on the studio icon.
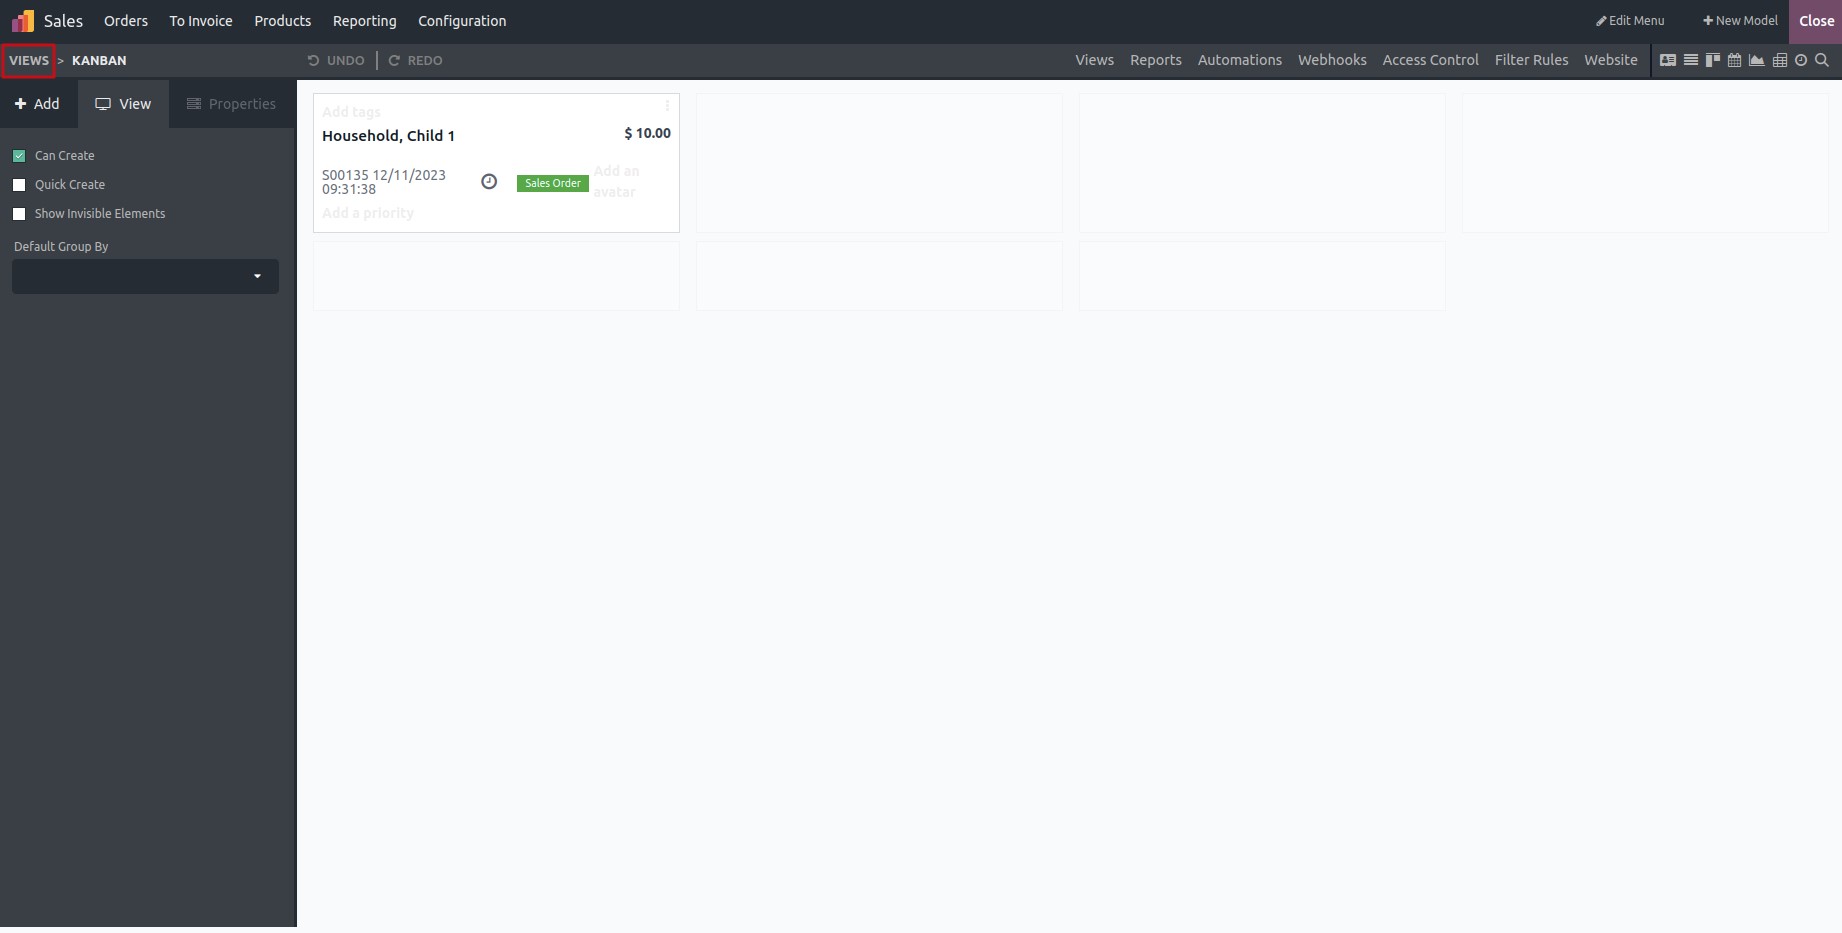
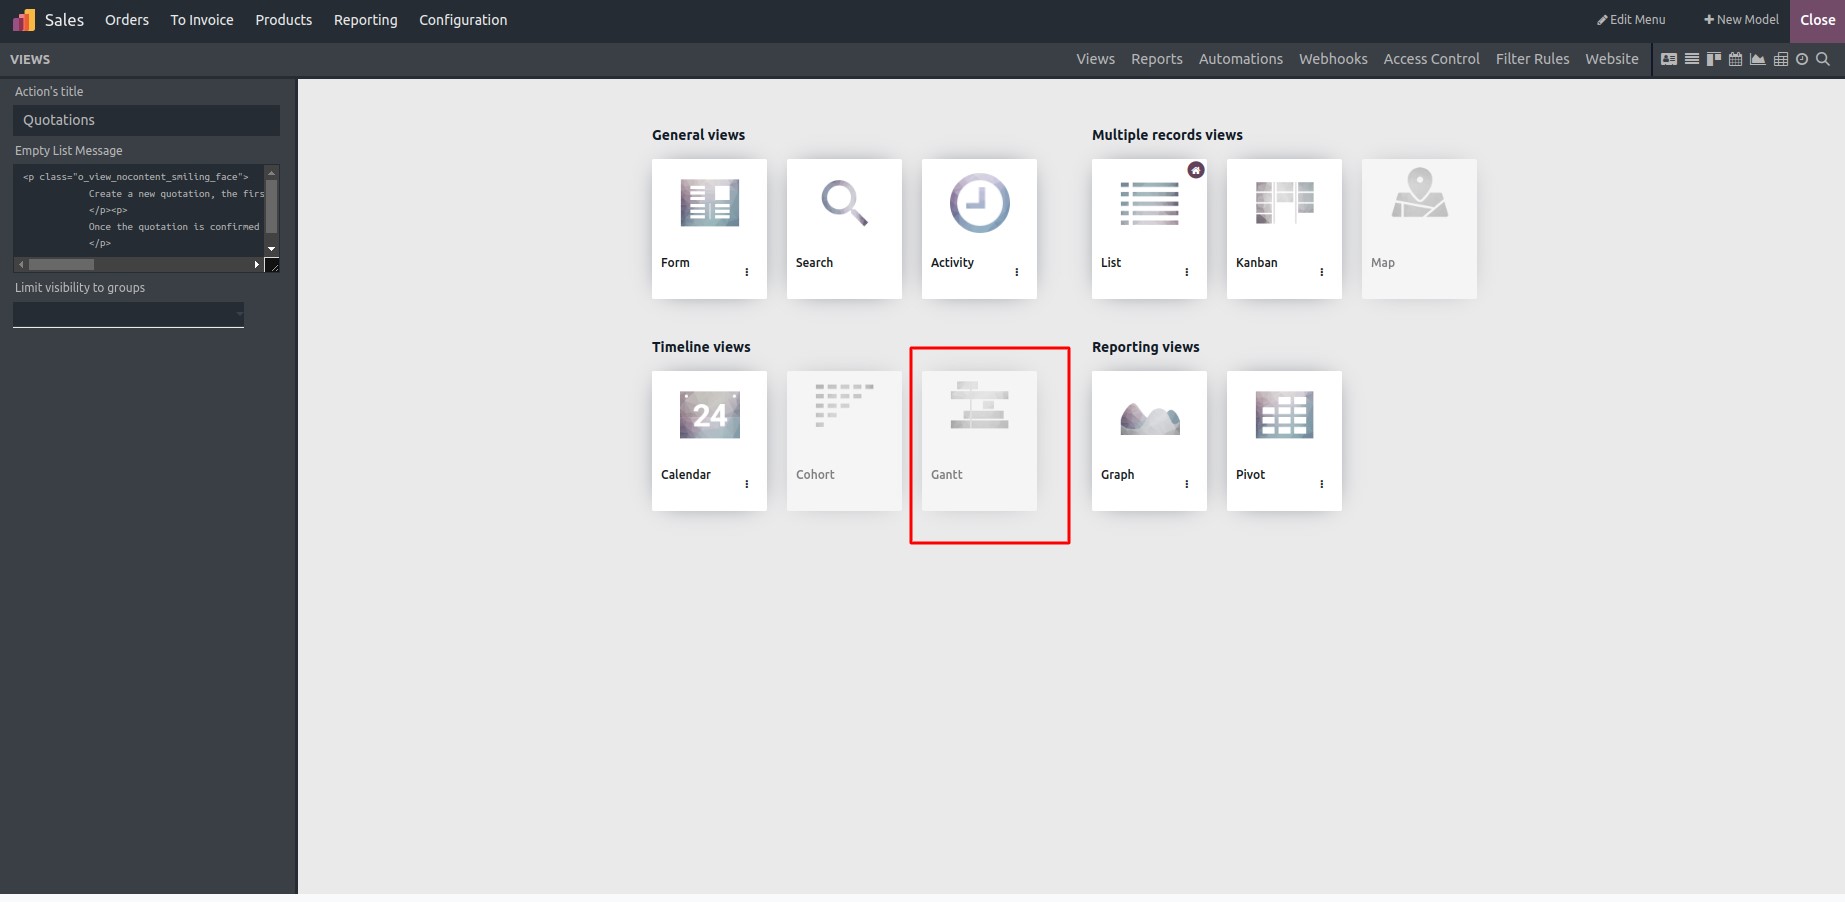
Click on the views.
Upon clicking on "Gantt," a compact widget will appear, generating the Gantt view according to the specified start and end dates.
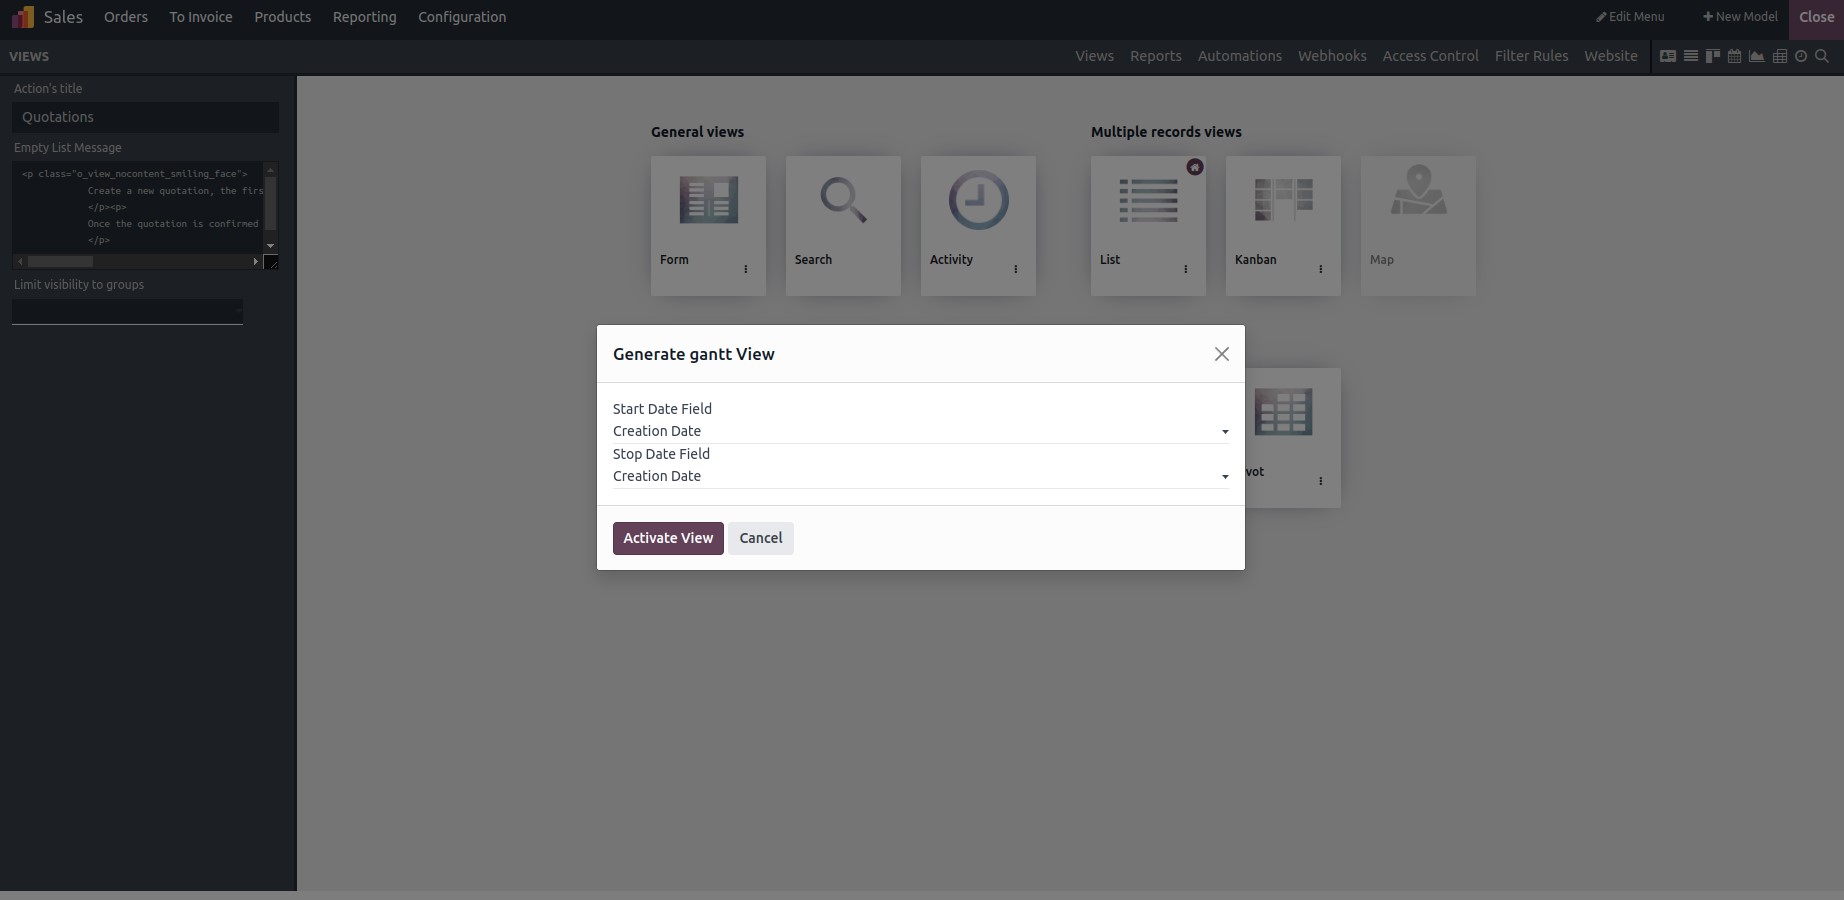
Click on the “ACTIVATE VIEW” button.
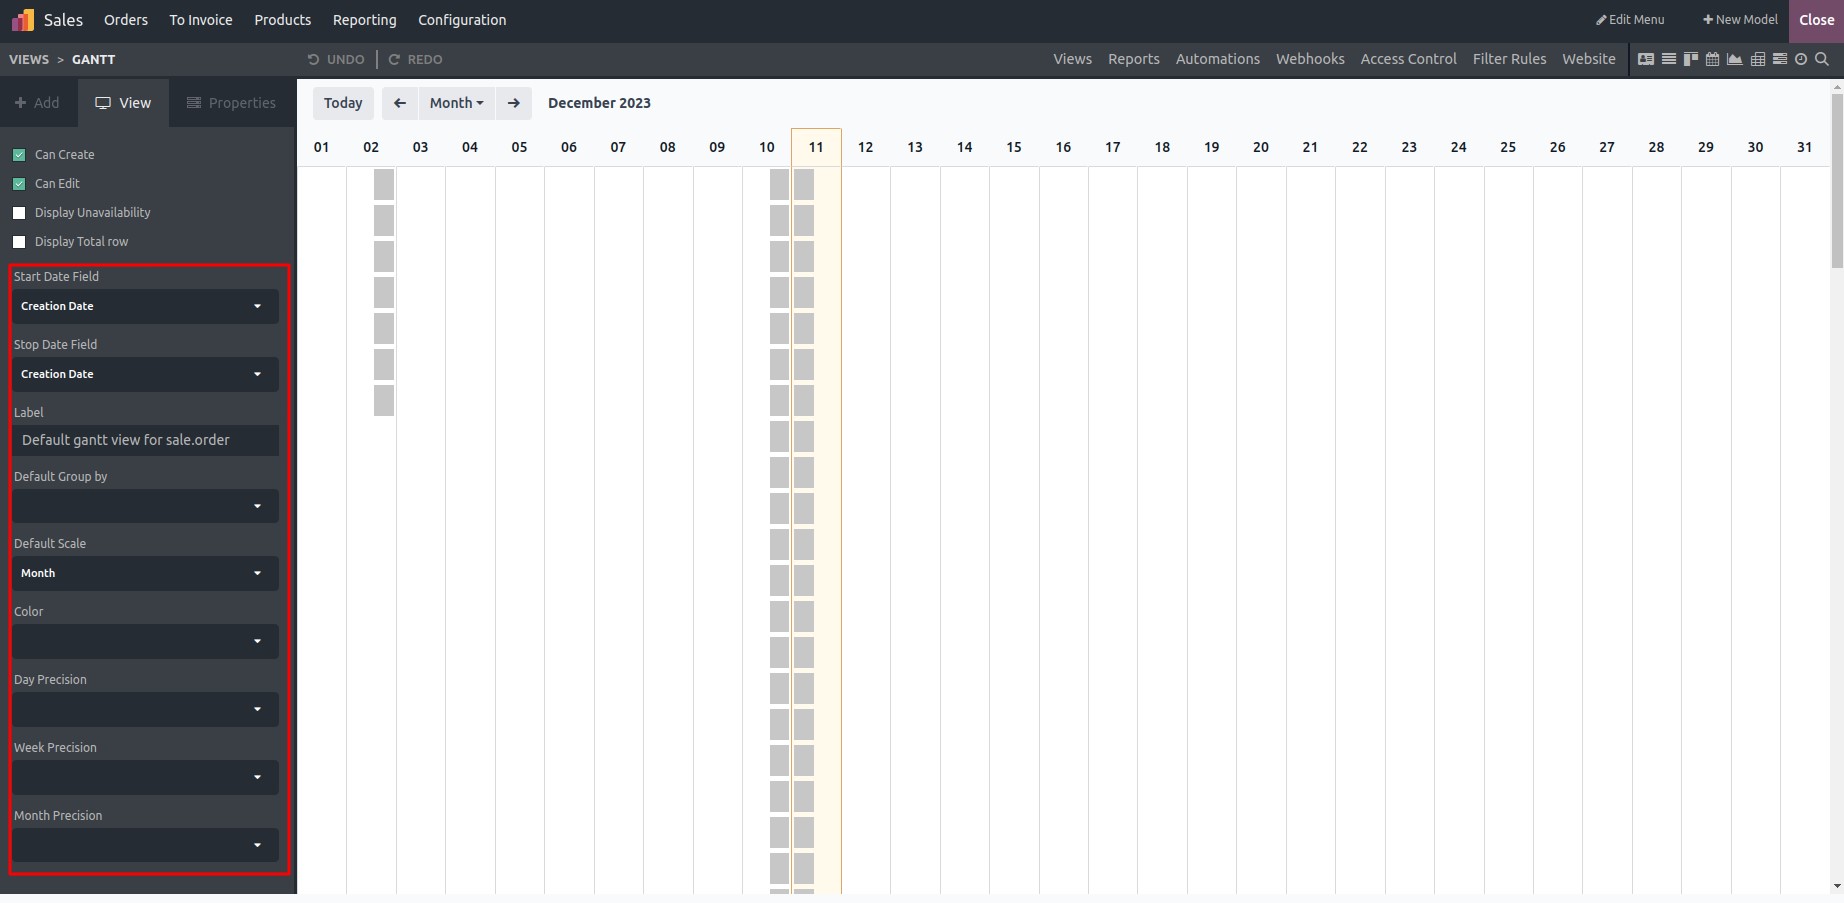
Here are various key components within the Gantt settings:
Display Unavailability: To shade cells in gray when a record should not be created.
Display Total row: To display a total row at the bottom.
Start Date Field: Specifies the starting date for each Gantt item.
Stop Date Field: Indicates the stop date for each item.
Label: Assigns a label to the Gantt view, defaulting to the view's name.
Default Group By: Determines the data grouping within the view.
Default Scale: Sets the default scale—day, month, week, or year.
Color: Assigns field names to color-coded boxes based on their values.
Day Precision: Offers quarter-hour, half-hour, or hourly time precision.
Quarter hour: Records time as 12:15 if it's 12:10.
Half hour: Records time as 12:30.
Hour: Records time as 1:00.
Week Precision: Provides half-day or daily precision.
Half day: Records time as 12 pm for inputs like 10 am.
Day: Snaps to a full day, recording times as 11:59:59 pm for the previous day or the current day.
Month Precision: Mirrors the values and functions of week precision.
Once you've inputted the details, close Studio, and the Gantt view will be accessible within the views section.
