Bar Chart
A bar chart or bar graph in Odoo 17 is a visual that depicts categorical data using rectangular bars with proportionate heights and lengths.
Let’s create a bar chart using the studio module:
-
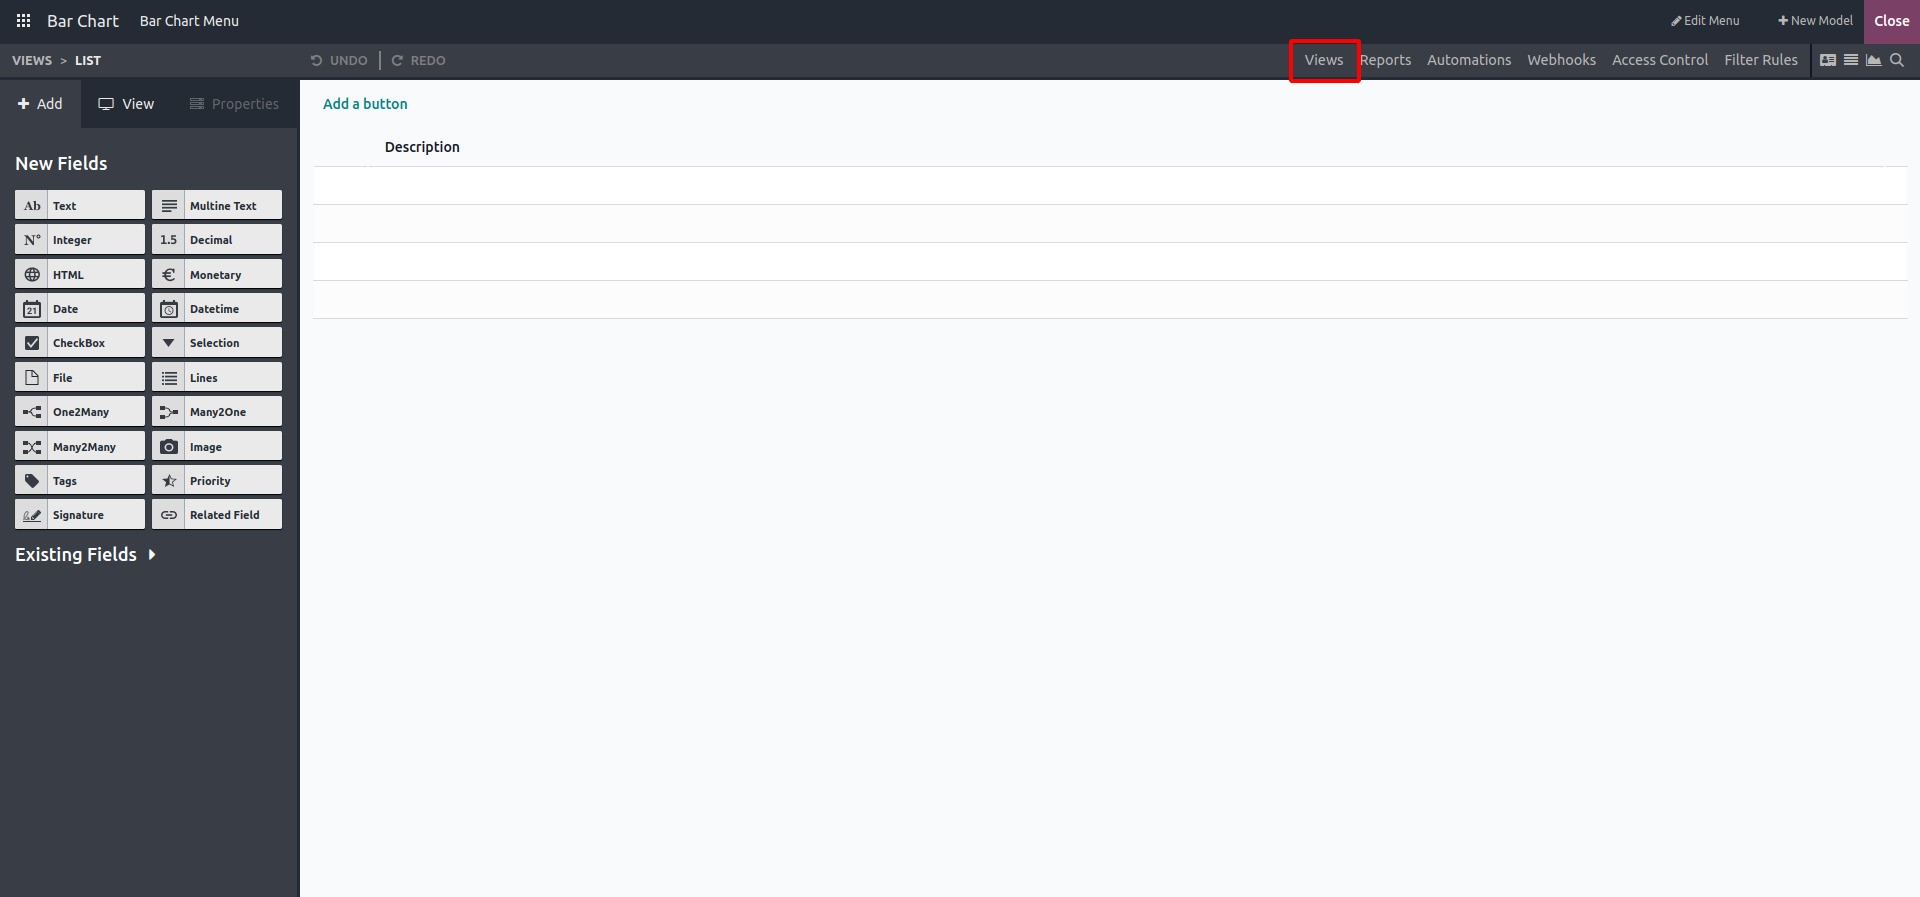
Navigate to the Studio module in Odoo 17 and select the model for which you want to build a bar chart.
-
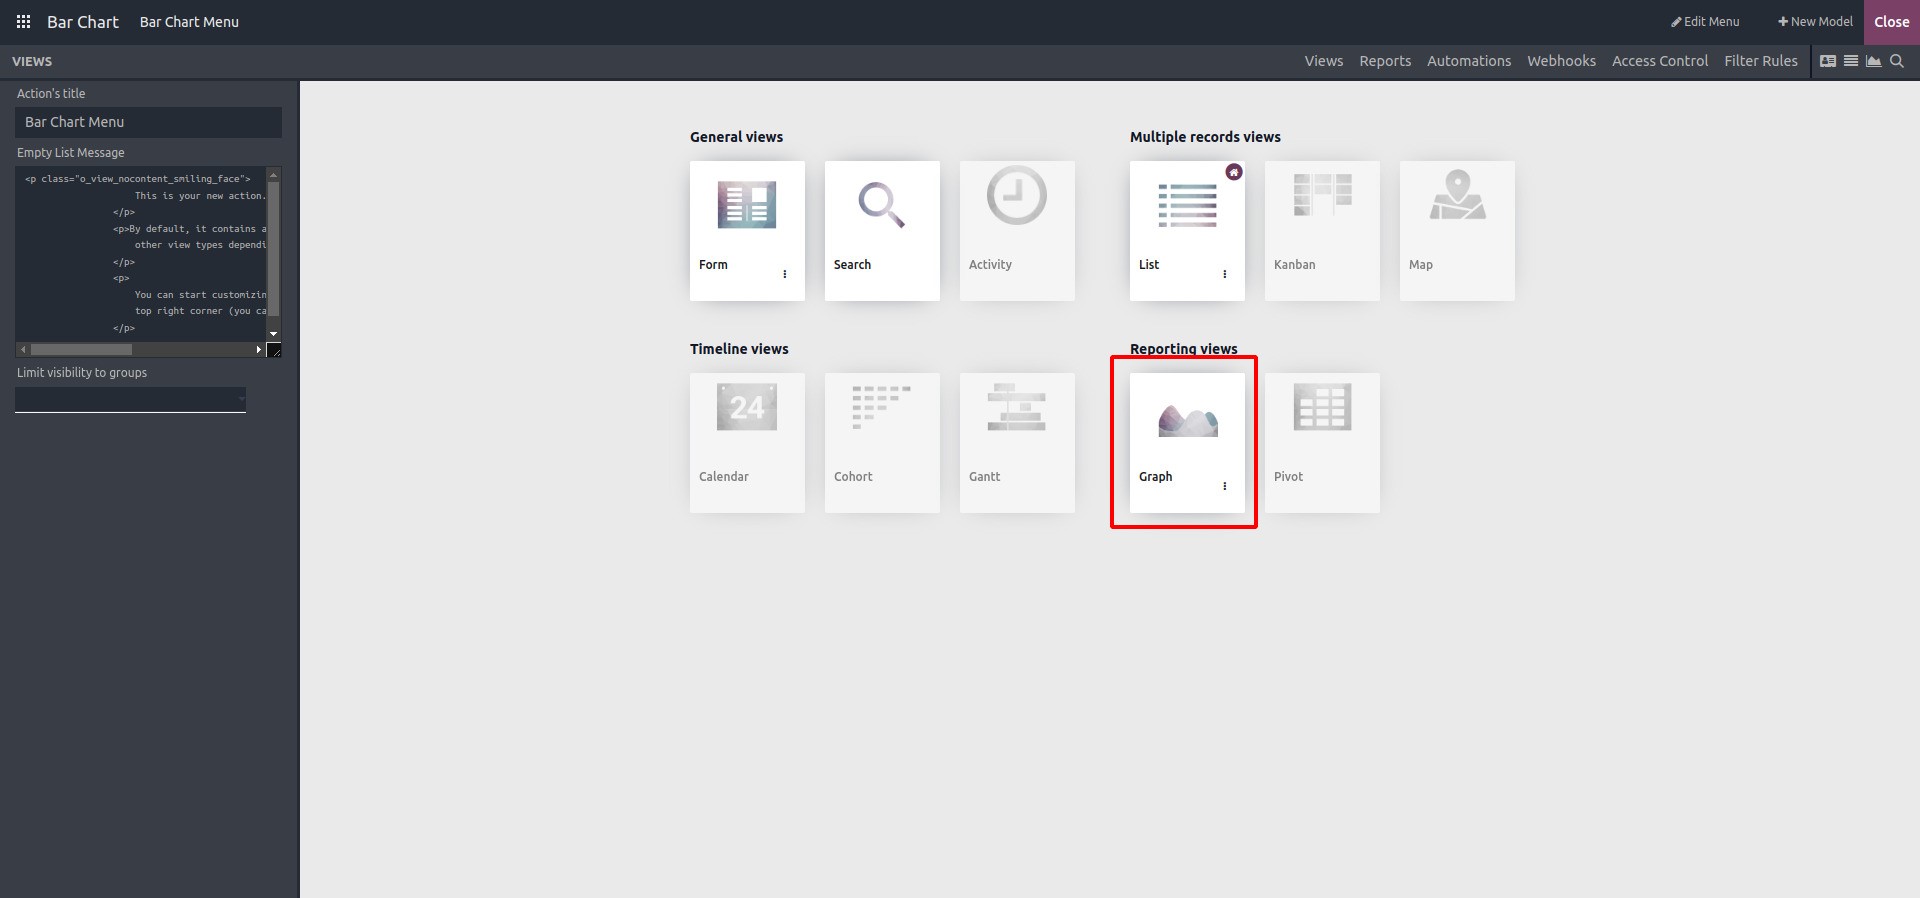
Select "Graph View" from the list of available views by clicking on the views tab.
-
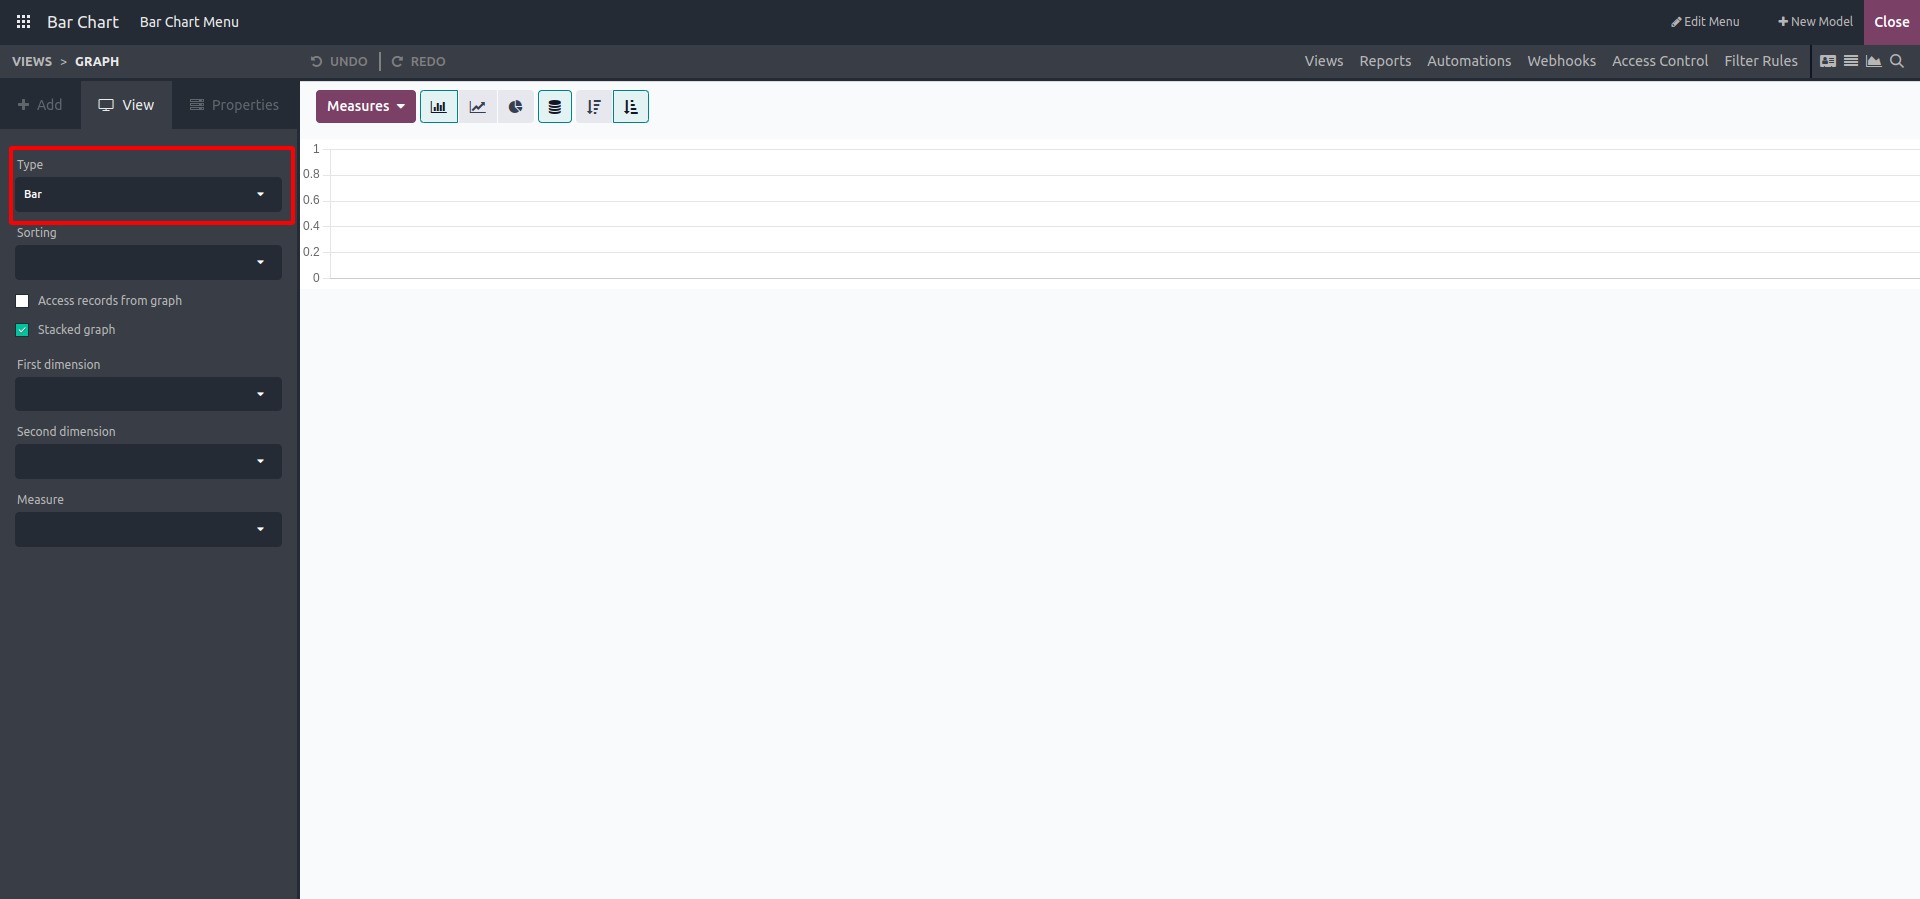
Select "Bar" as the type of chart.
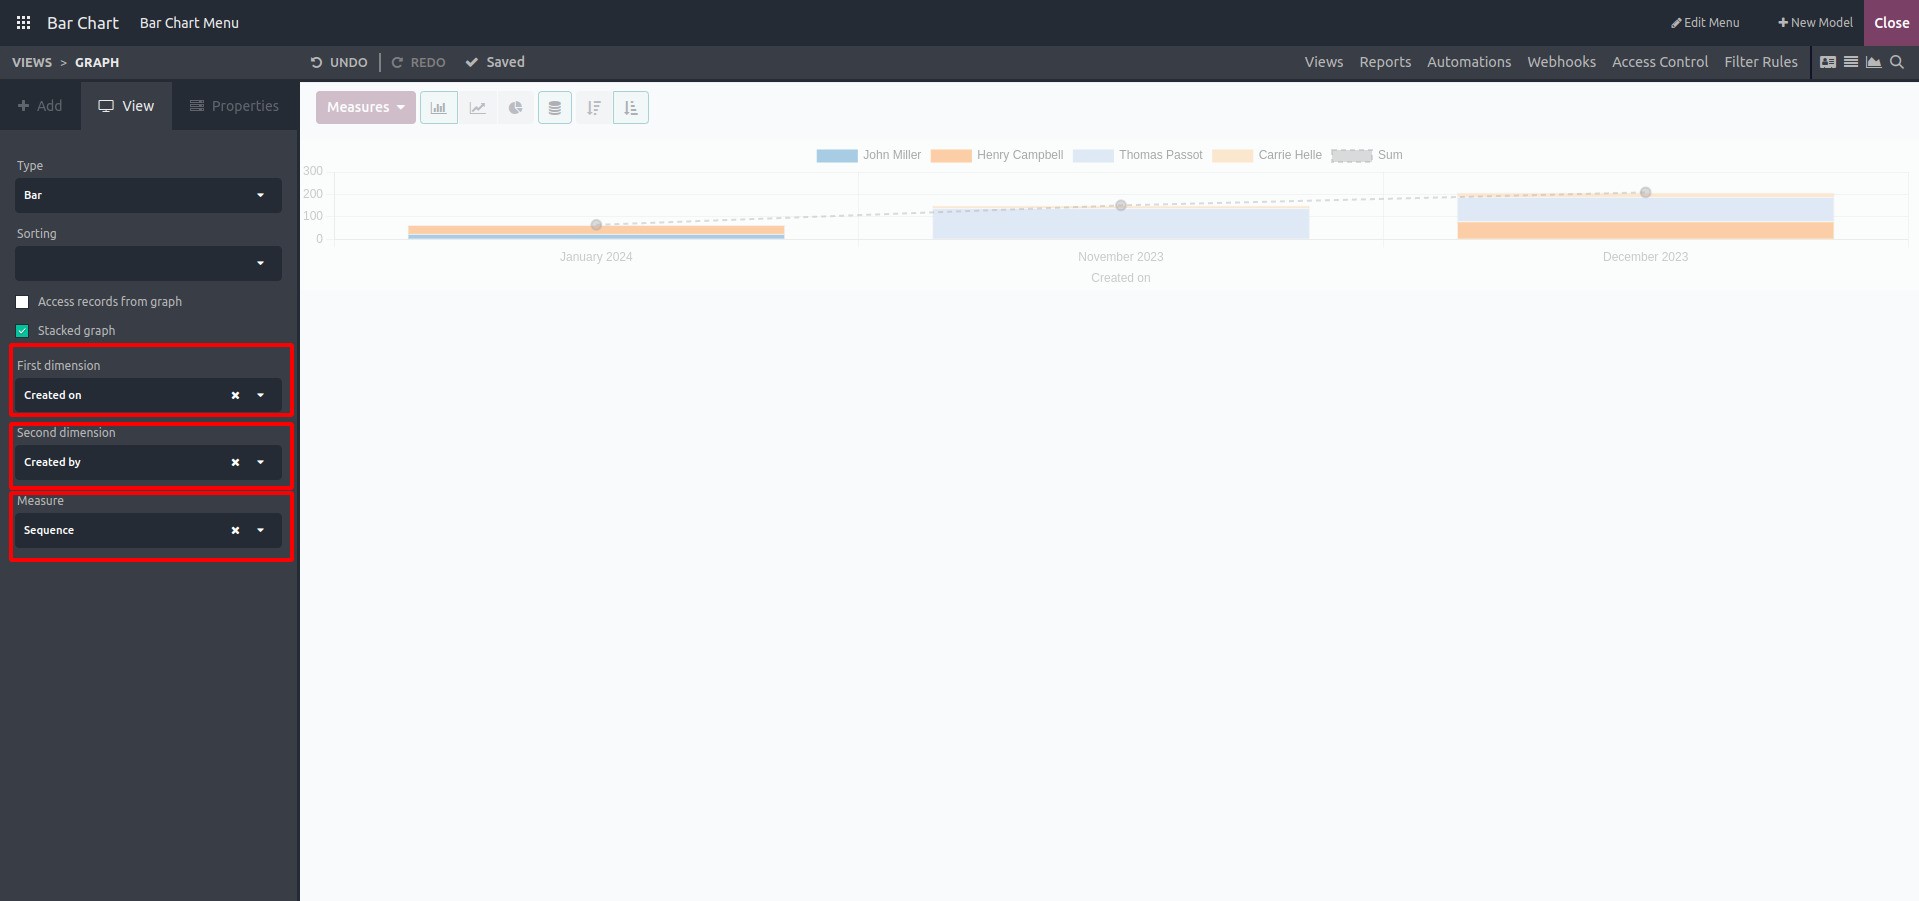
- Choose the first and second dimensions, as well as the measurement field. These will vary according to the model.
- ❖ The First Dimension corresponds to the chart's X-axis, which is used to organize data based on a specific property or category.
- ❖ The Y-axis of the chart, which represents the value or quantity being measured, is referred to as the Second Dimension.
- ❖ The measure is the value or quantity depicted on the chart's Y-axis.
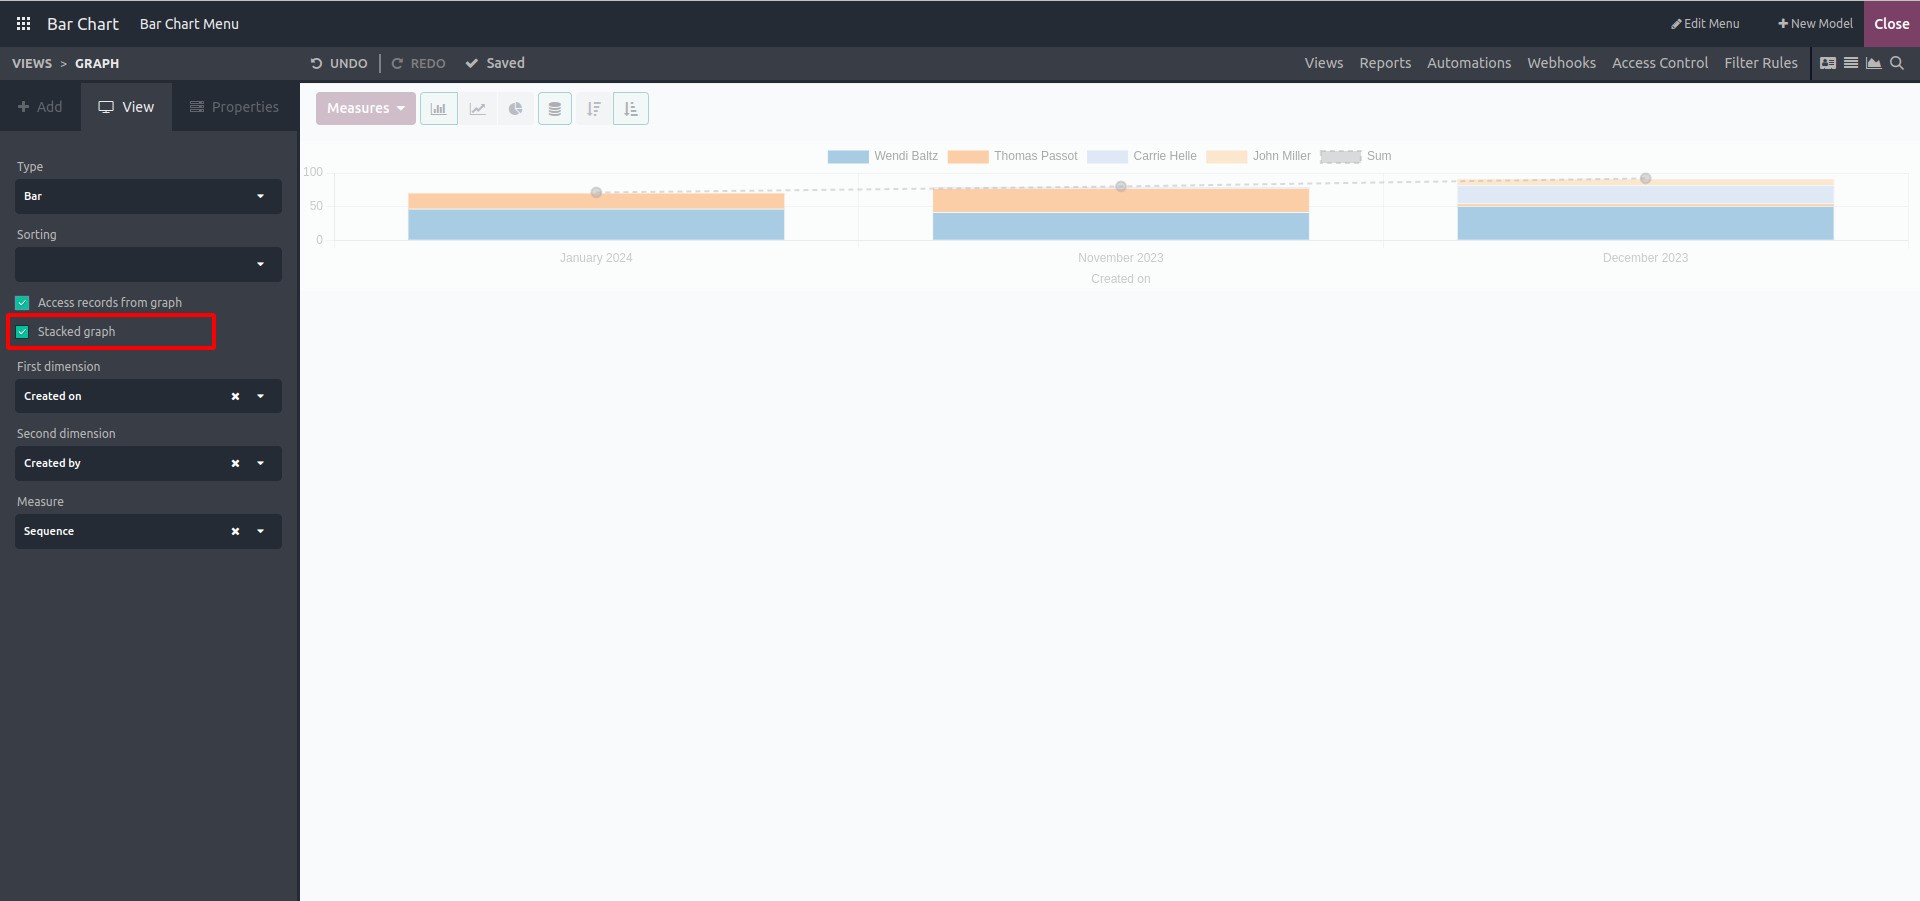
 Enable Stacked Graph
This enables us to make a bar chart with the bars stacked on top of one another rather than side by side.
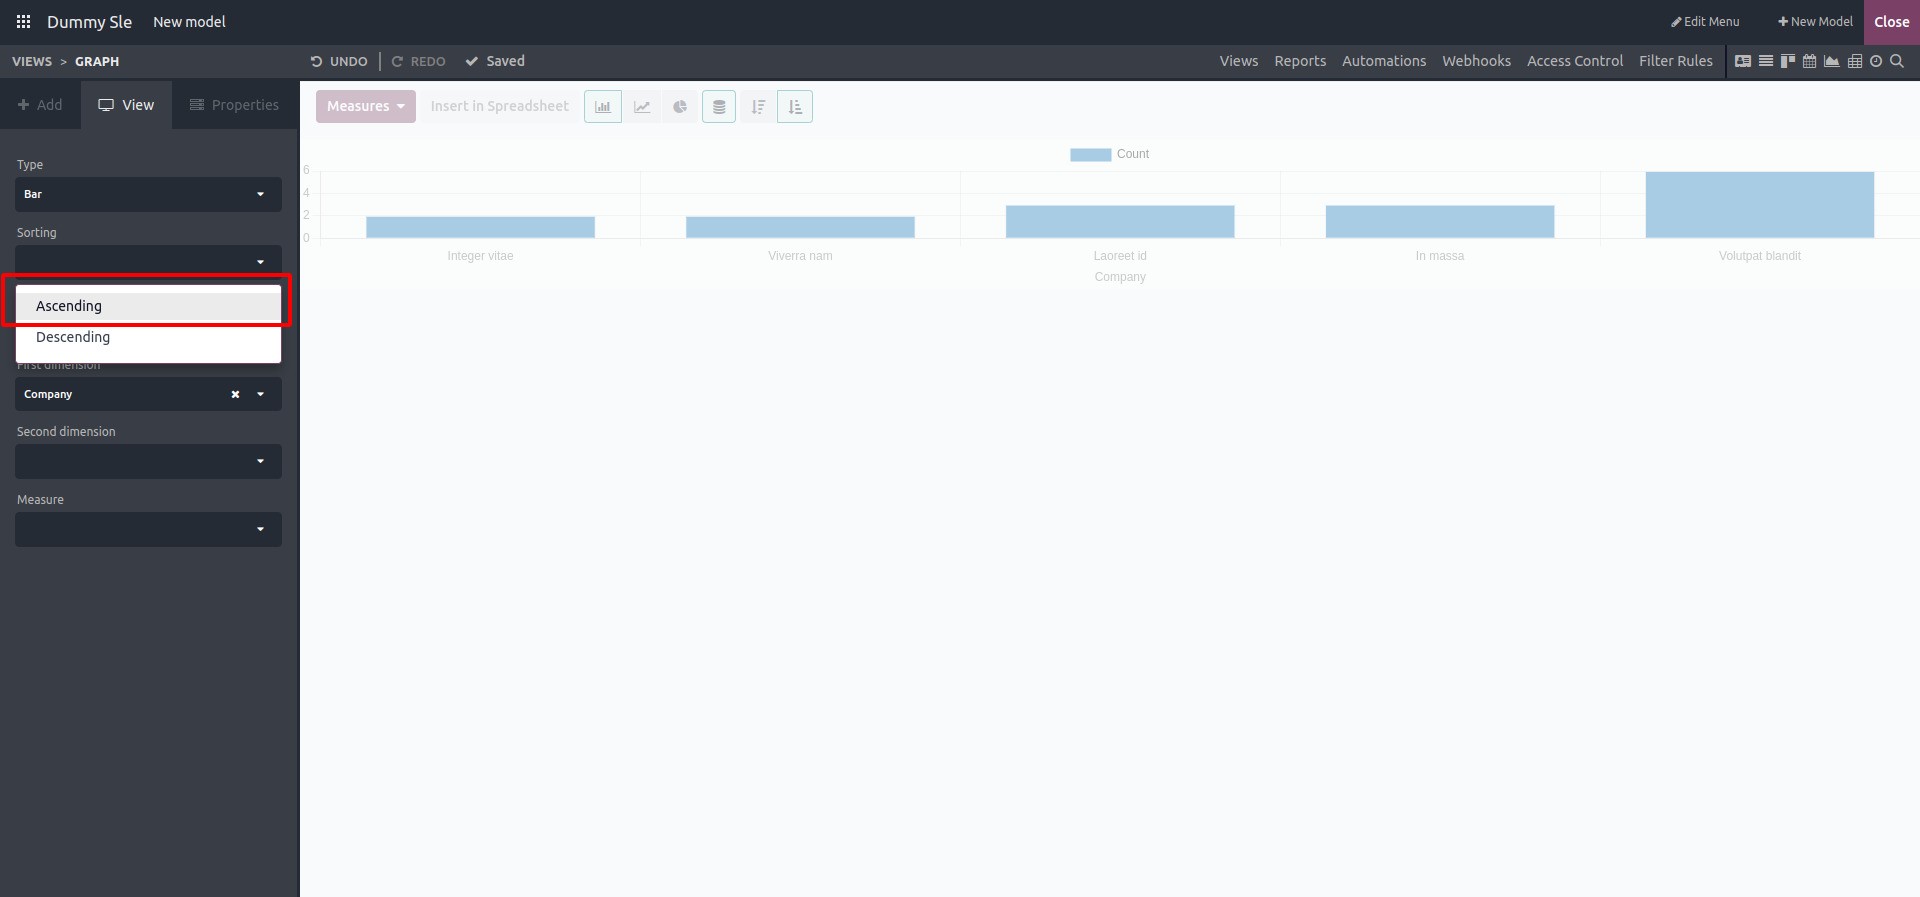
 You can sort the Bar Chart in either ascending or descending order.
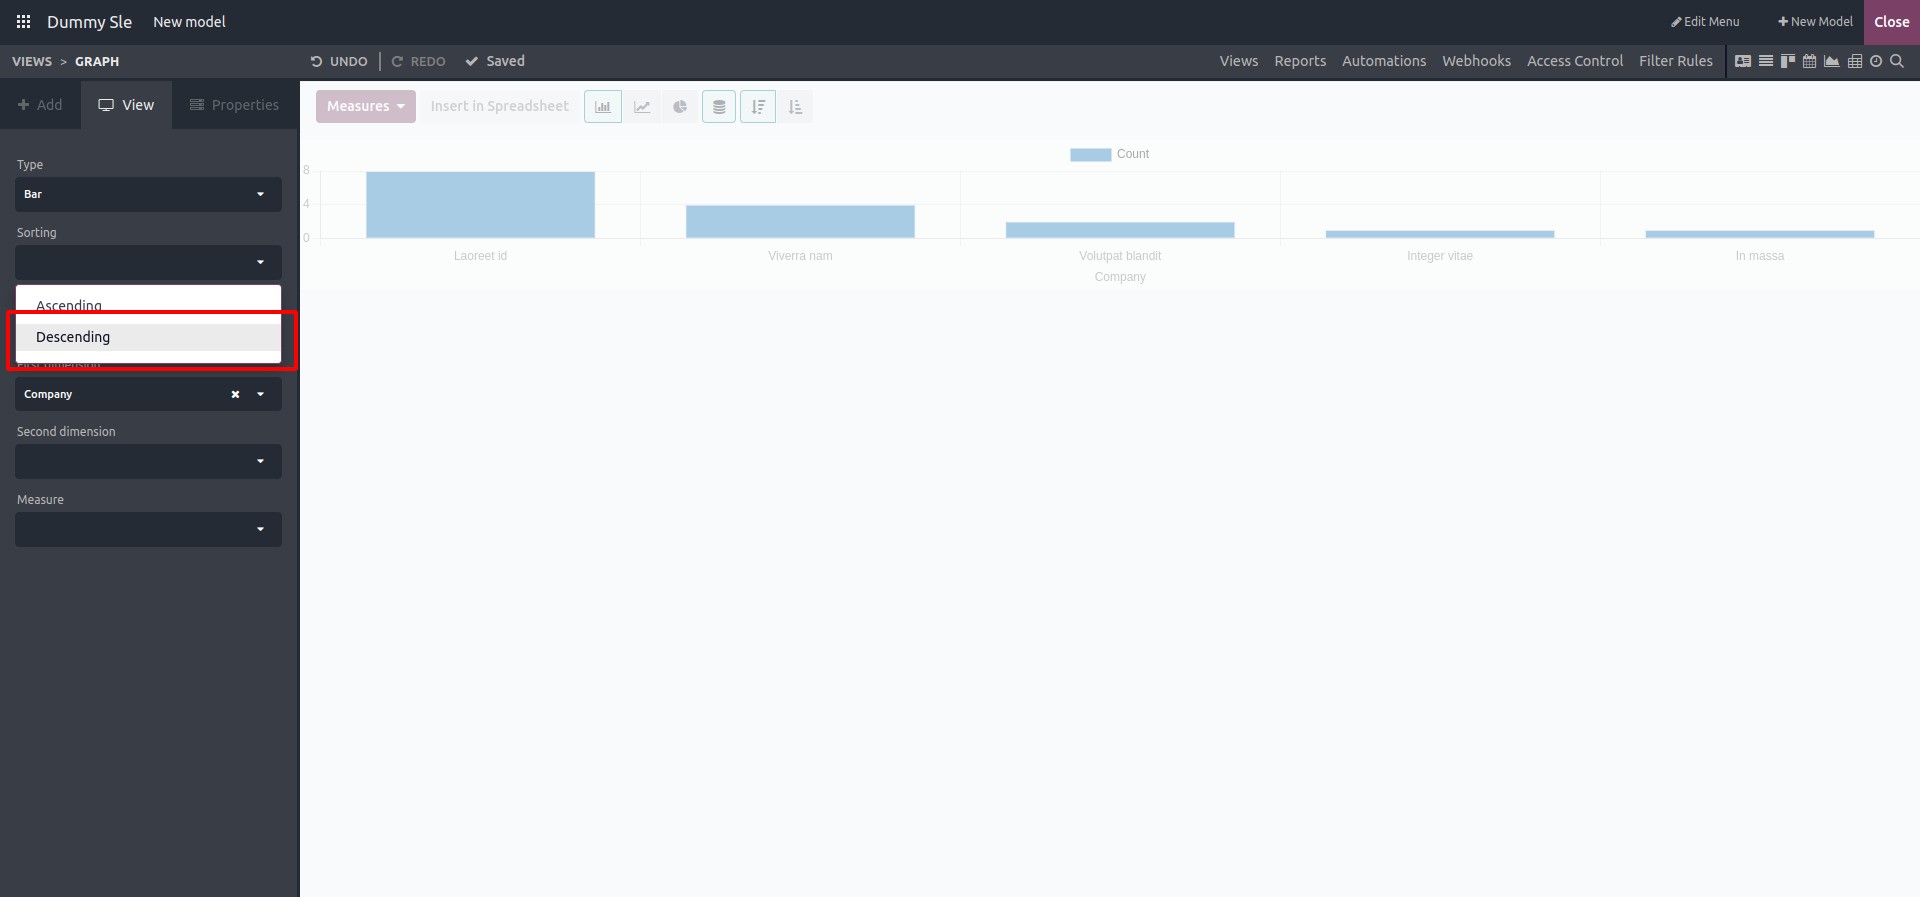
 This is the view in descending order.
Finally, Odoo's Studio module's bar chart feature allows users to display categorical or discrete data in a clear and straightforward manner, making patterns, trends, and comparisons within the data easier to understand. When analyzing sales figures, checking inventory levels, or tracking project progress, the bar chart in Odoo's Studio module provides a flexible and effective solution for visualizing data and gaining insights.