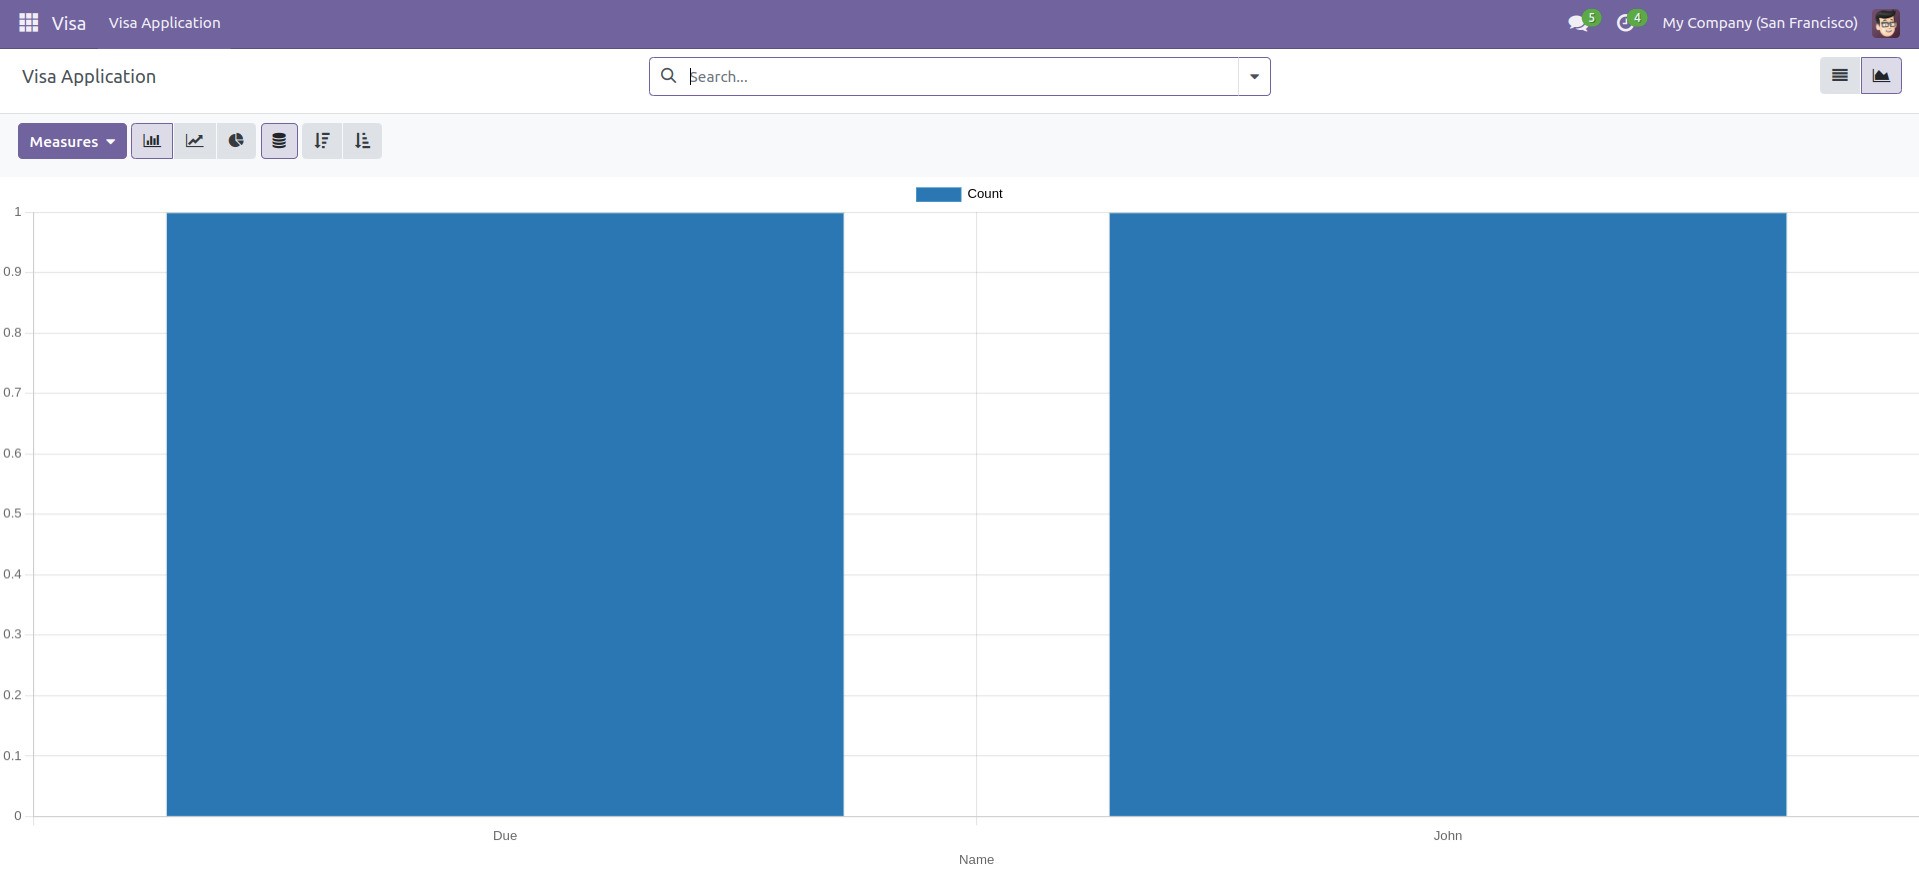
The graph view is one of the views provided by Odoo. It is a graphical representation of data that can be represented as a Bar chart, Pie chart, or Line chart. So that users can easily understand the records.
Let's make a graph view now:
I made a model visa_application.
                        class VisaApplication(models.Model):
                            _name = "visa.application"

                            name = fields.Char(string="Name", help="Name of the applicant")
                            age = fields.Integer(string="Age")
                            gender = fields.Char(string="Gender")
                            date_of_birth = fields.Date(string="Date of Birth")
Then, for the menu, add the action.
                        <record id="record_action" model="ir.actions.act_window">
                           <field name="name">Visa Application</field>
                           <field name="type">ir.actions.act_window</field>
                           <field name="res_model">visa.application</field>
                           <field name="view_mode">tree,form,graph</field>
                           <field name="help" type="html">
                               <p class="o_view_nocontent_smiling_face">
                                   Create a new record!
                               </p>
                           </field>
                        </record>

                        <menuitem id="parent_menu_root"
                                 name="Visa"
                                 sequence="6"/>
                        <menuitem id="menu_id"
                                 name="Visa Application"
                                 parent="parent_menu_root"
                                 action="record_action"
                                 sequence="10"/>
We can set the graph view for the model after we've created the model, menu, and action.
                            <record model="ir.ui.view" id="visa_application_graph">
                               <field name="name">visa.application.graph</field>
                               <field name="model">visa.application</field>
                               <field name="type">graph</field>
                               <field name="arch" type="xml">
                                   <graph string="Example" type="bar">
                                       <field name="name" group="True"/>
                                       <field name="name" operator="*"/>
                                   </graph>
                               </field>
                            </record>
The graph view model's output is,
