A pie chart is a type of chart that represents the data in a circular format. And it contains different sections, and each slice represents a proportionate part of the whole data.
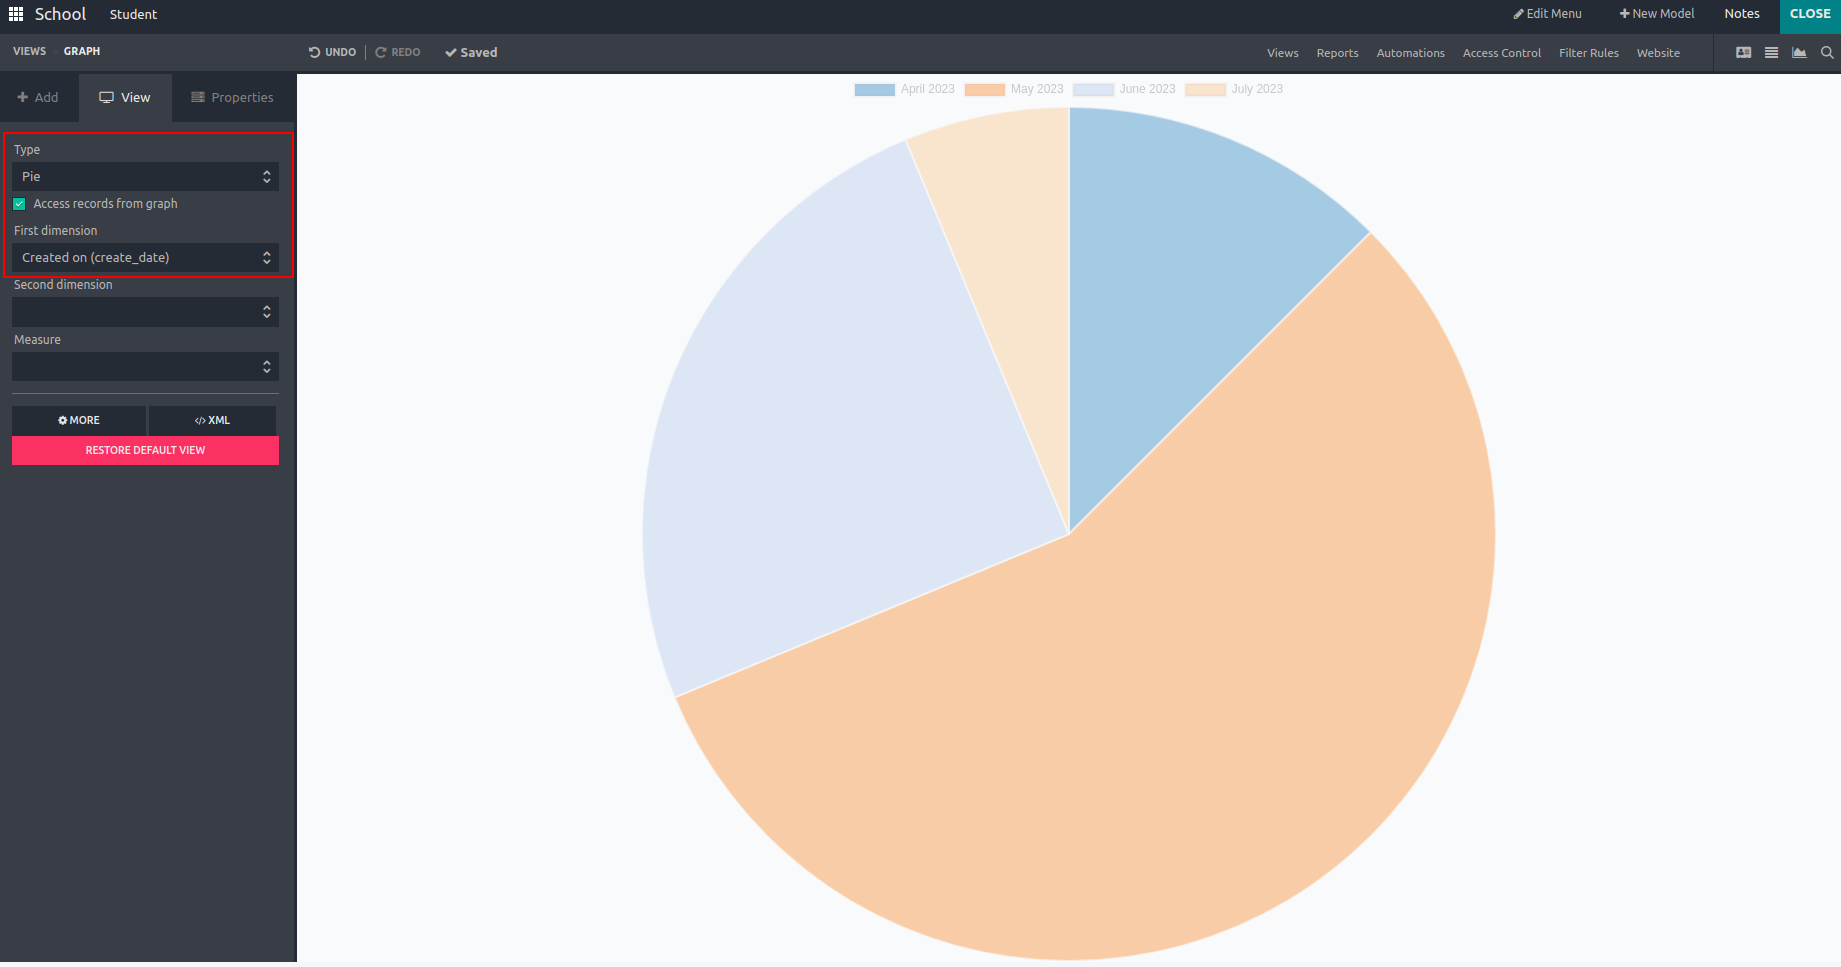
You can create the pie chart from the Graph Views option in the Studio Module. Under the View option, we can select the Type as Pie.

The following options can be chosen by the user in the view.
- Access records from the graph
- First Dimension
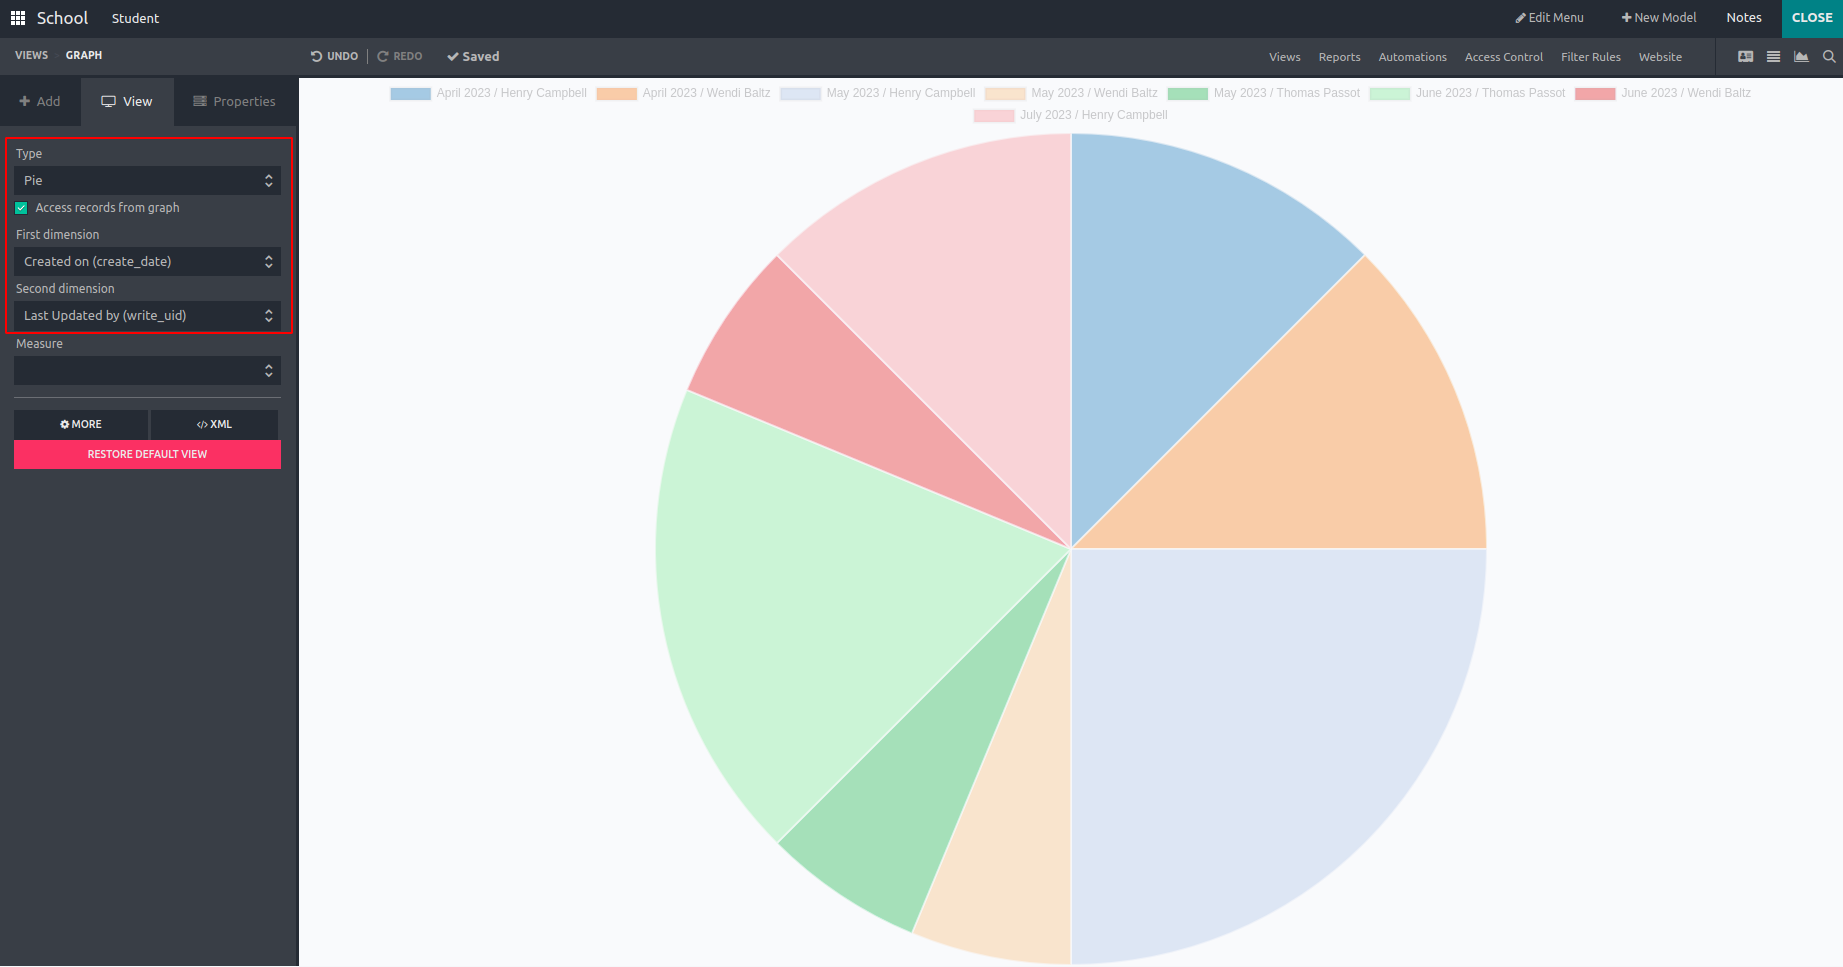
- Second Dimension
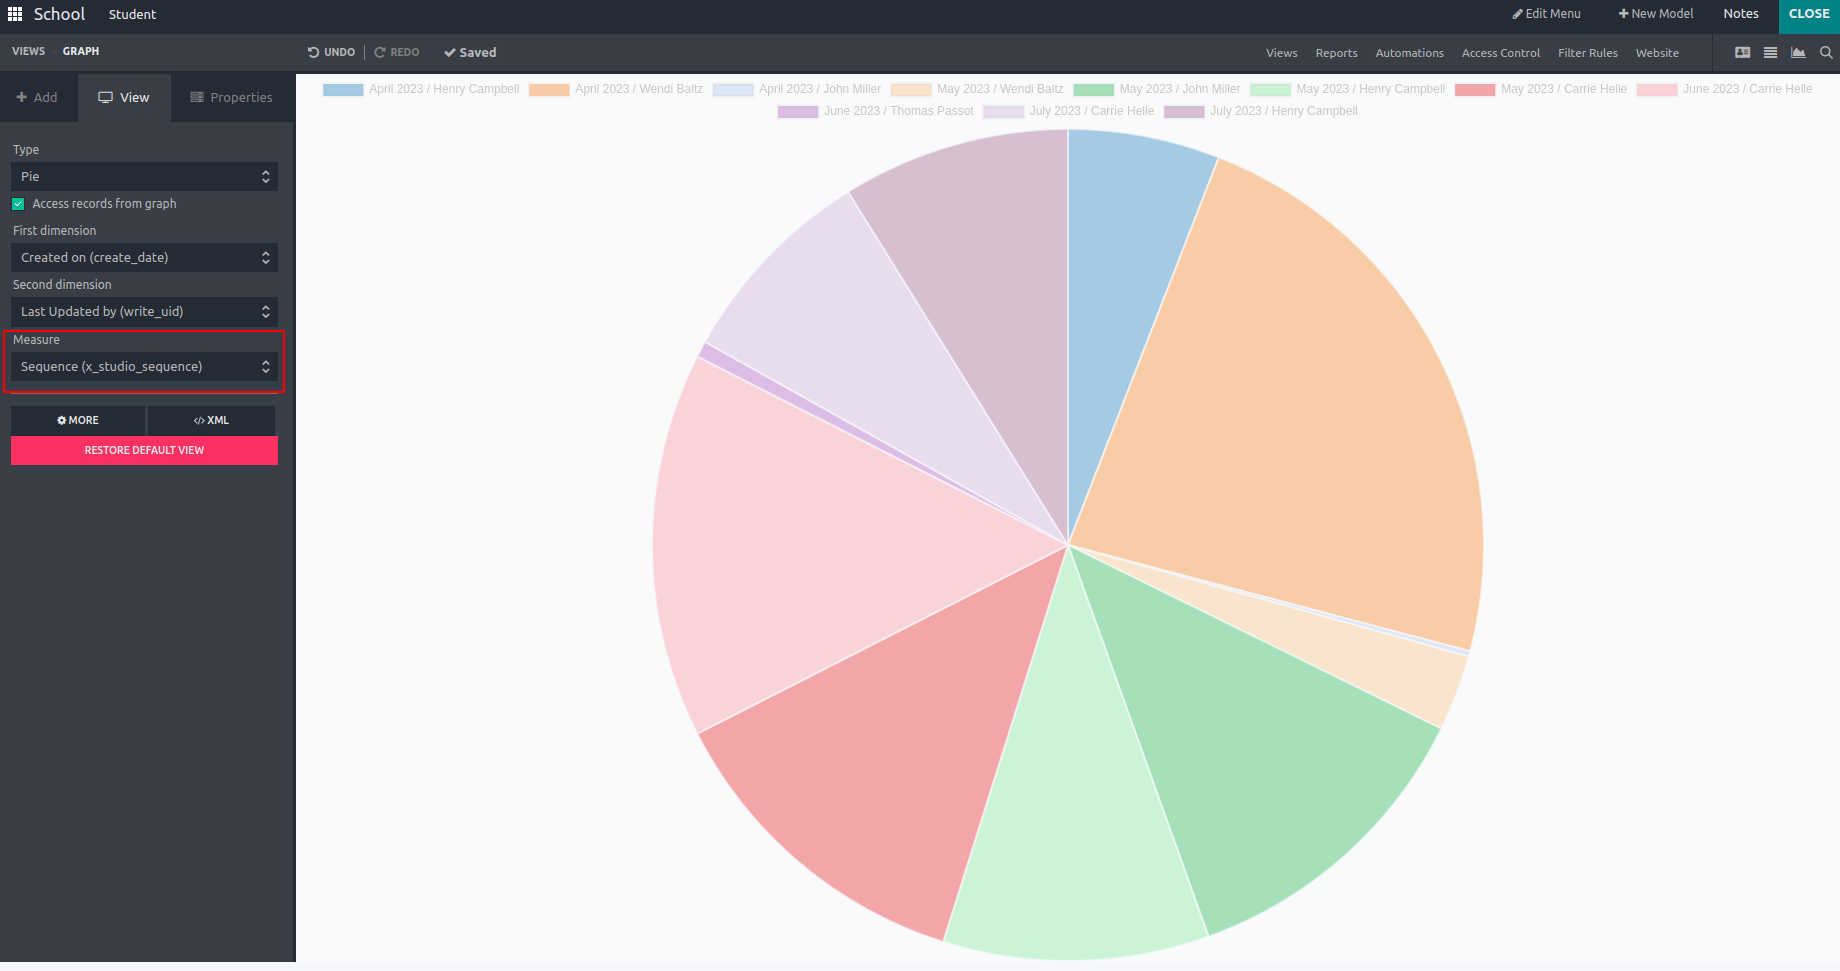
- Measures
By enabling the Access records from the graph option, the user can access the records from the pie chart. And you can set the data dimension using the First Dimension and Second Dimension options.

Choose a field under Measure to specify the default type of data to be measured using the view.
