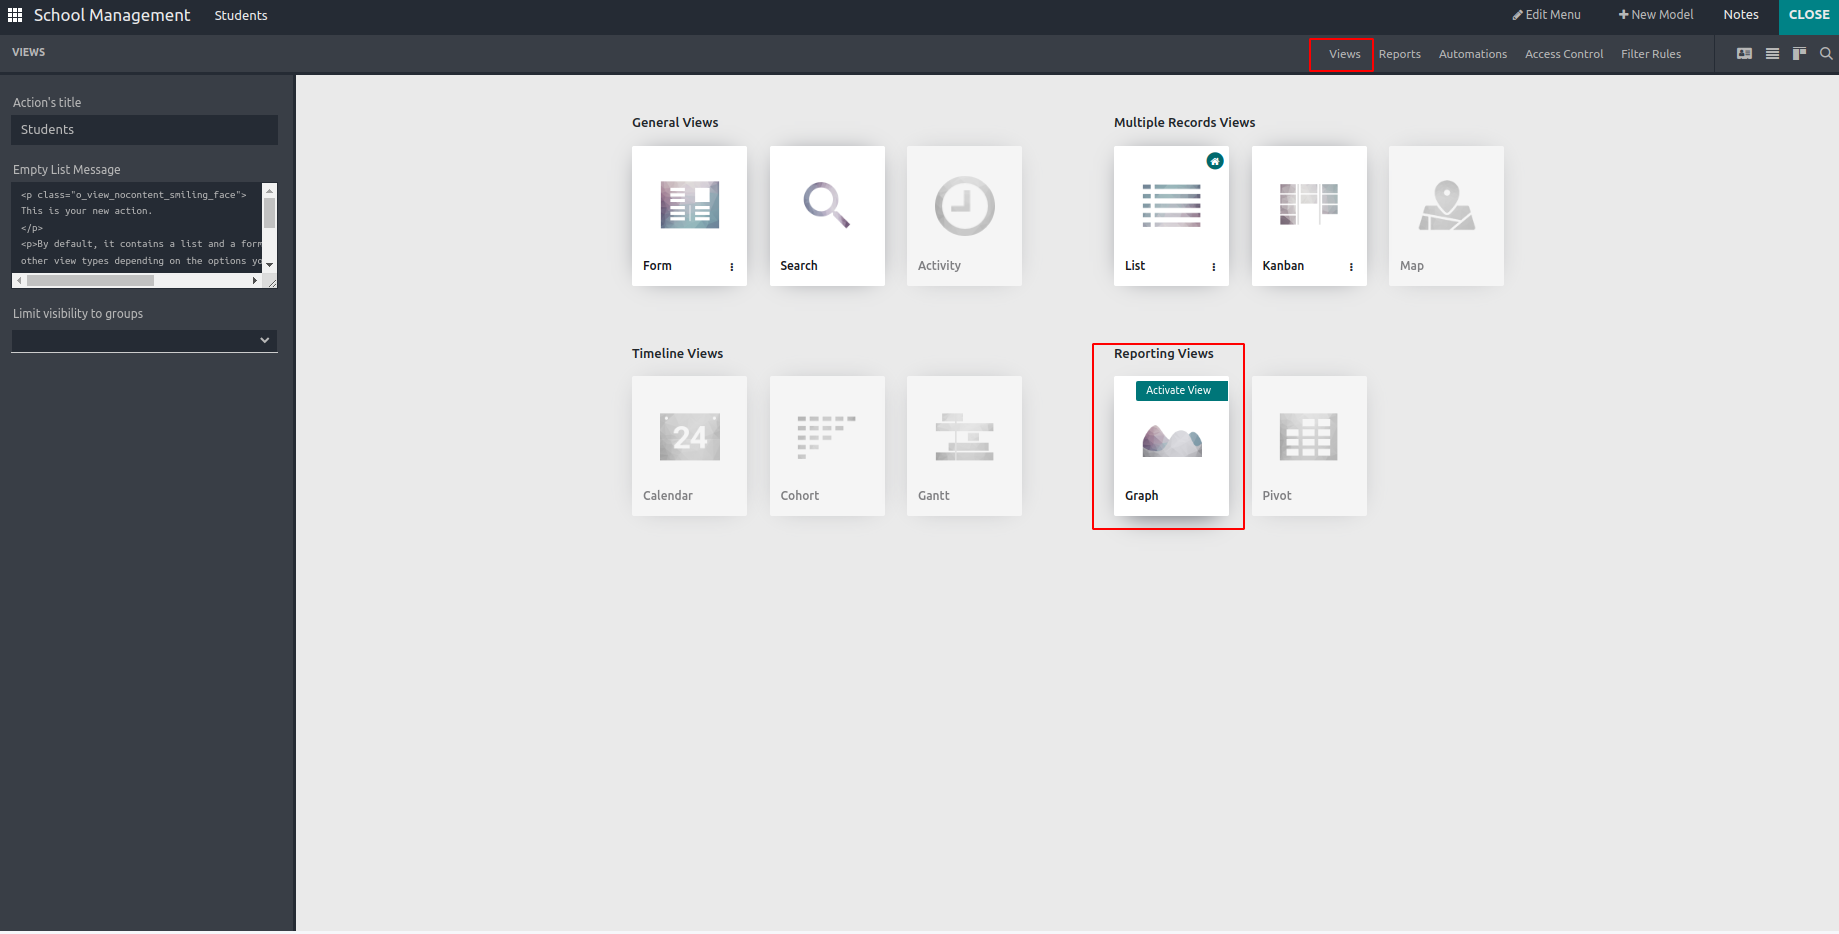
Graph View is the graphical representation of the data. Odoo supports different kinds of graph views like bar charts, pie charts, and line charts. You can see the Graph option under the Reporting Views category in the Views option of the studio module. To activate, just click on the Graph option.

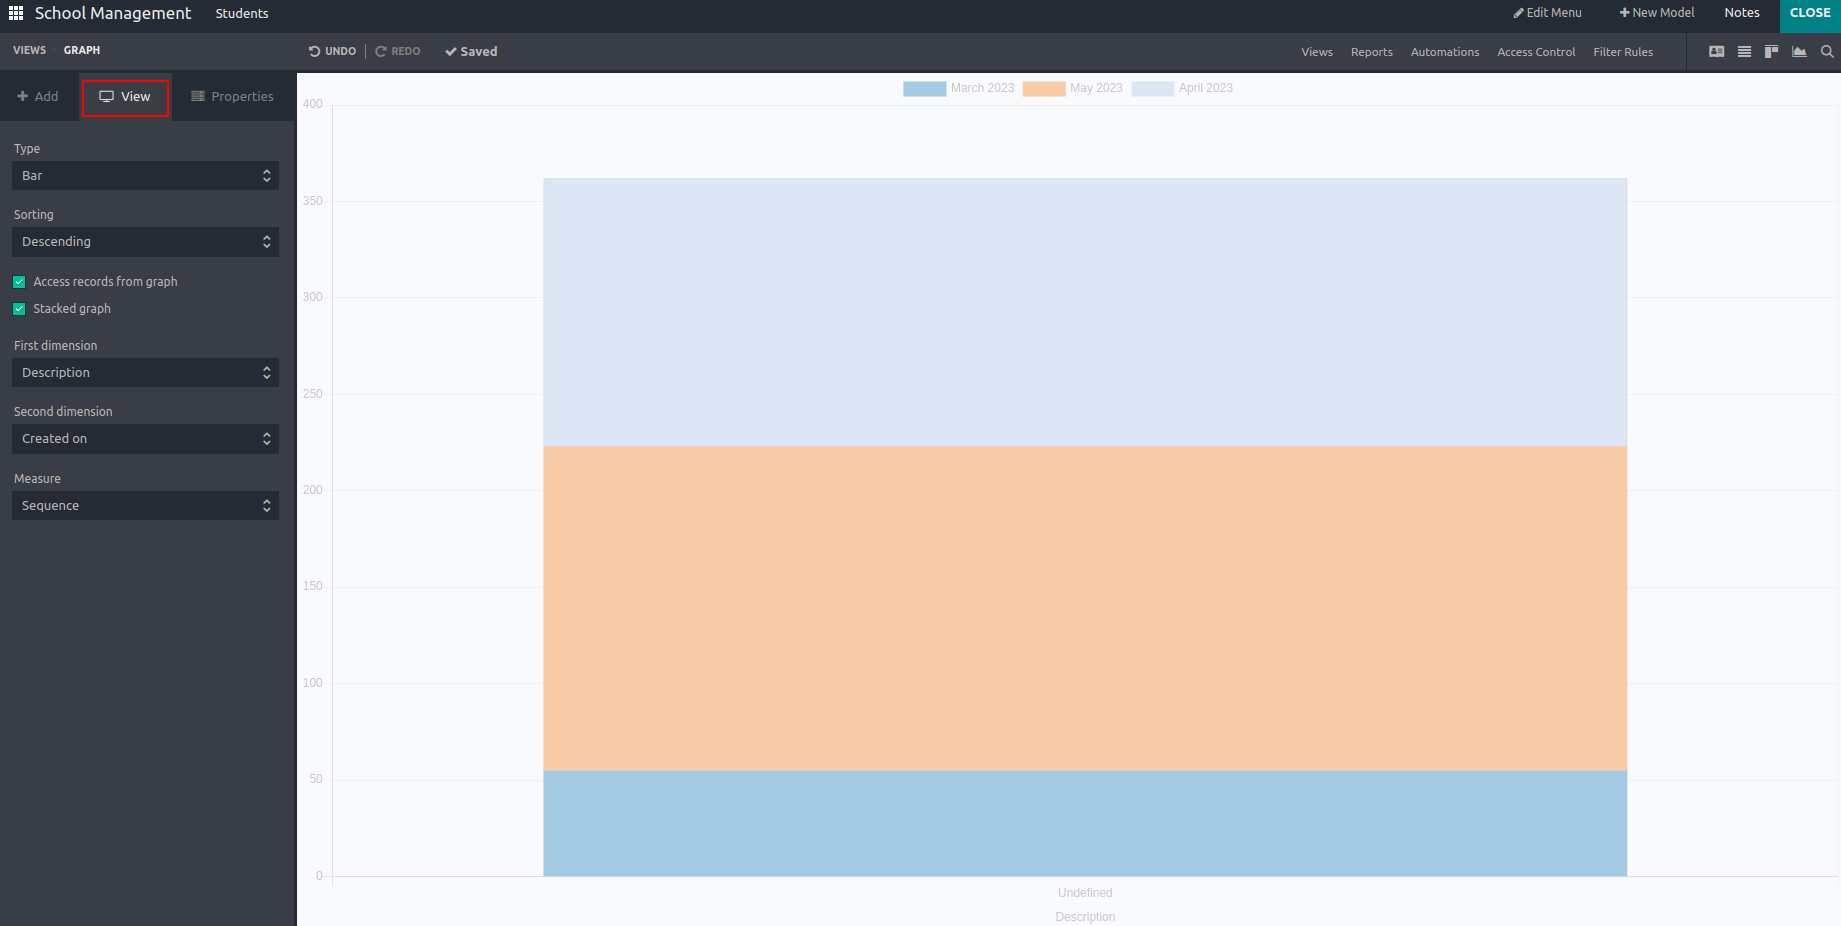
After the activation, you will get a new window. From there, you can modify the graph using the option View. In the View option, we get the following options:
- Type: In the Type option, can change the default chart type like Pie, Bar, or Line.
- Sorting: The sorting option is only available in Bar and Line charts. We can sort the data in Ascending or Descending order
- First dimension: We can choose the default data dimension or category in this option. Select the field under the first dimension.
- Second dimension: Similarly, if you want another dimension, you can select the field under the second dimension.
- Measure: Choose a field under Measure to specify the default type of data to be measured with the view.
- Access records from graph: This option is only for Bar and pie charts. Tick the box that says "Access records from graph" to gain access to all records whose data is classified under a certain data category on the chart.
- Stacked graph: It is only for Bar Charts. Display the two columns on top of one another by default when utilizing two data dimensions (categories) by selecting the Stacked graph checkbox.

You can change the default type by selecting the type. In the View, theAccess records from graph option are applicable for Bar Chart and Pie Chart.