A Gantt chart is a visual representation of a project schedule that shows start and end dates of each task within a project. It is named after its inventor, Henry Gantt, who created the chart in the early 1900s as a tool for scheduling and managing large manufacturing projects.
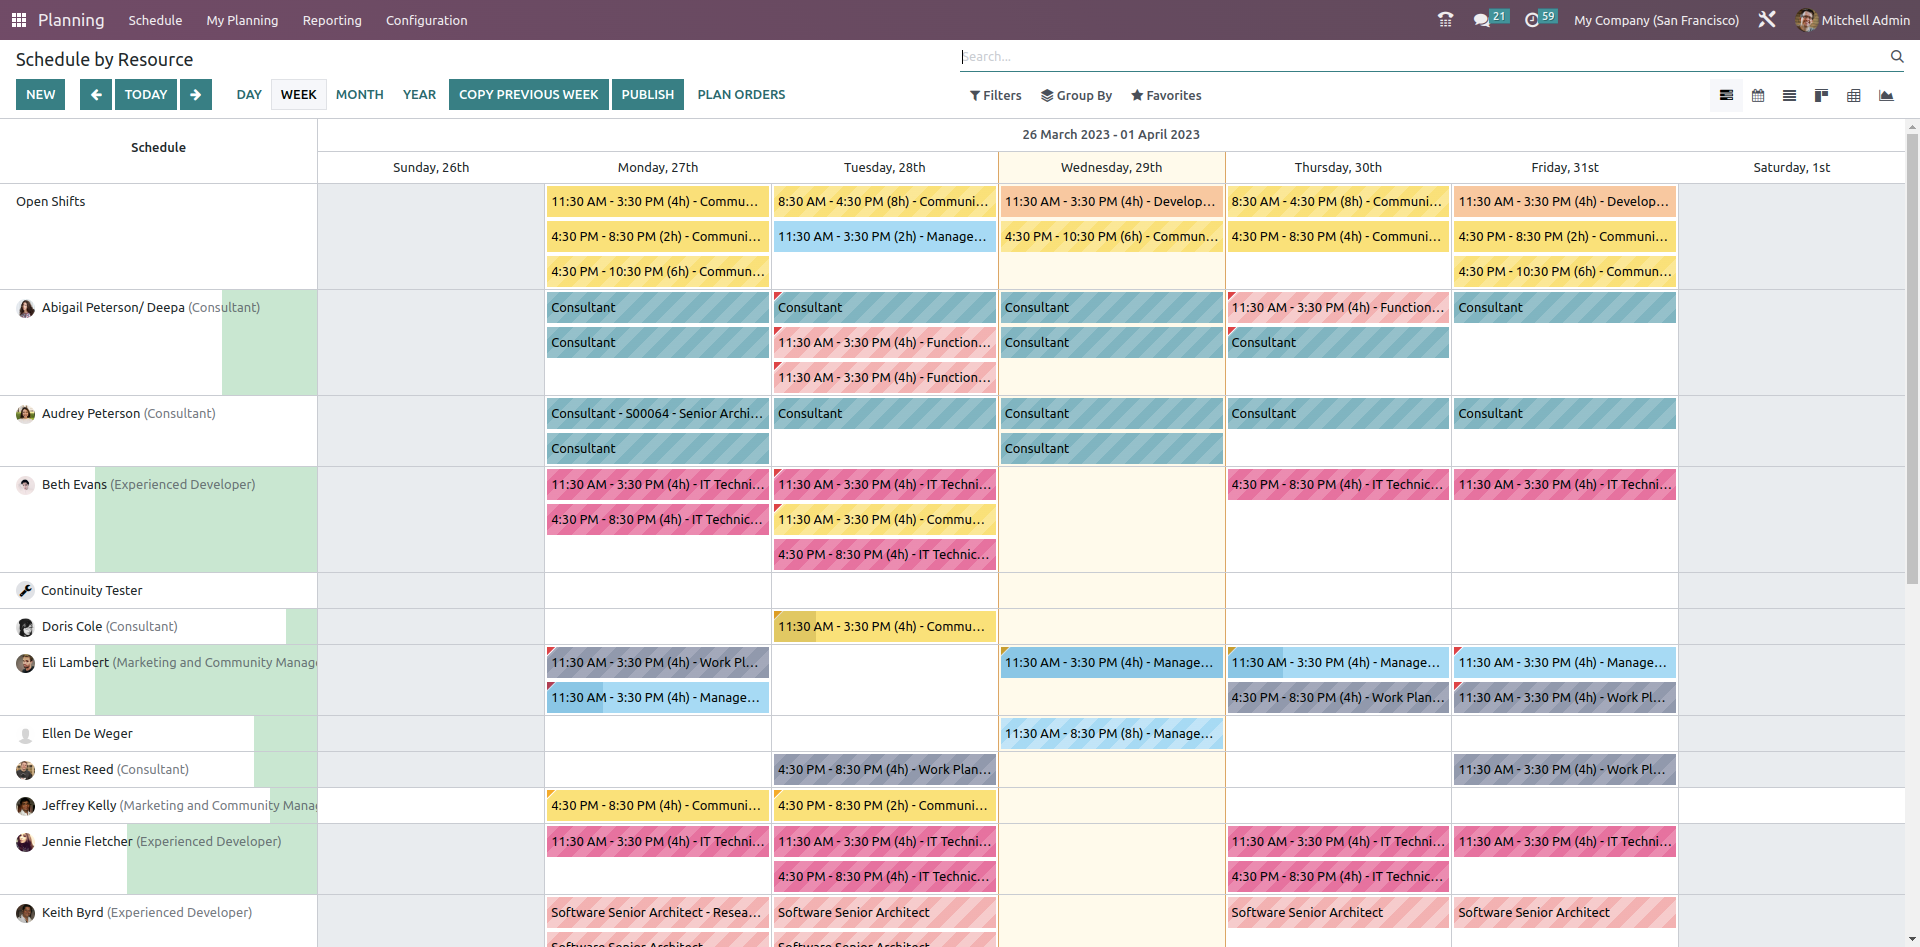
Now let’s see how to add a Gantt view using Studio:
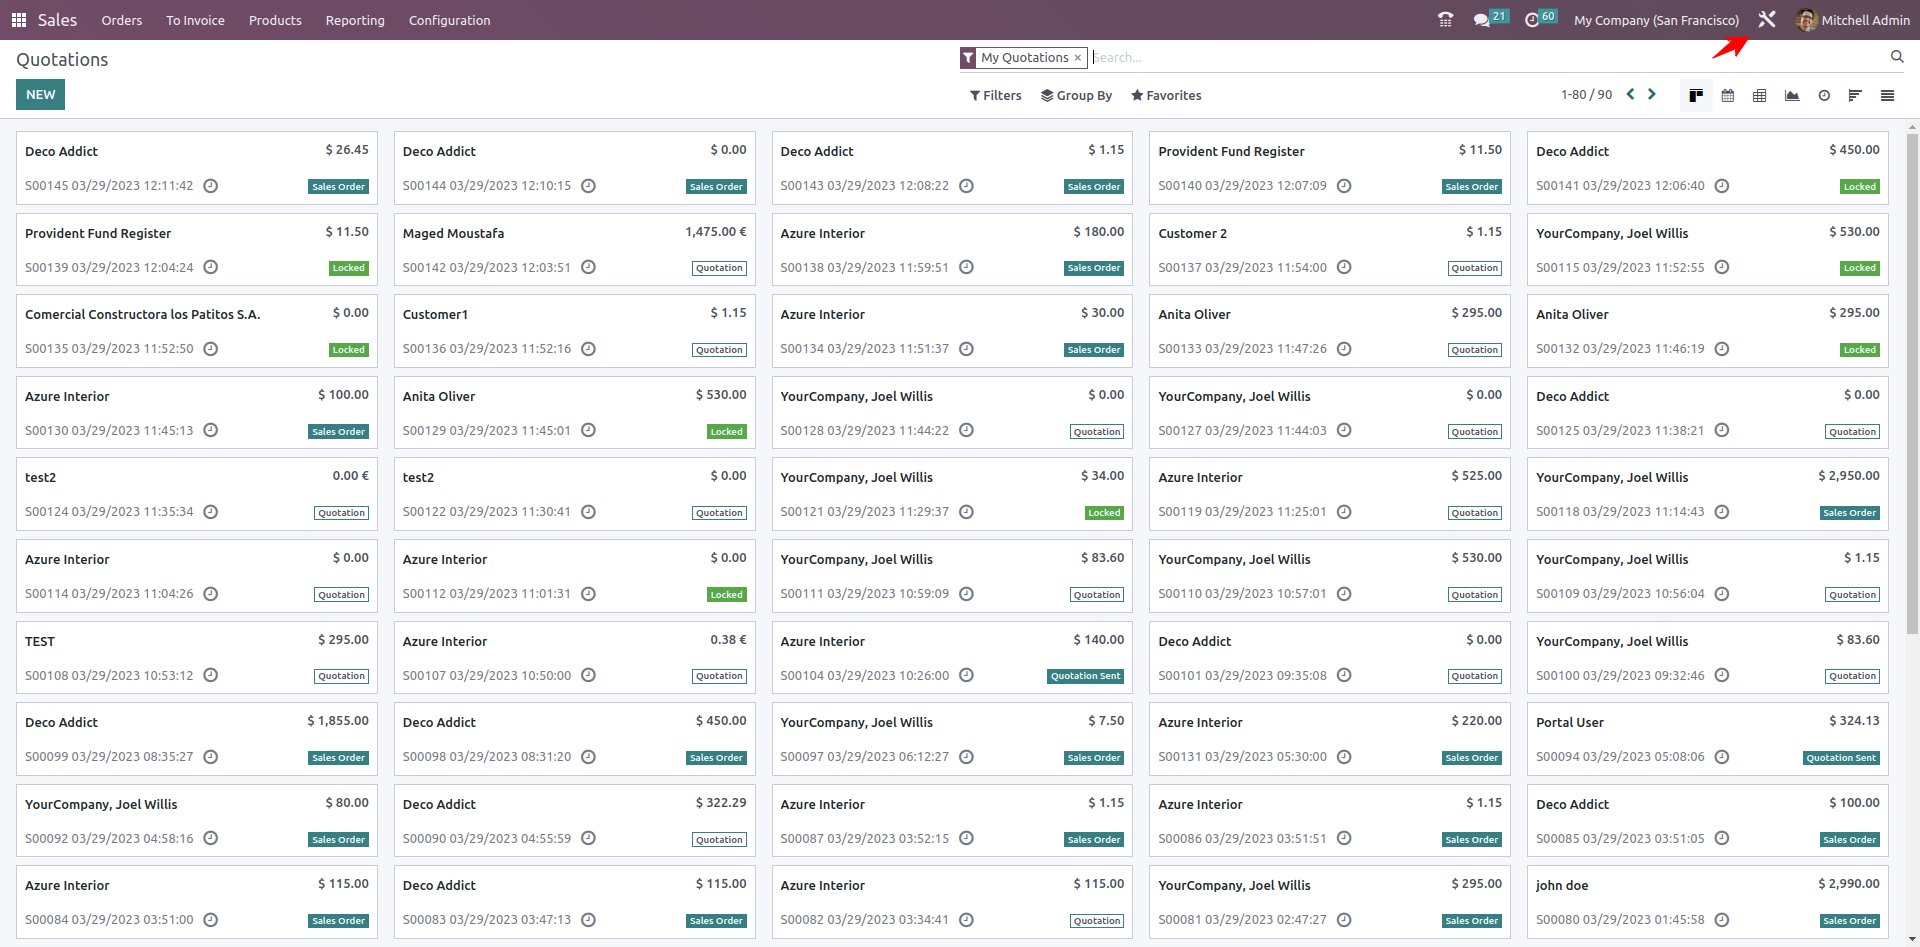
Choose the module where you want to add a Gantt view. Click the studio icon.
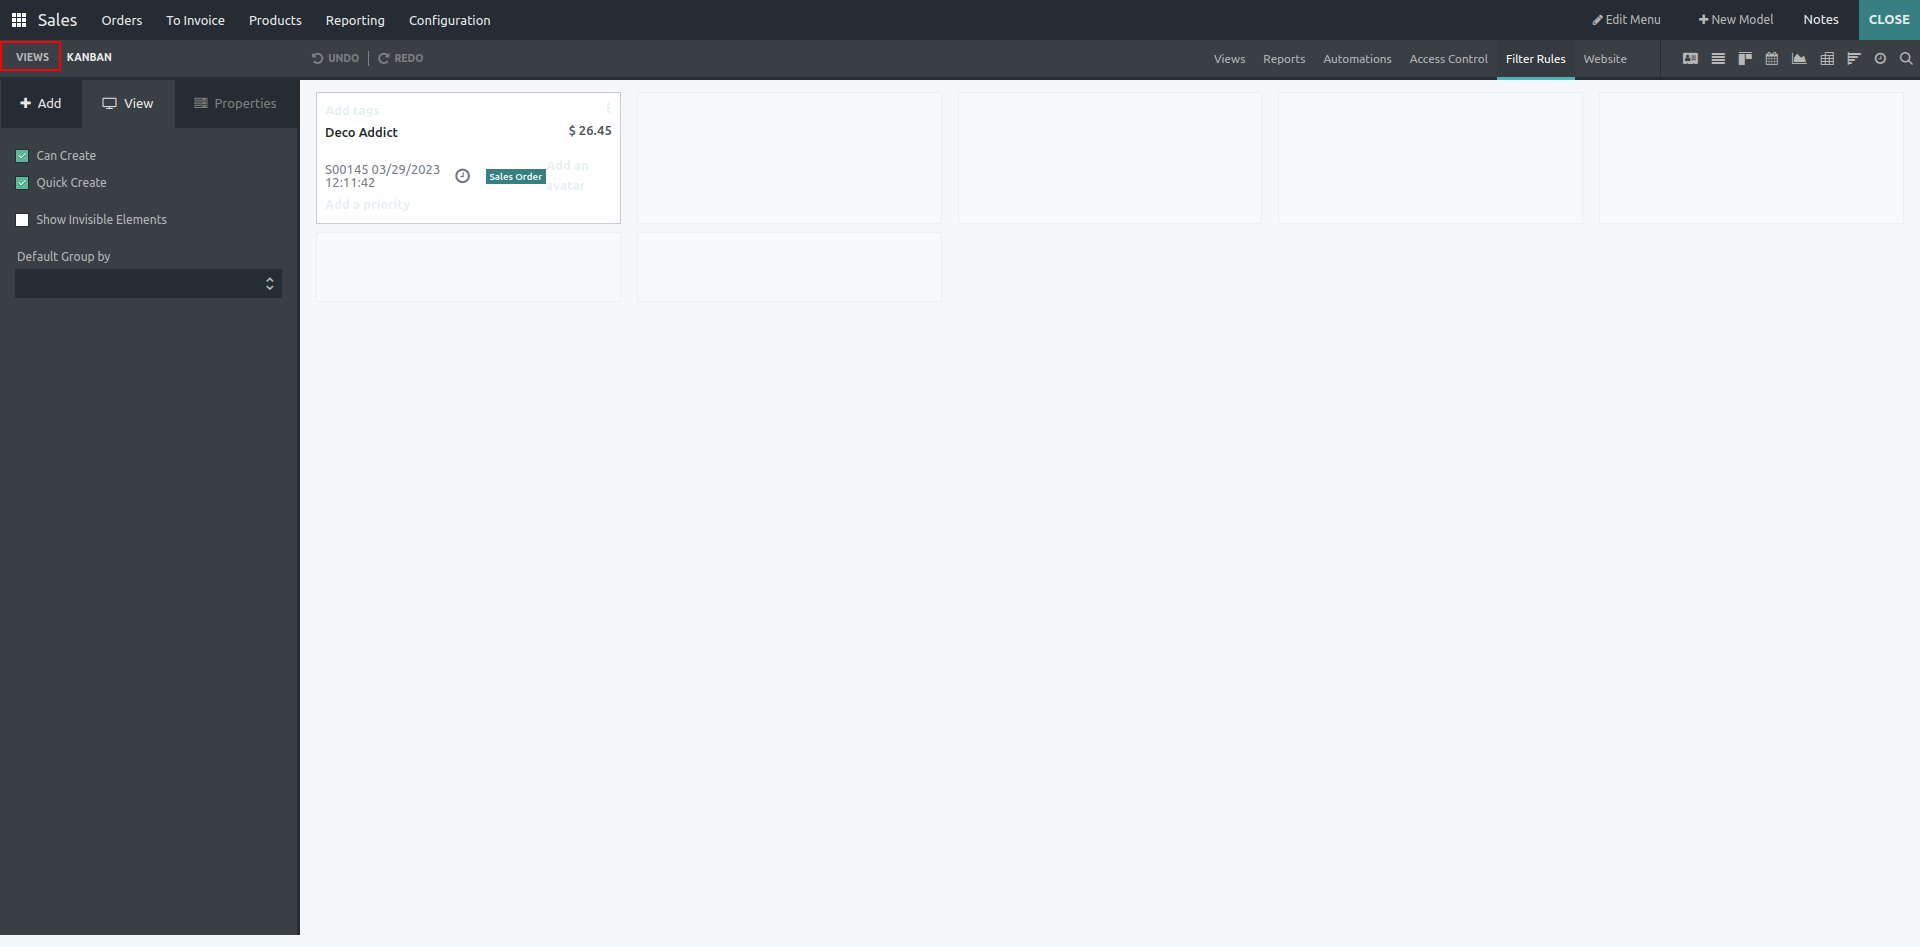
Click on the views
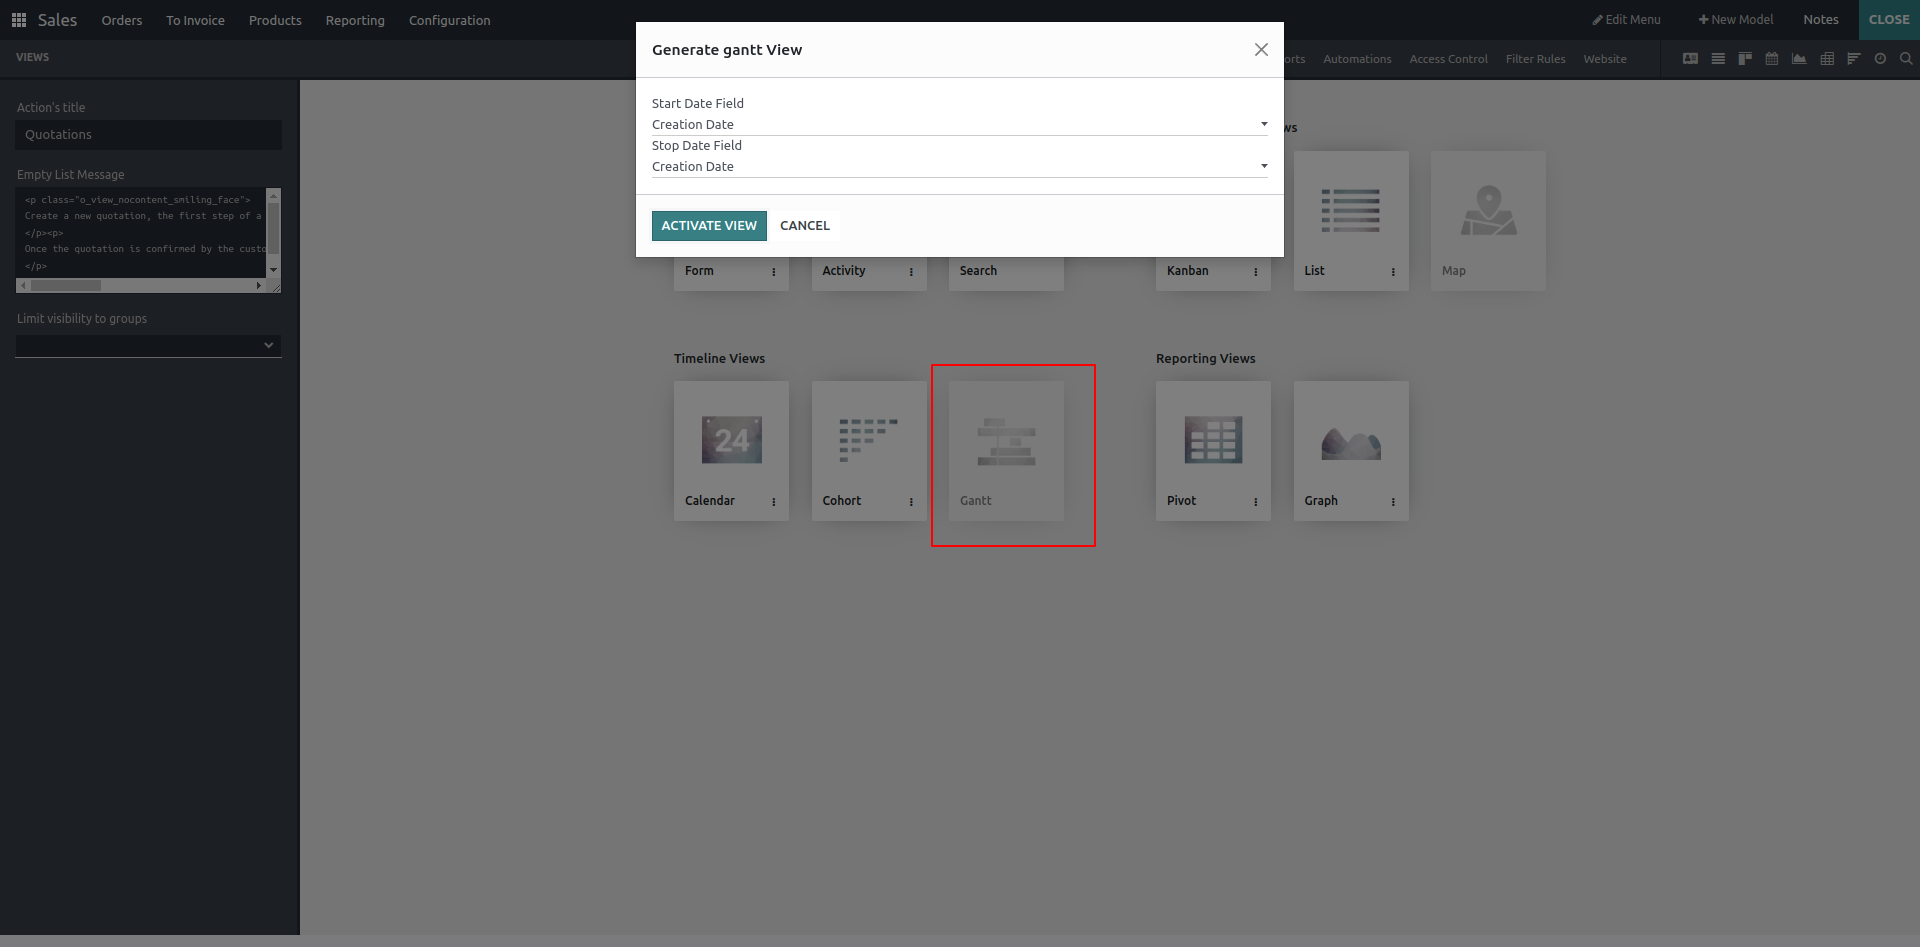
Click on Gantt and you will see a small widget, based on the start and end date gantt view is created
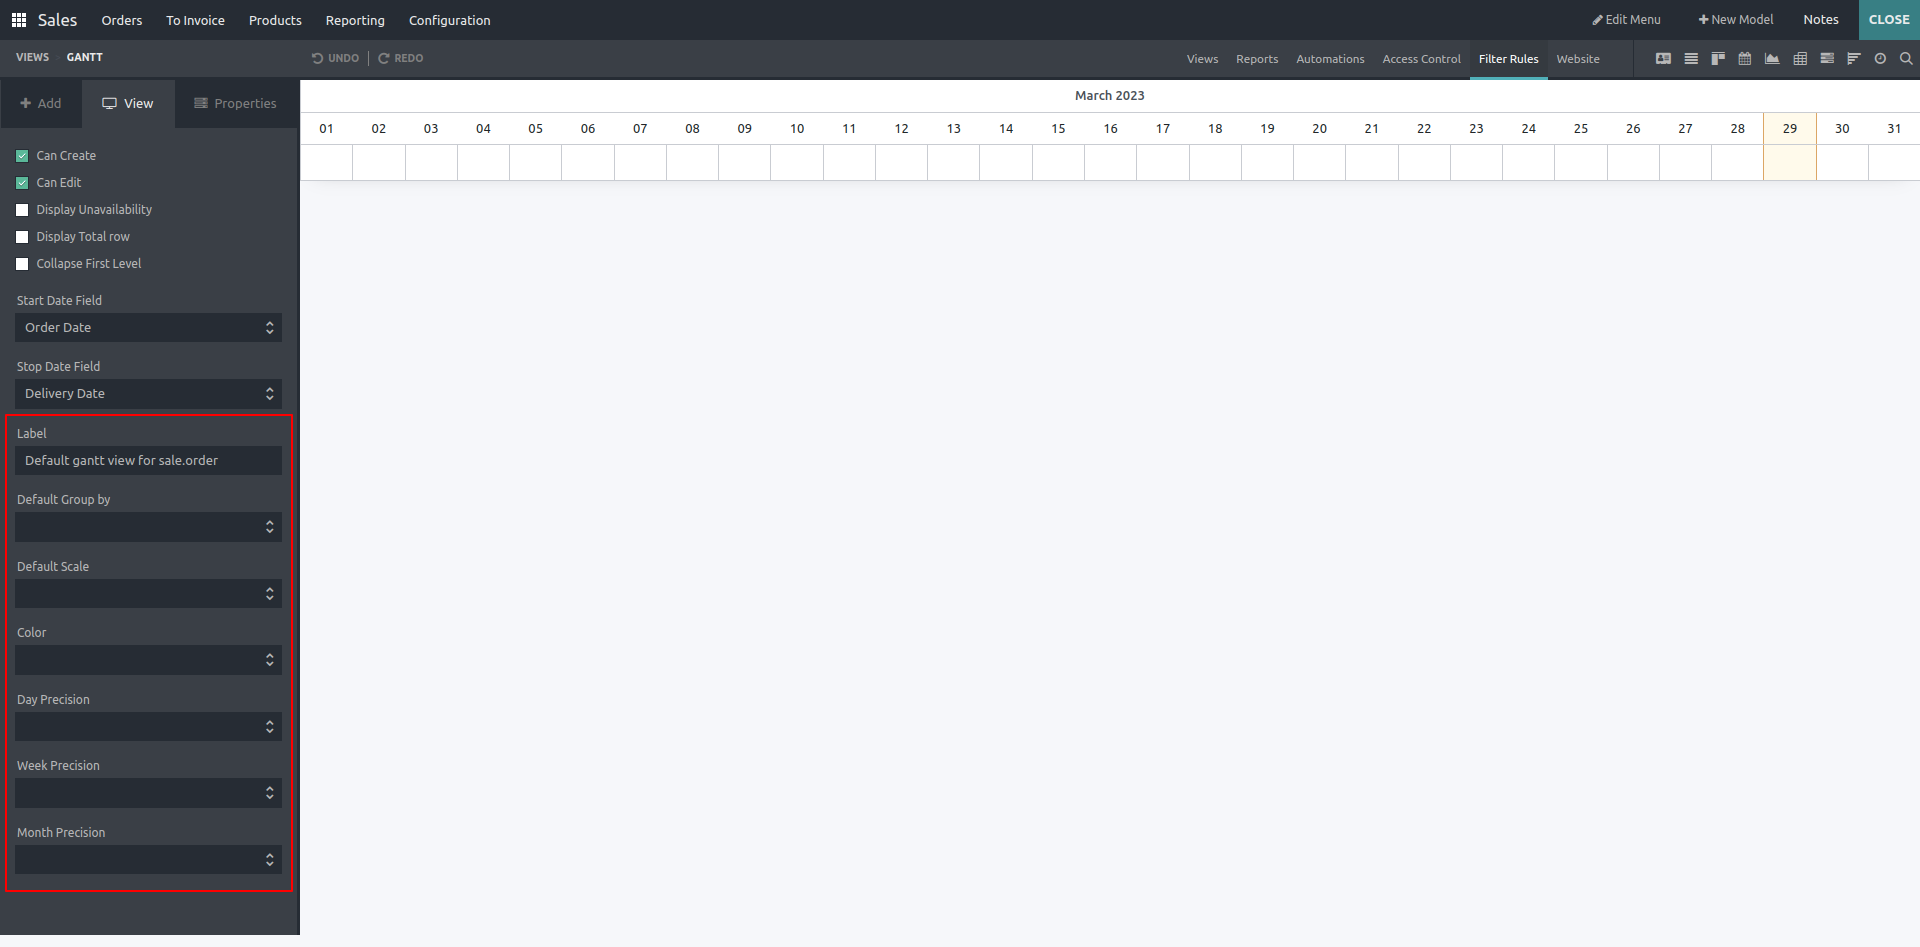
Start Date Field: A date field to specify the starting date of a Gantt item.
Stop Date Field: Field to specify stop date.
Label: It is the label given to the Gantt view. By default, the view name is set as label.
Default Group By: Based on which data view should be grouped.
Default Scale: Here, we can set the default scale, i.e., day, month, week, and year.
Color: It’s the name of the fields, based on their value boxes are colored.
Day Precision: Values are quarter hour, half hour, and hour.
Quarter hour - If the time is 12:10, it records the time as 12:15.
Half hour - It records the time as 12:30
Hour - It records the time as 1:00
Week Precision: Values are half day and day.
Half day - It records the time as 12 pm if it's 10 am.
Day - It snaps to full day, ie. if it's 7:20 am, it records the time as 11:59:59 pm of the previous day, and if it's 1 pm, it records the time as 11:59:59pm of that particular day.
Month Precision: It has the same values of week precision, and its functionalities are also the same.
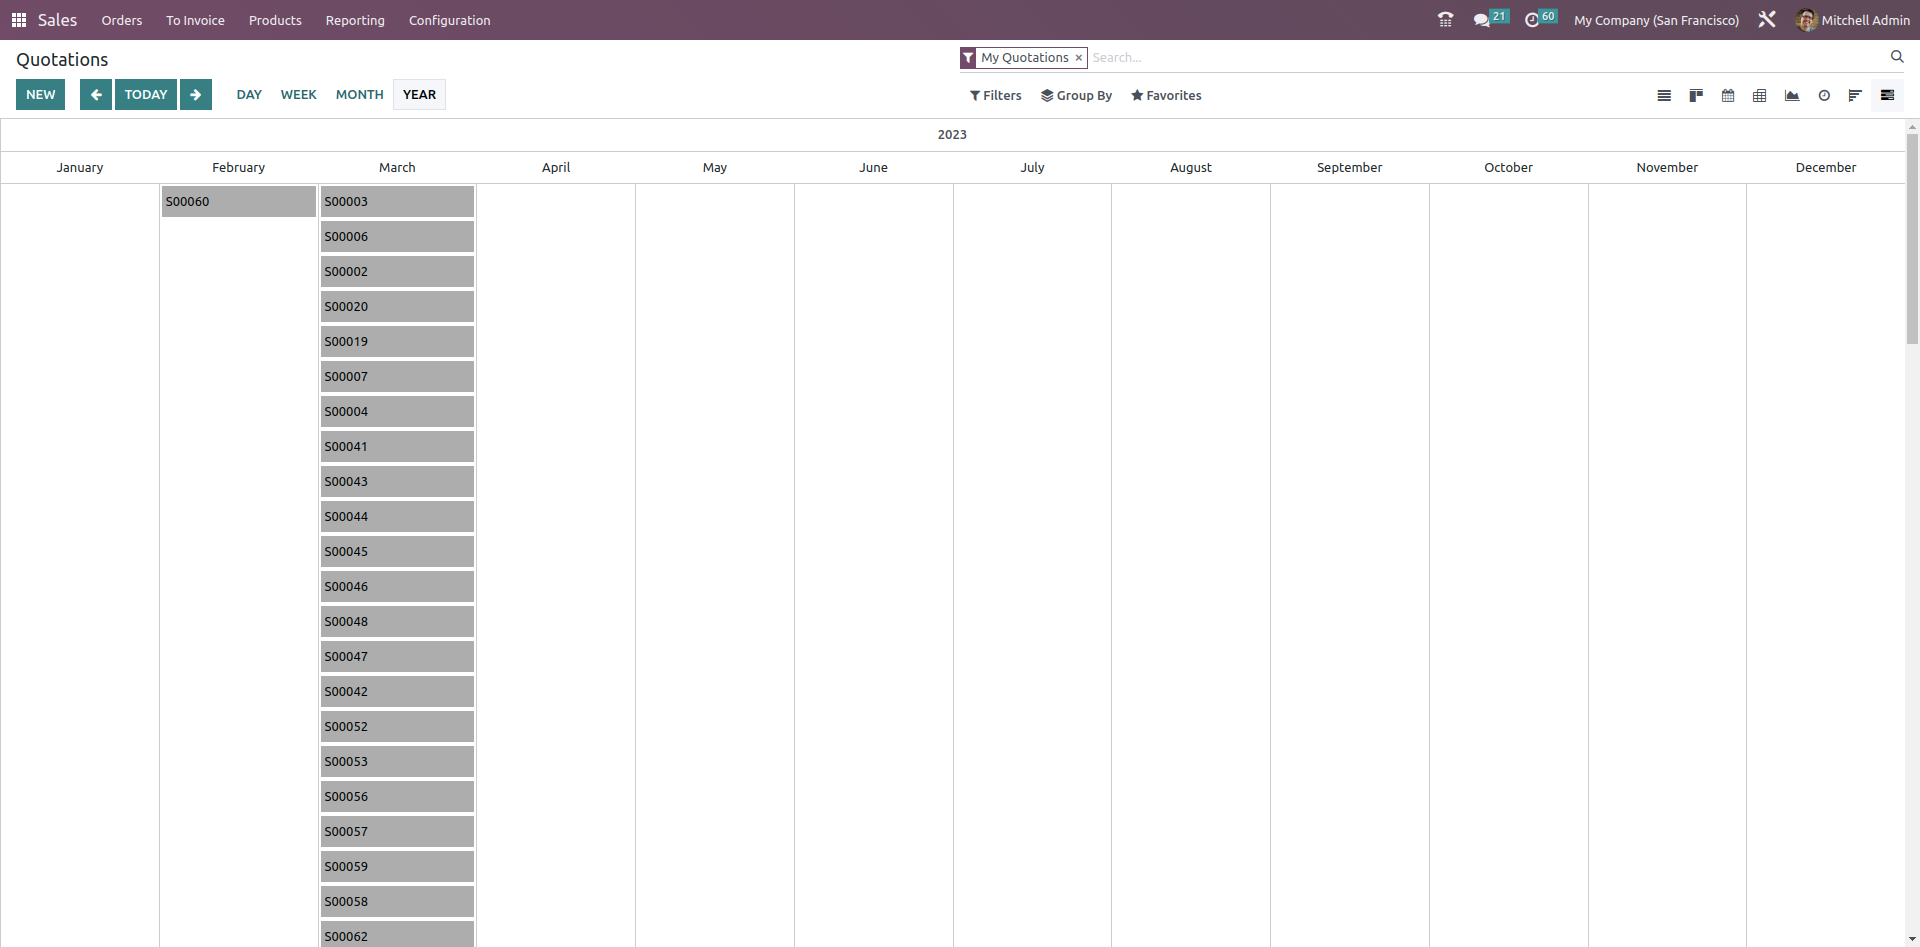
After filling in the details, close studio, and you will get the Gantt view in the views