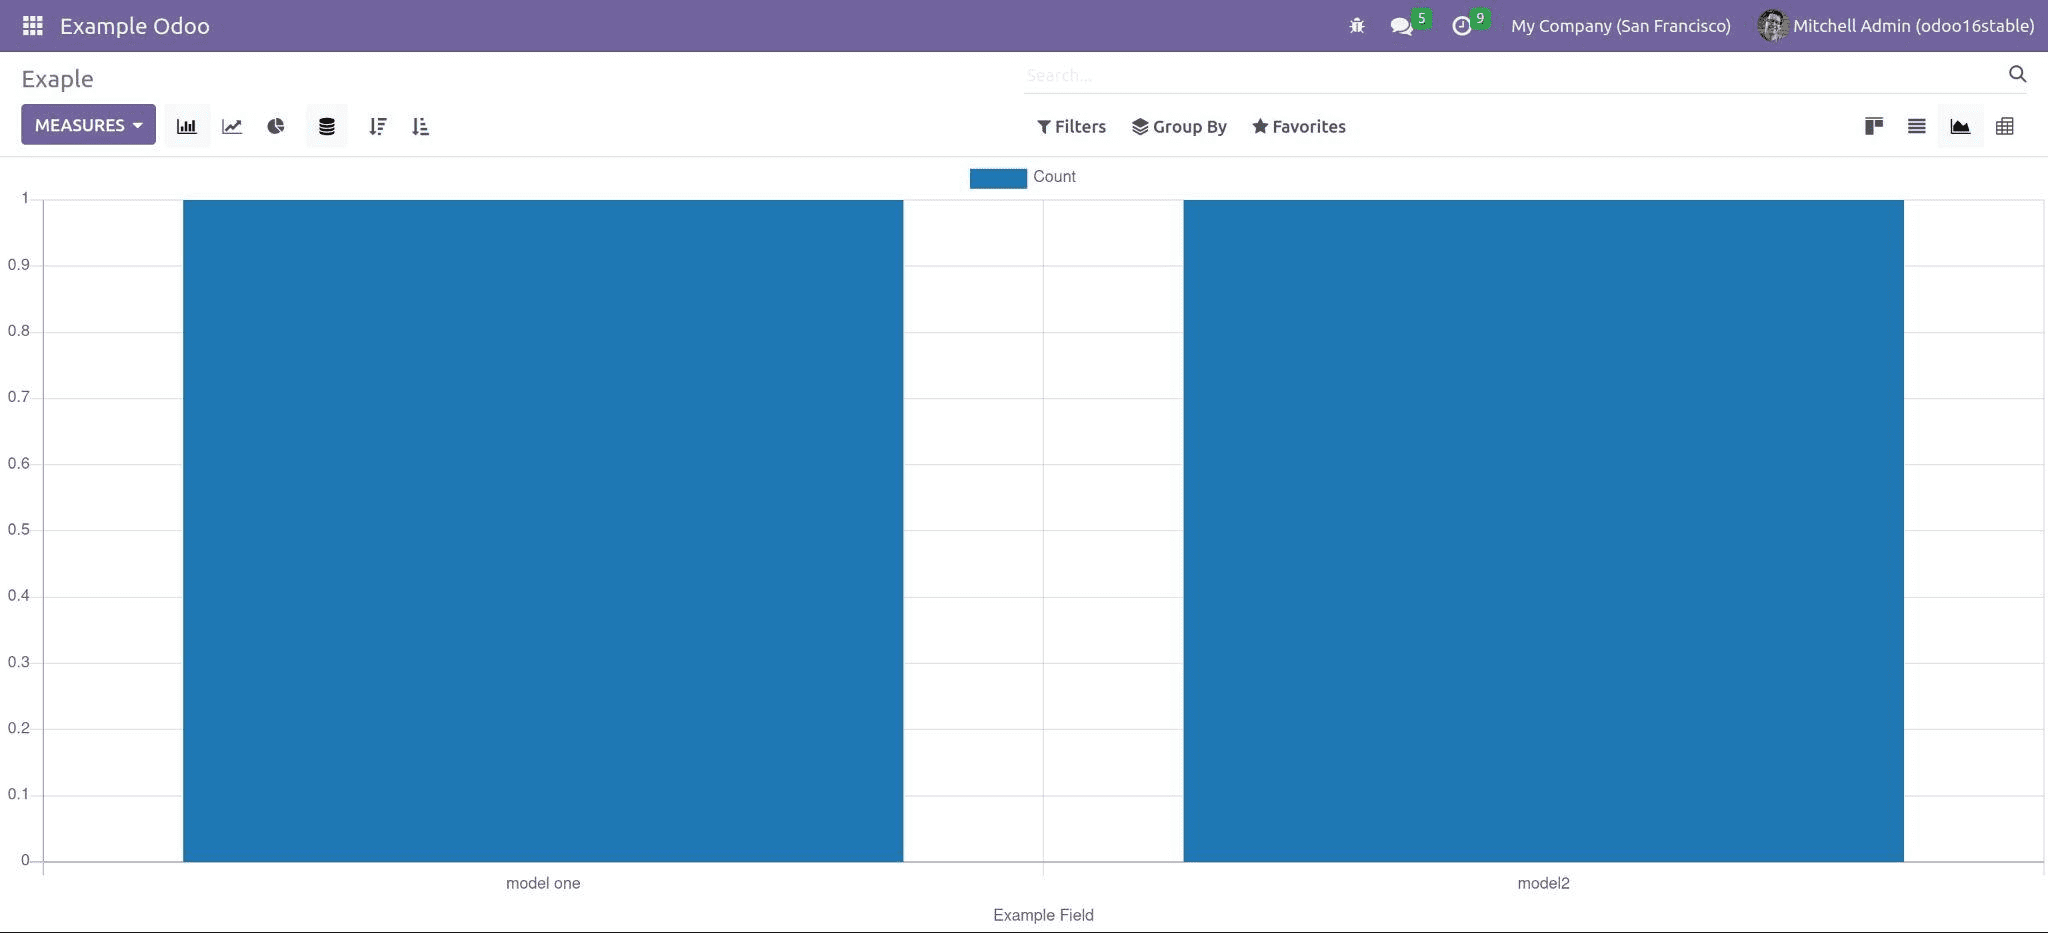
Graph view
One of the views that Odoo provided to us is the graph view. It is a graphical view of the data, and it can be represented like a Bar chart, Pie chart, and Line chart. So that users get an easy understanding of the records.
Now let’s create a graph view:
Created a model example.
from odoo import models, fields
class ExampleOdoo(models.Model):
    _name="example.odoo"
    example_field = fields.Char(string="Example Field")
    example_field1 = fields.Many2one('res.users', 'User', required=True)
And then add the action for the menu,
<record id="action_Example" model="ir.actions.act_window">
                <field name="name">Example</field>
                       <field name="type">ir.actions.act_window</field>
                       <field name="res_model">example.odoo</field>
                       <field name="view_mode">kanban,tree,form,graph,pivot</field>
                   </record>
                   <menuitem id="example_menu"
                           name="Example Odoo"
                           action="action_Example"/>
After creating the model, menu and the action we can set the graph view for the model.
<record model="ir.ui.view" id="example_graph_view">
                            <field name="name">example.graph</field>
                            <field name="model">example.odoo</field>
                            <field name="type">graph</field>
                            <field name="arch" type="xml">
                                    <graph string="Example" type="bar">
                                        <field name="example_field" group="True"/>
                                        <field name="example_field" operator="*"/>
                                    </graph>
                            </field>
                     </record>
The output of graph view model is,
