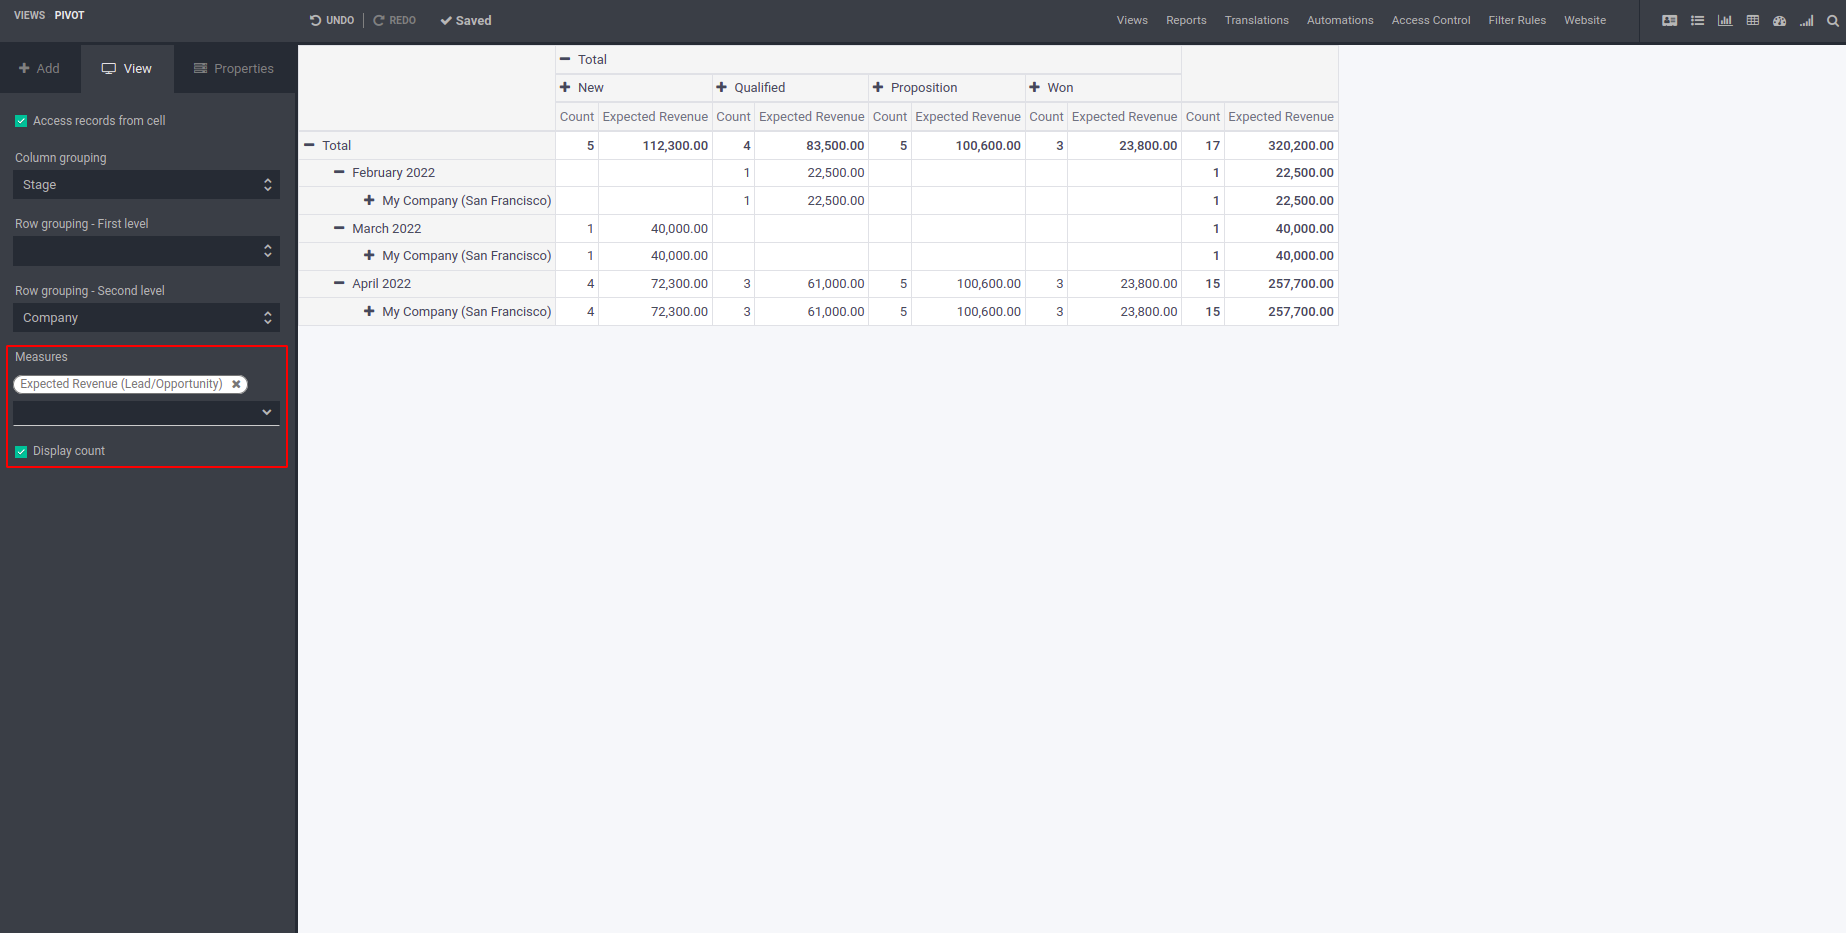
A PivotTable represents grouped values that summarizes the individual elements of
a larger table within one or more individual categories. This summary can include
totals, averages, or other statistics. Users can also group dataset by column wise
and row wise.
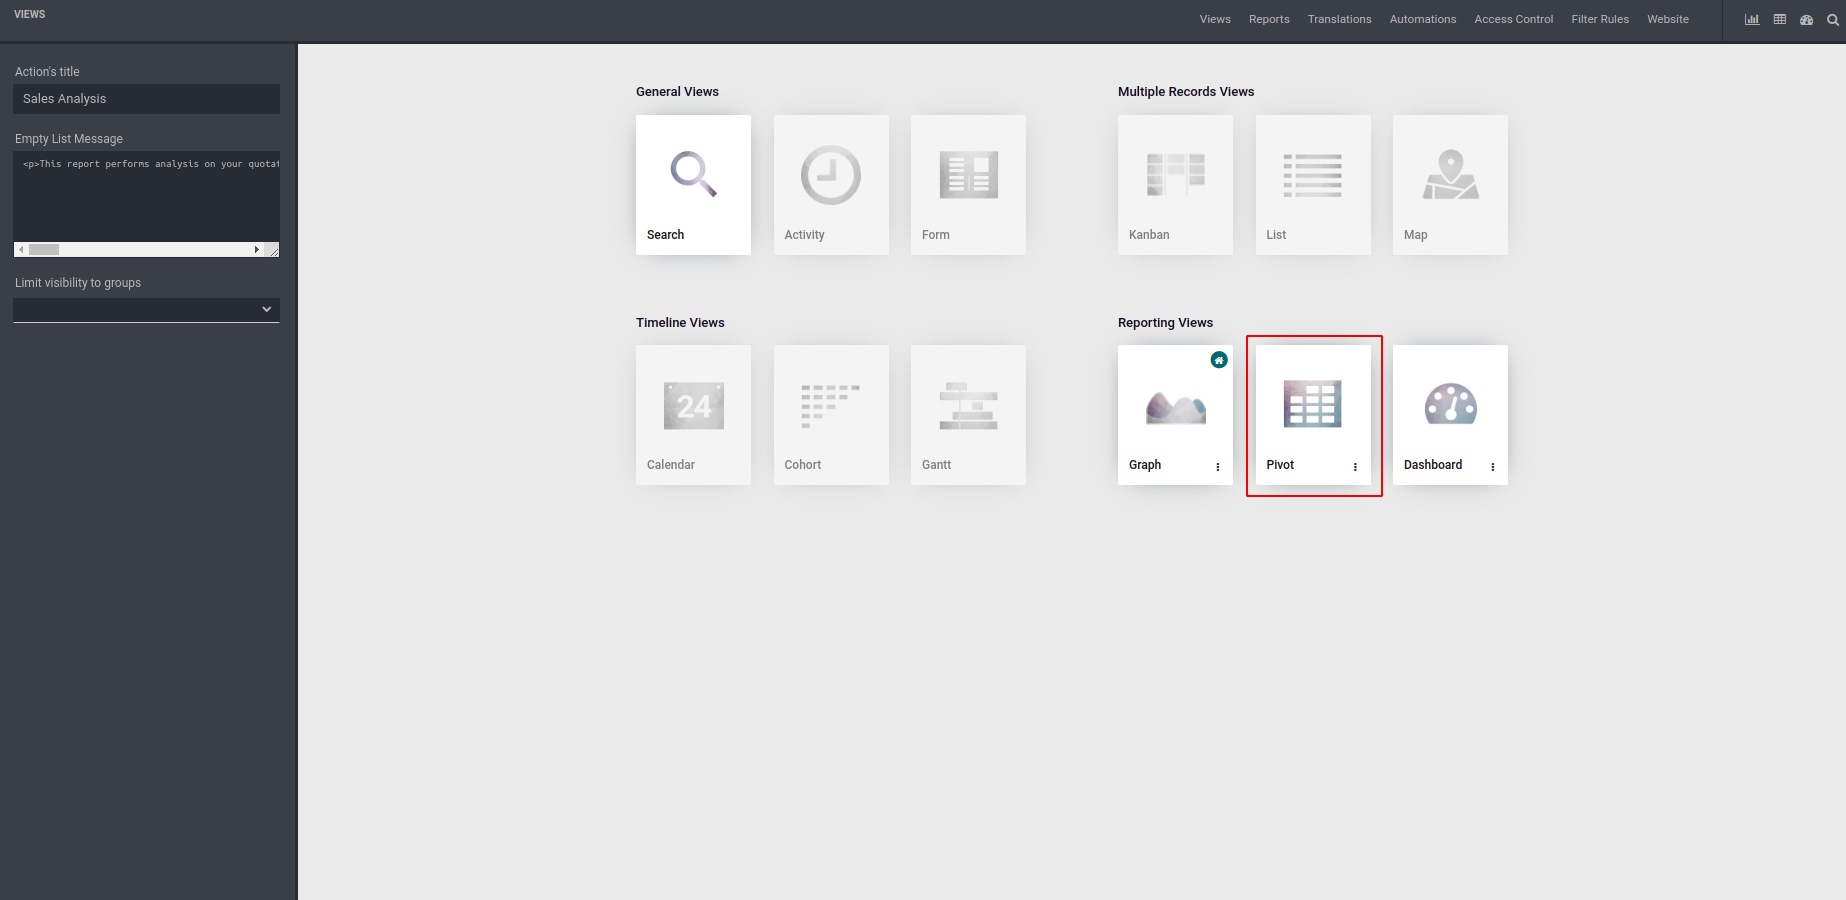
The pivot view is located under the Reporting views in the studio.
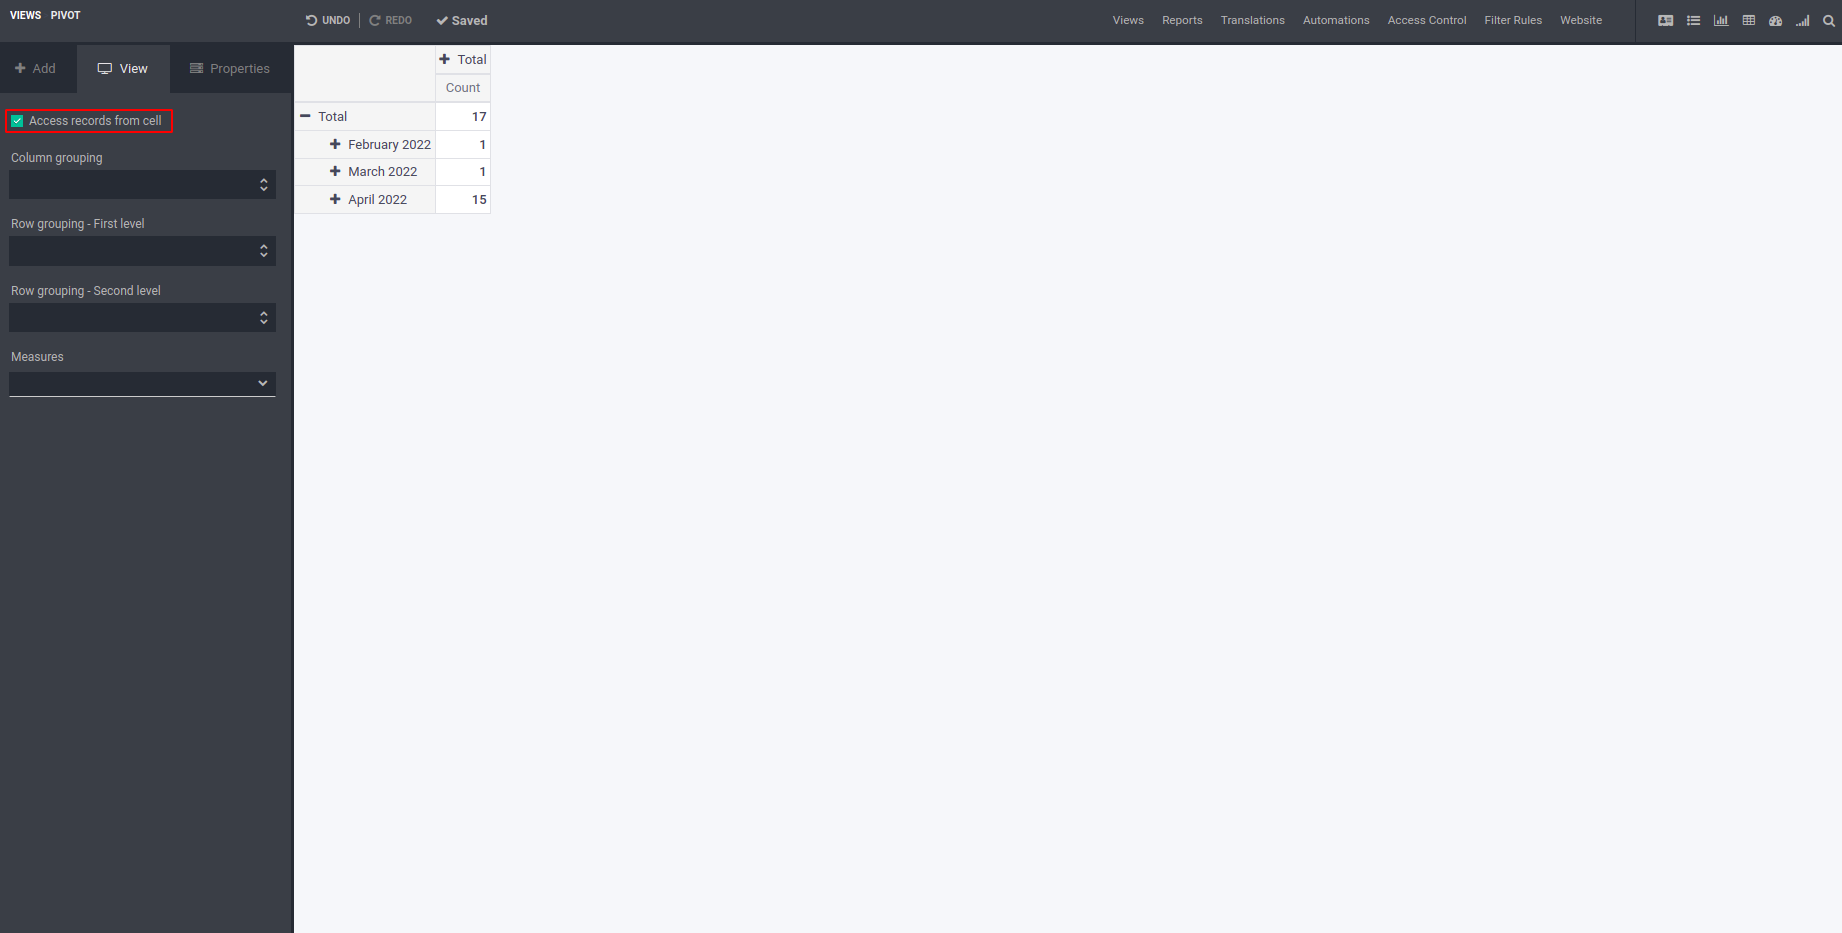
By enabling this user can access the records from the table.
For grouping columns, based on parameters
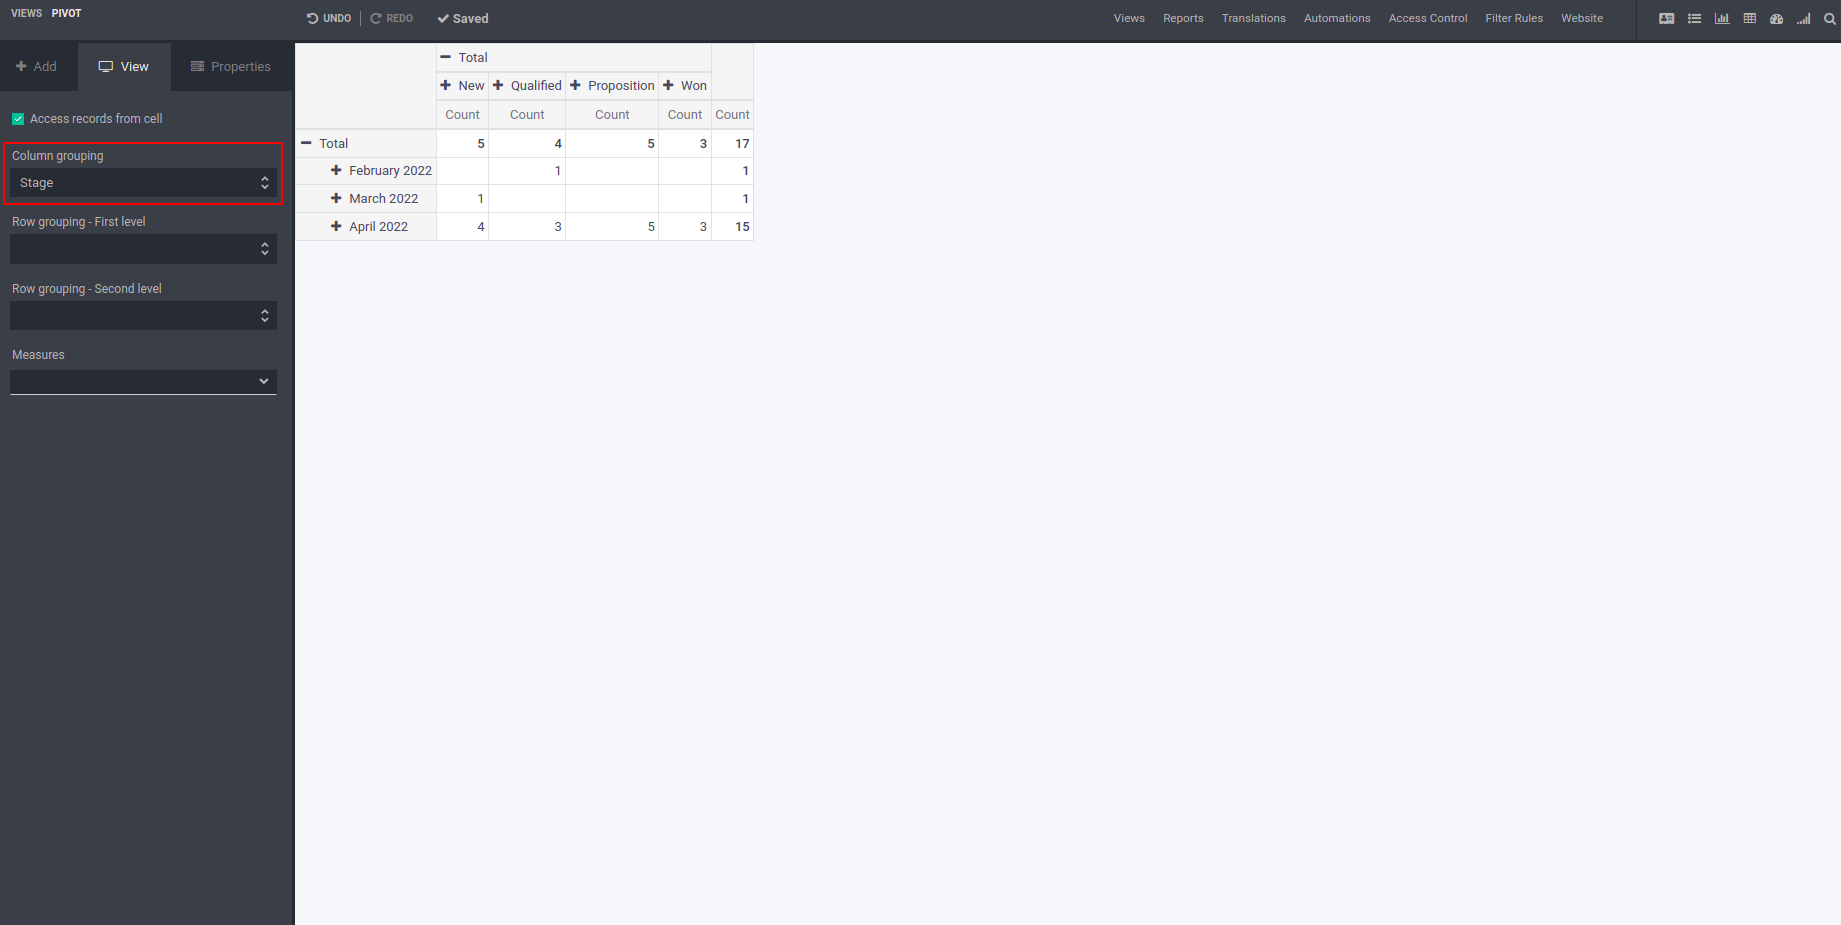
For grouping rows, based on parameters
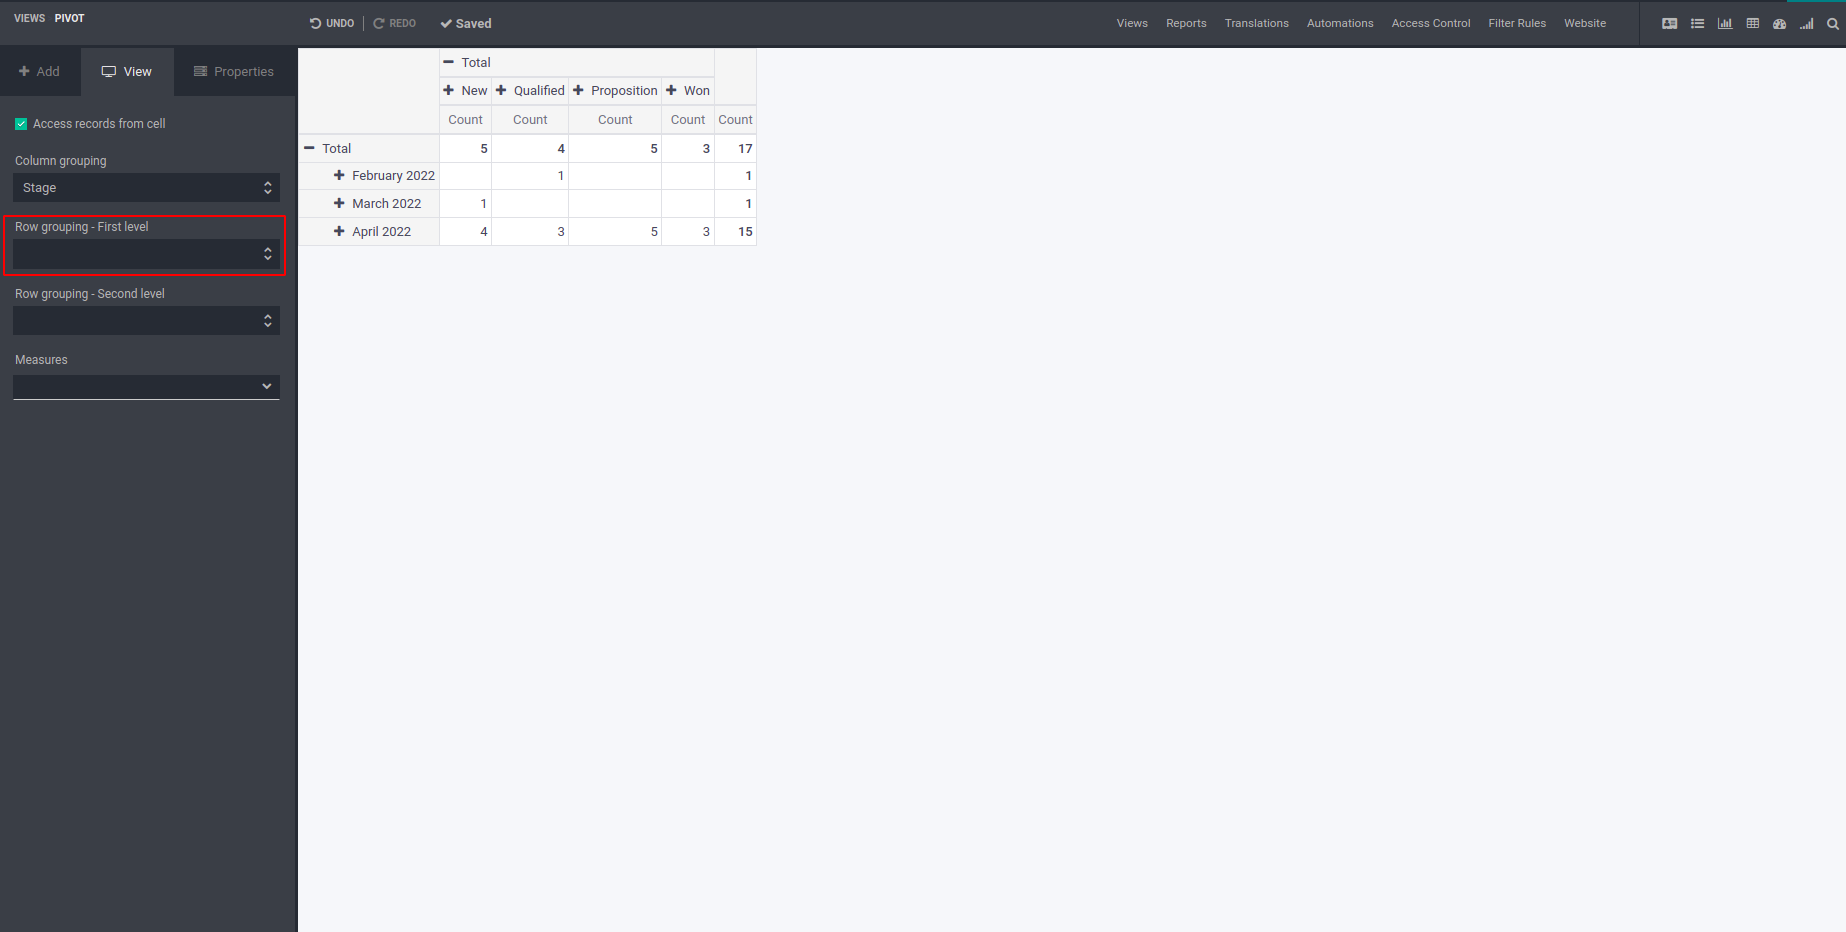
For grouping rows inside first level of grouping, based on parameters
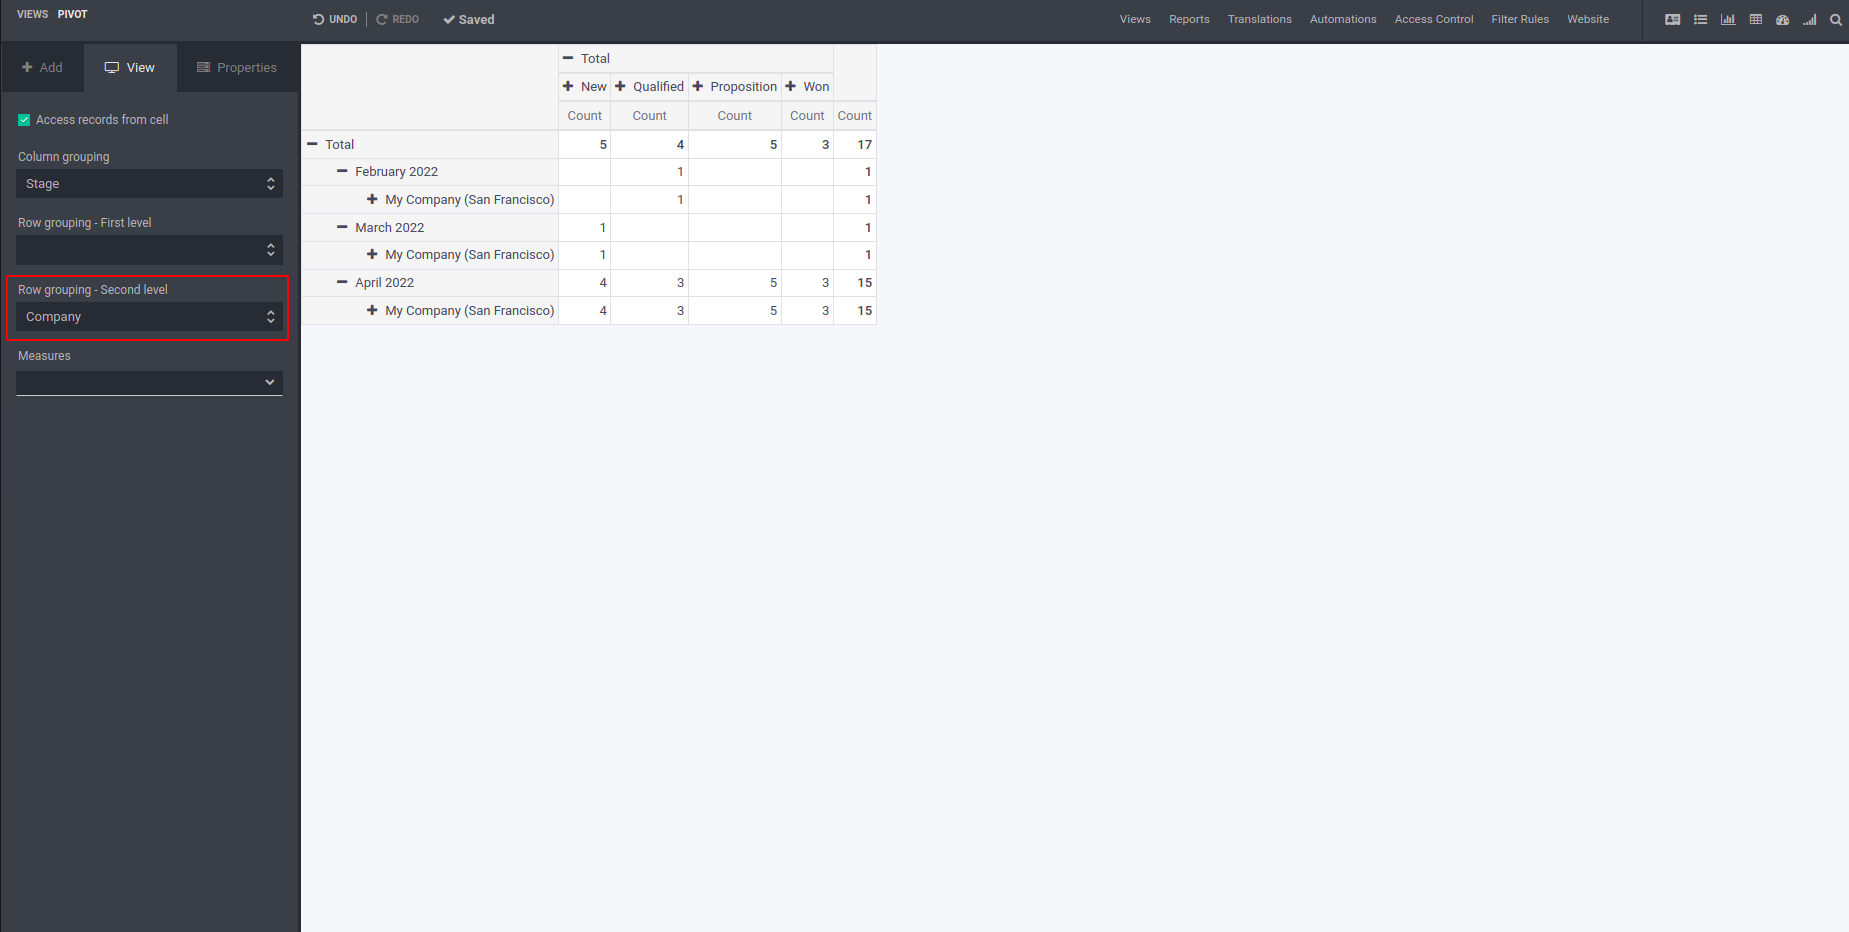
Set measures for this pivot table. The pivot table is displayed based on these measures.
By enabling ‘Display count’, shows the count of records.
