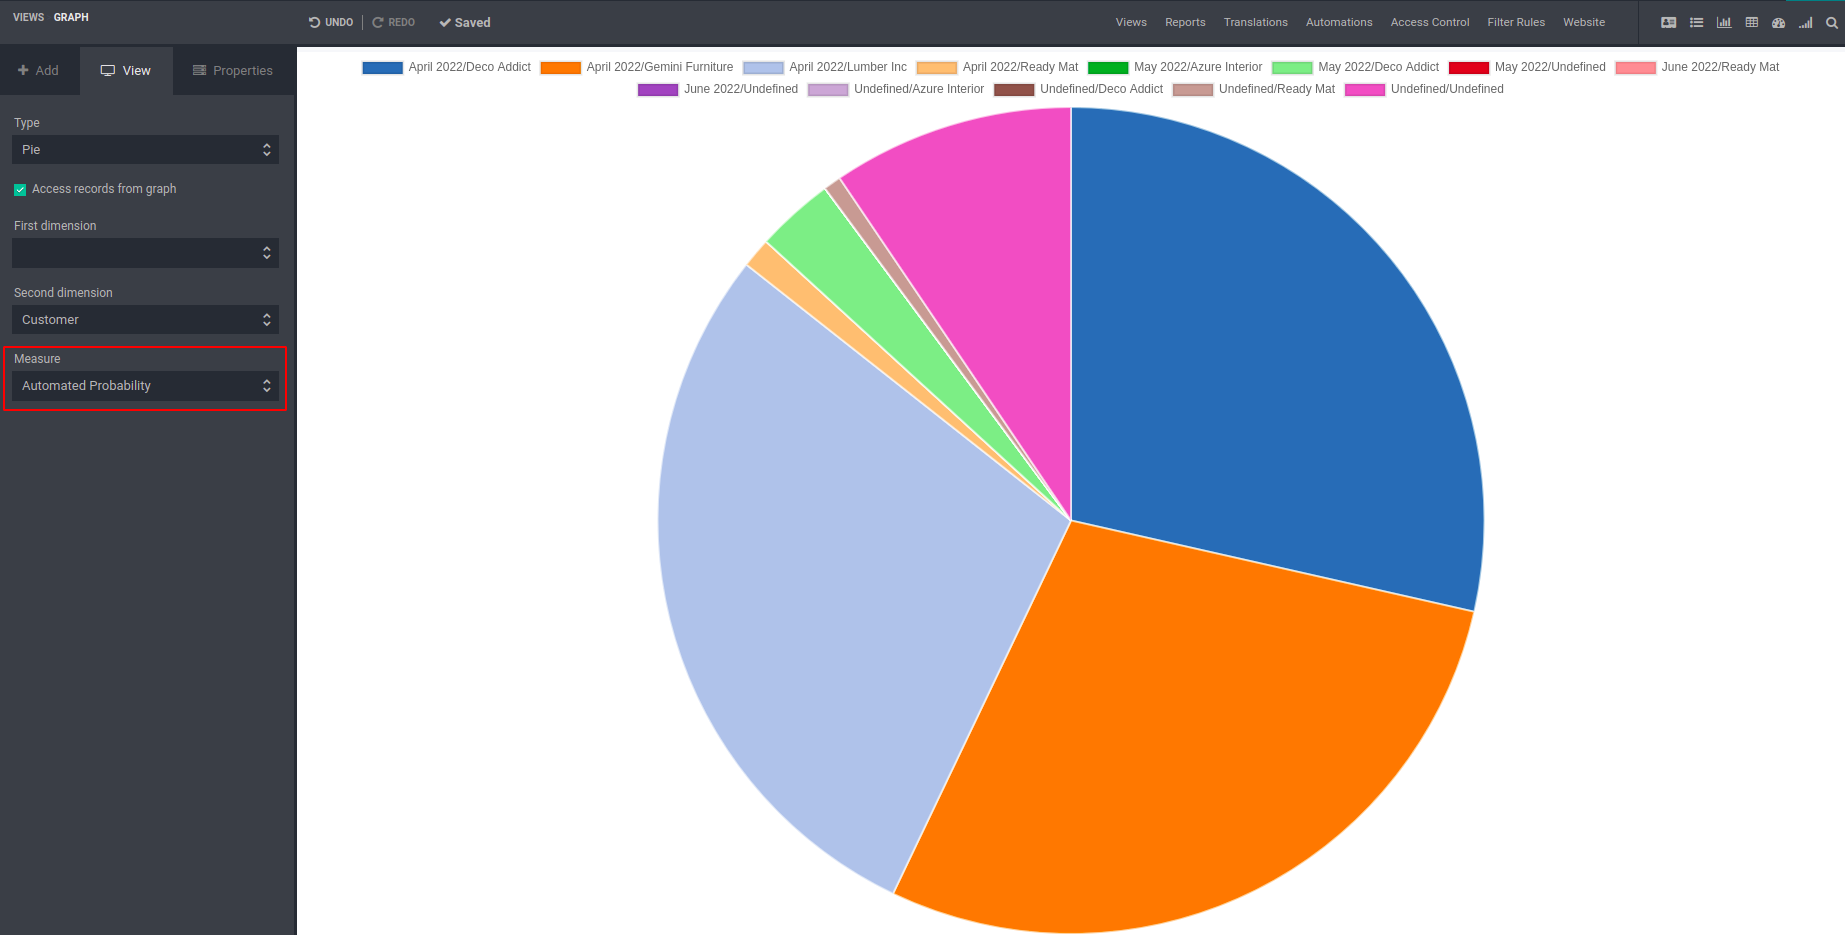
A pie chart is a circular statistical graphic, which is divided into slices to
illustrate
numerical proportion. In a pie chart, the arc length of each slice is proportional
to the quantity it represents.
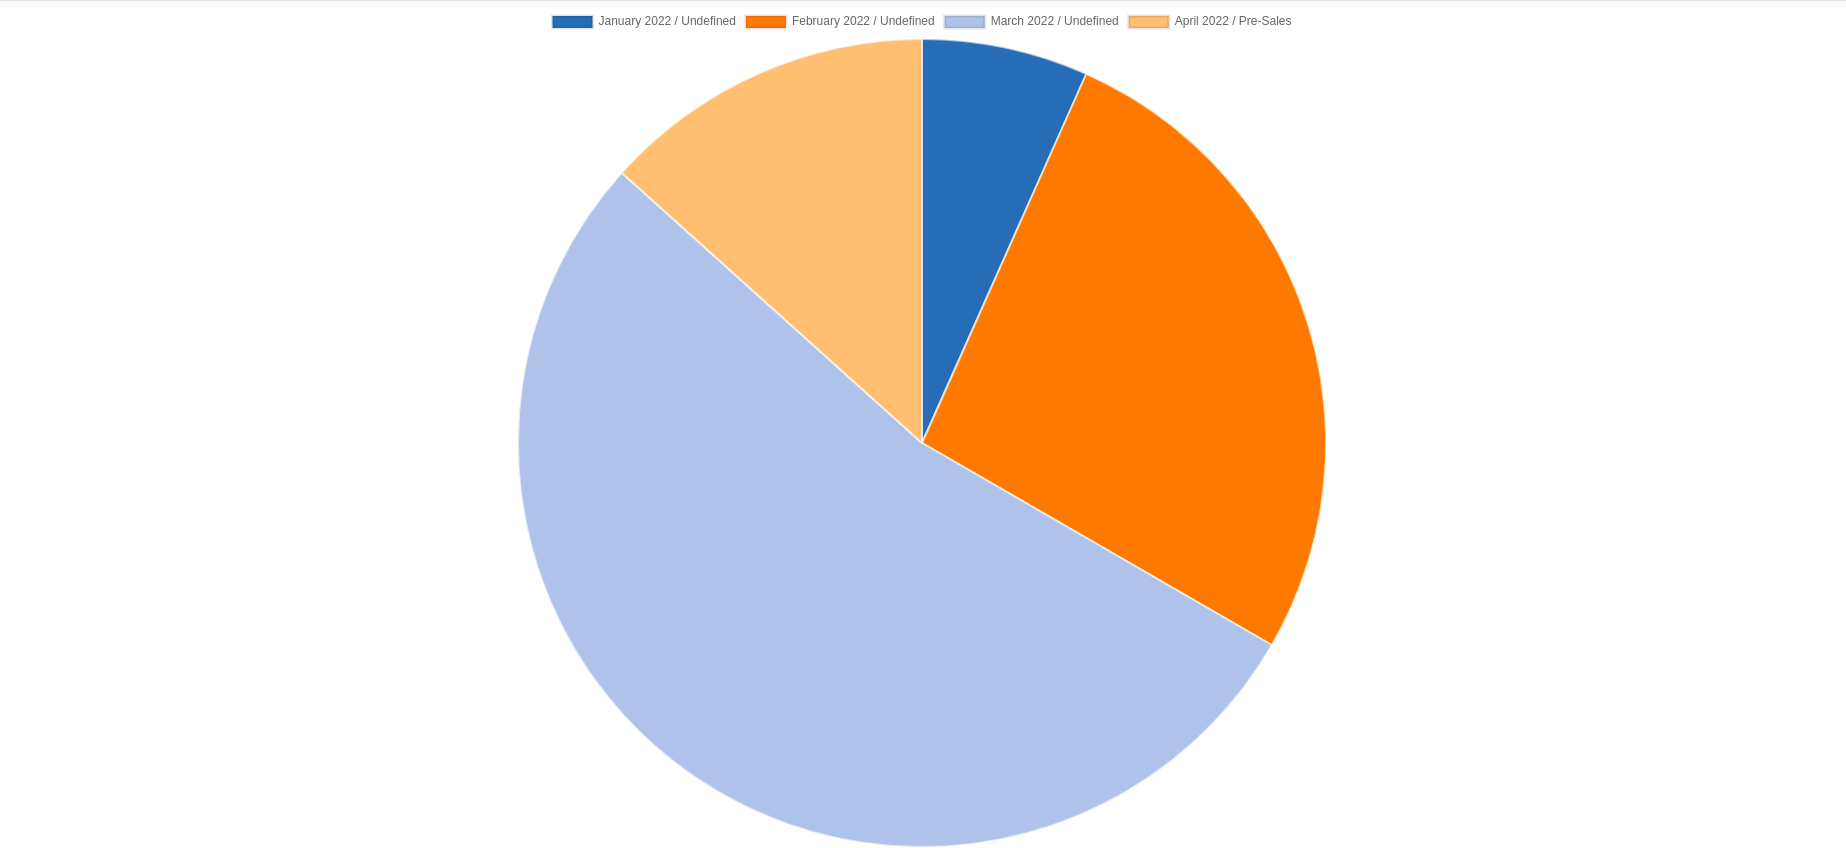
Let us create a pie chart using Studio:
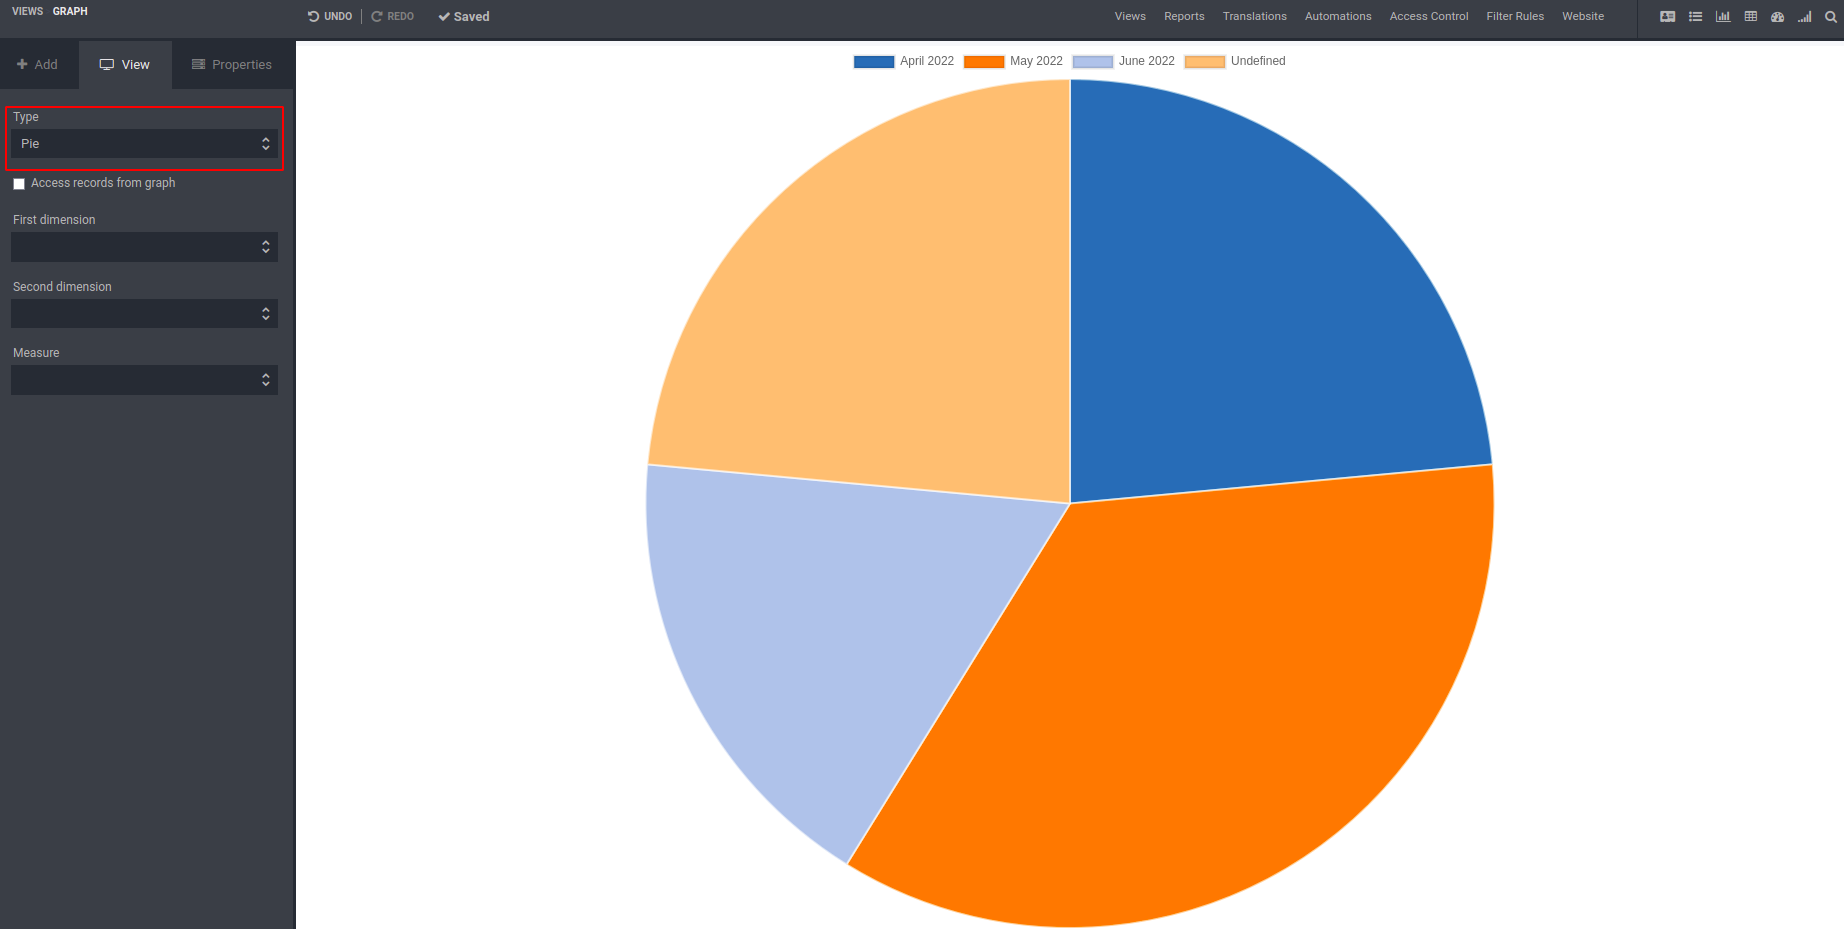
Select type as ‘Pie’.
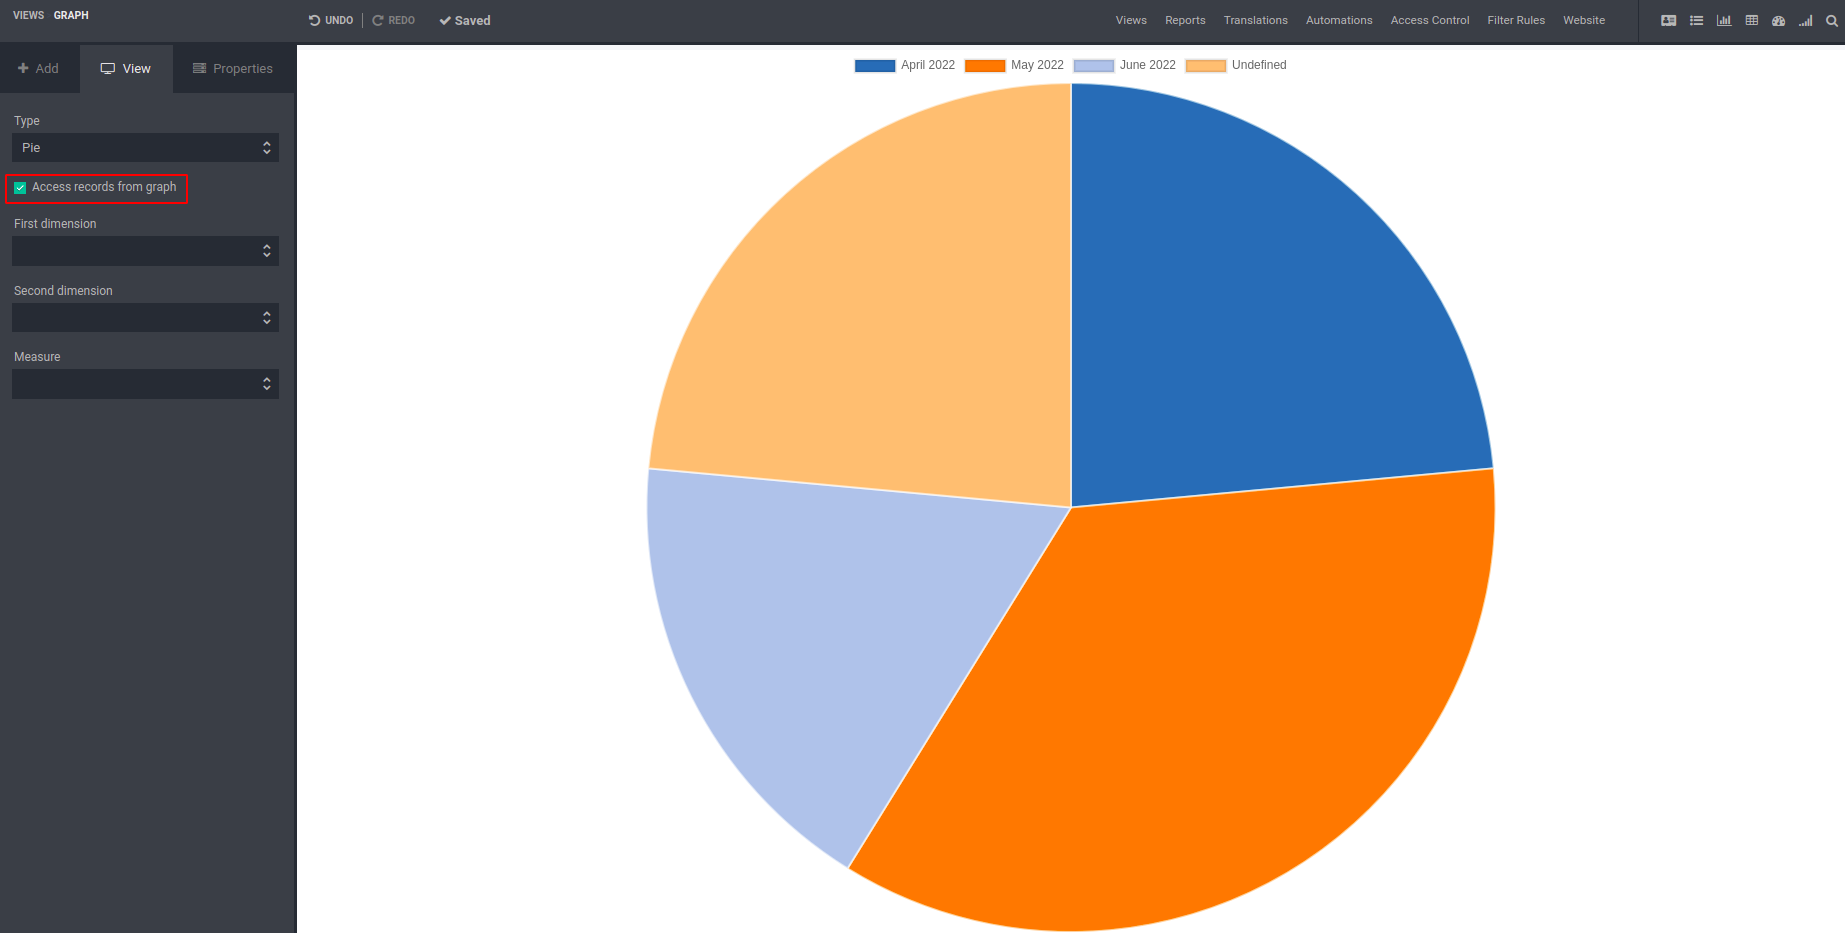
By enabling this you can access the records from the pie chart.
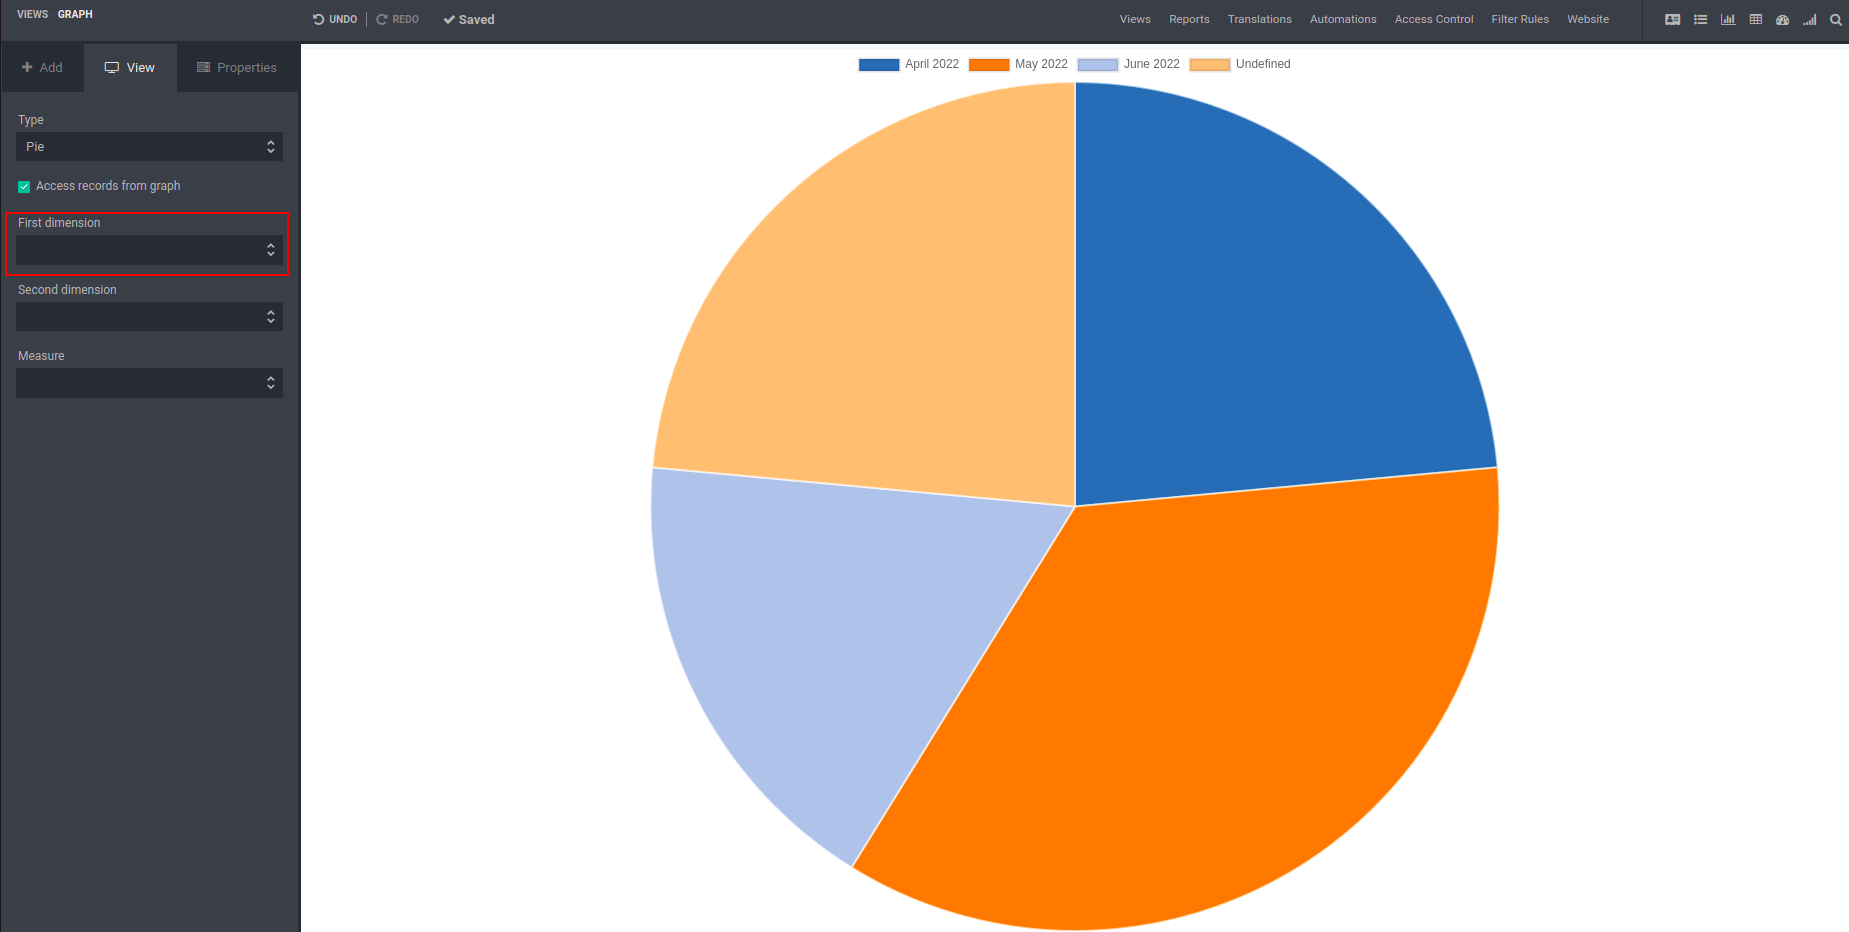
Set first dimension parameters. It varies for the models.
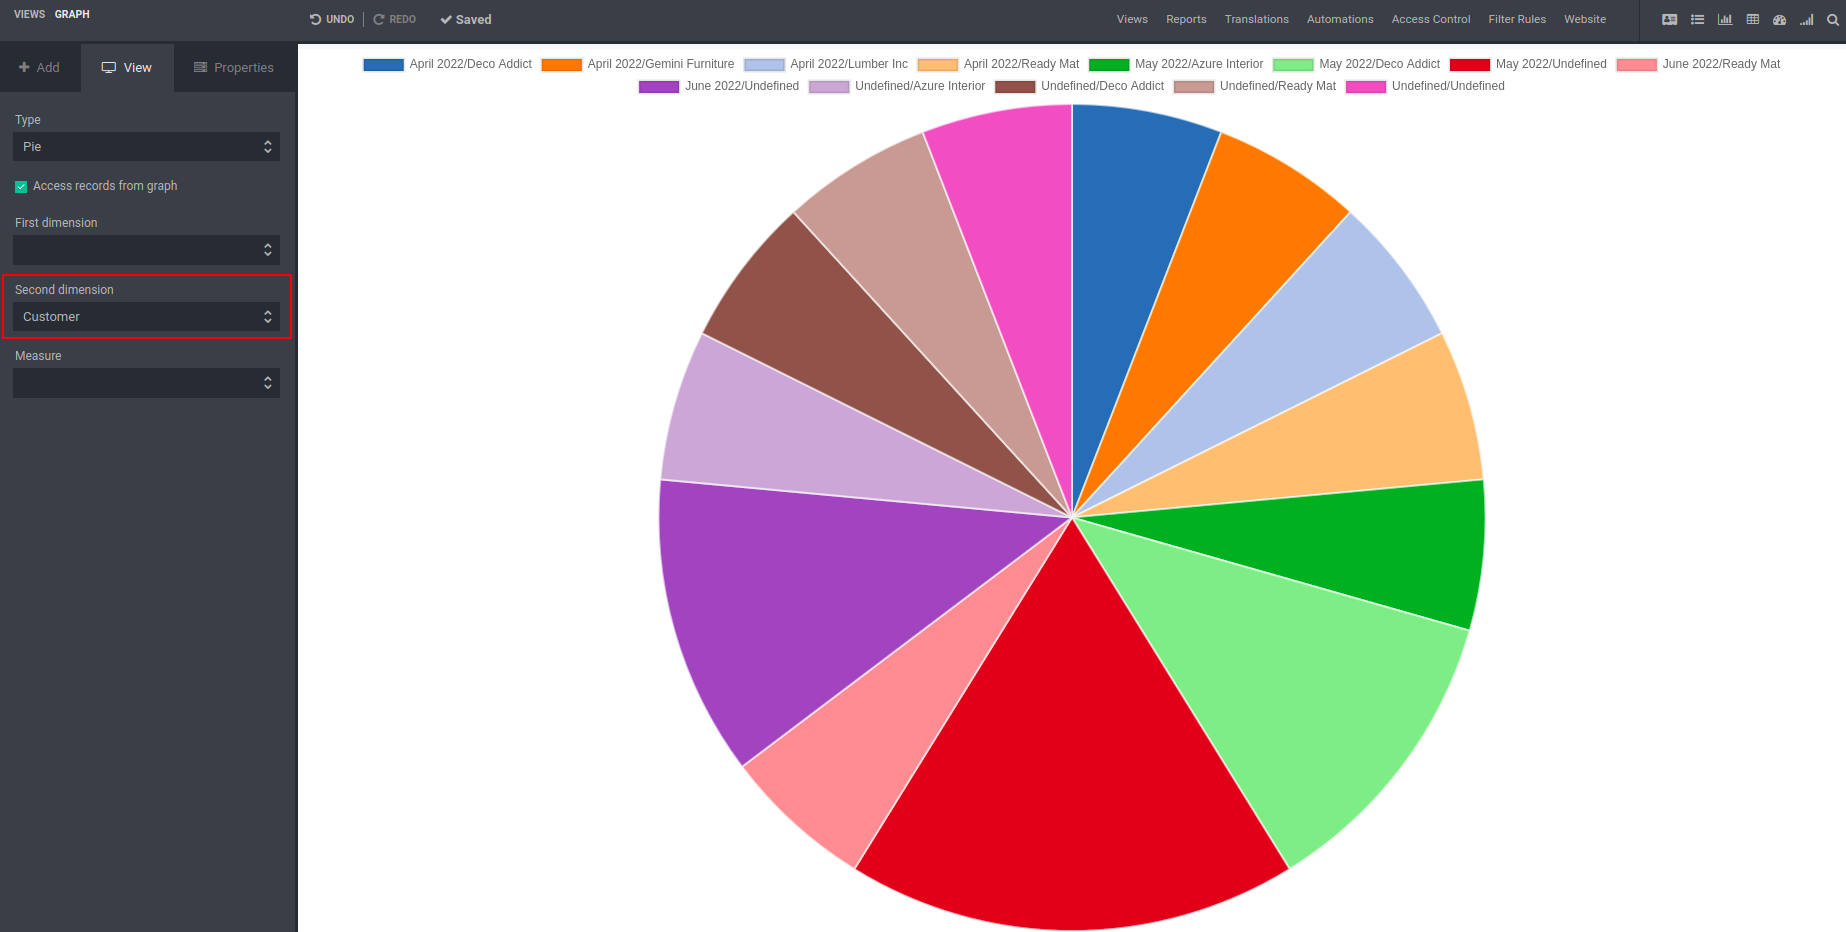
Set second dimension parameters. It varies for the models.
Set measures for this pie chart. The pie chart is displayed based on these measures.
