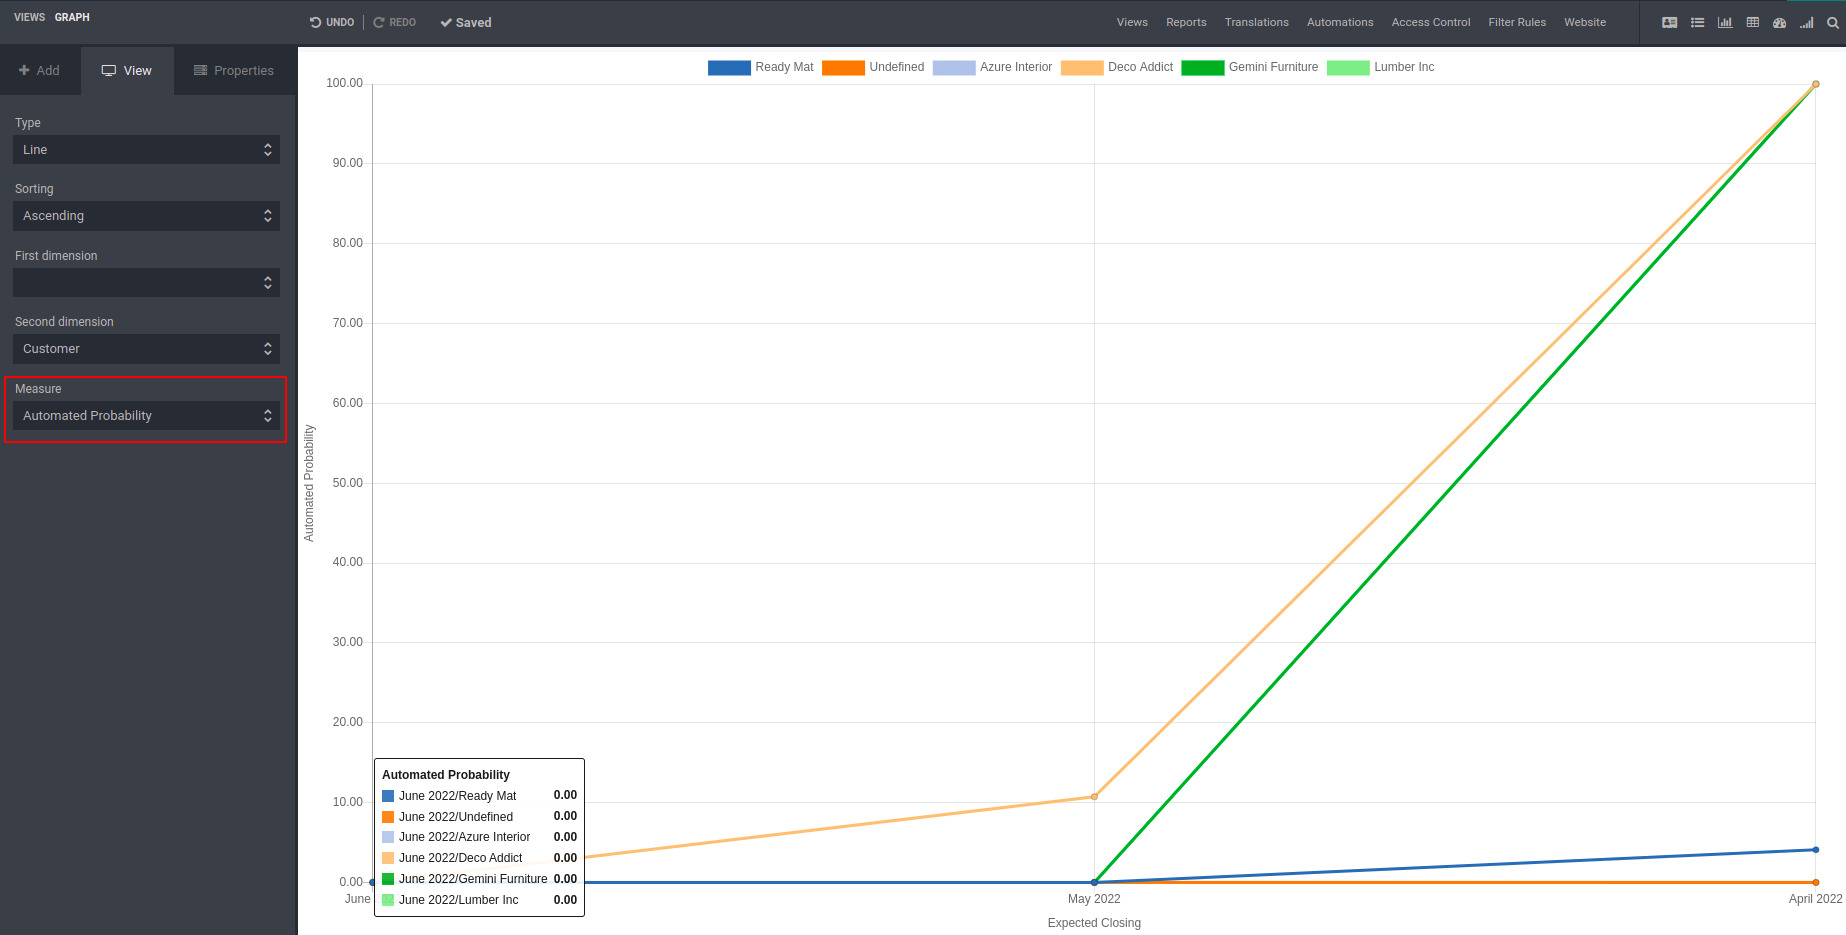
A line chart or line graph or curve chart are a type of chart that displays information
as a set of data points called "markers" that are connected by straight line segments.
This is a basic chart type that is common in many fields.
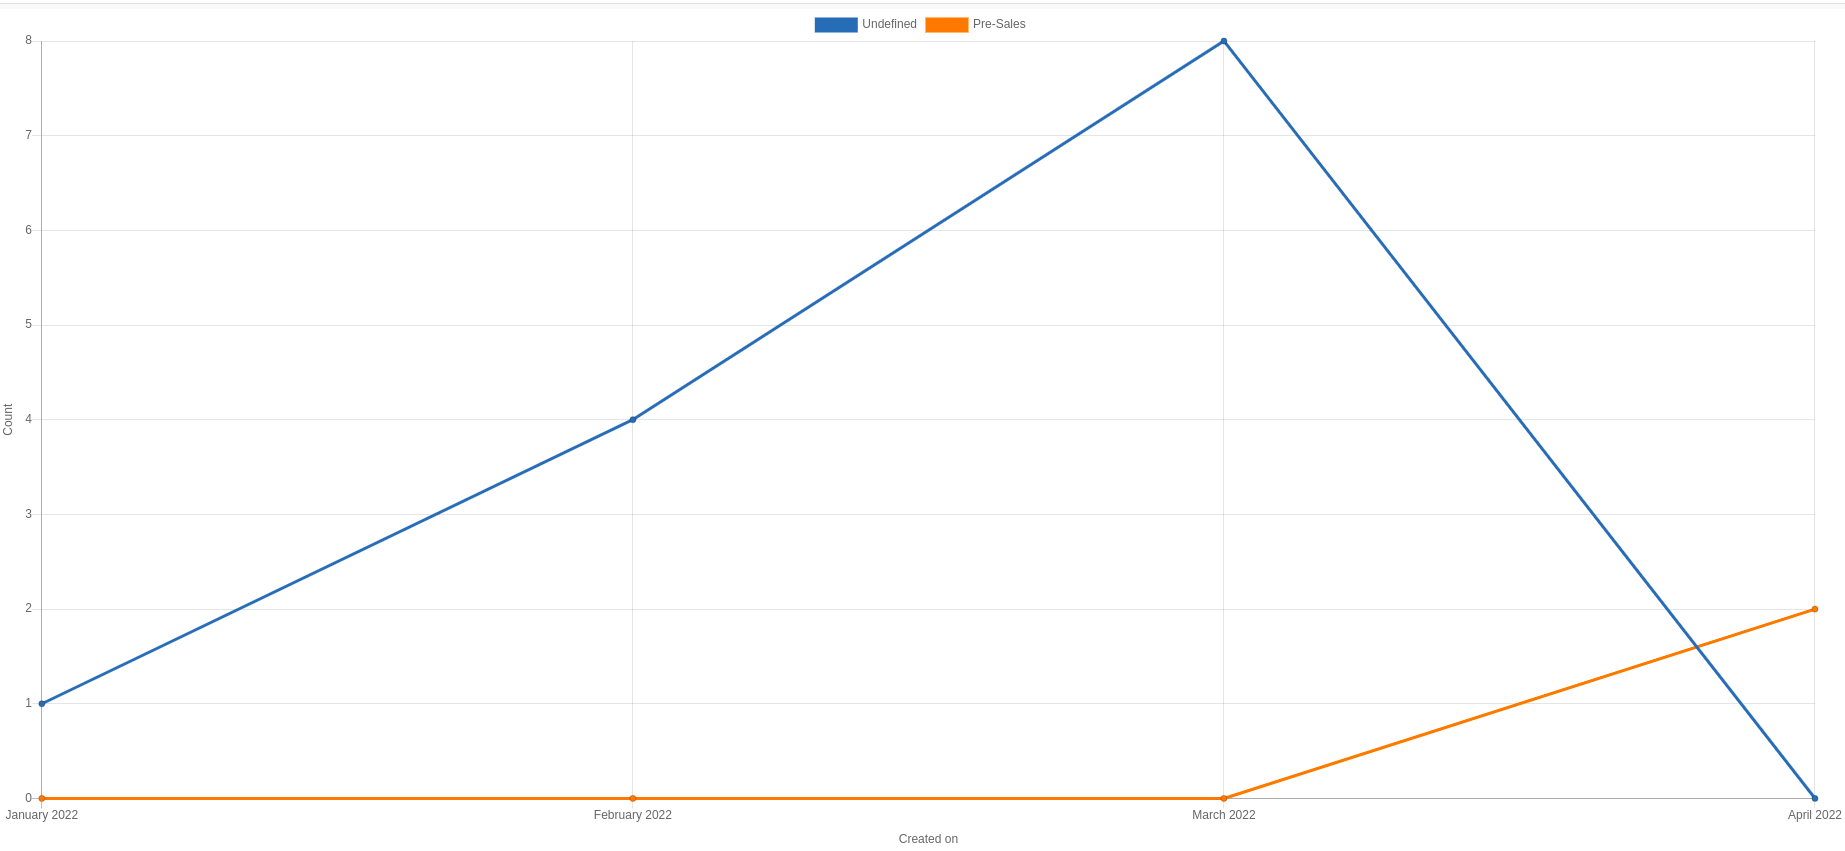
Let us create a line chart using Studio:
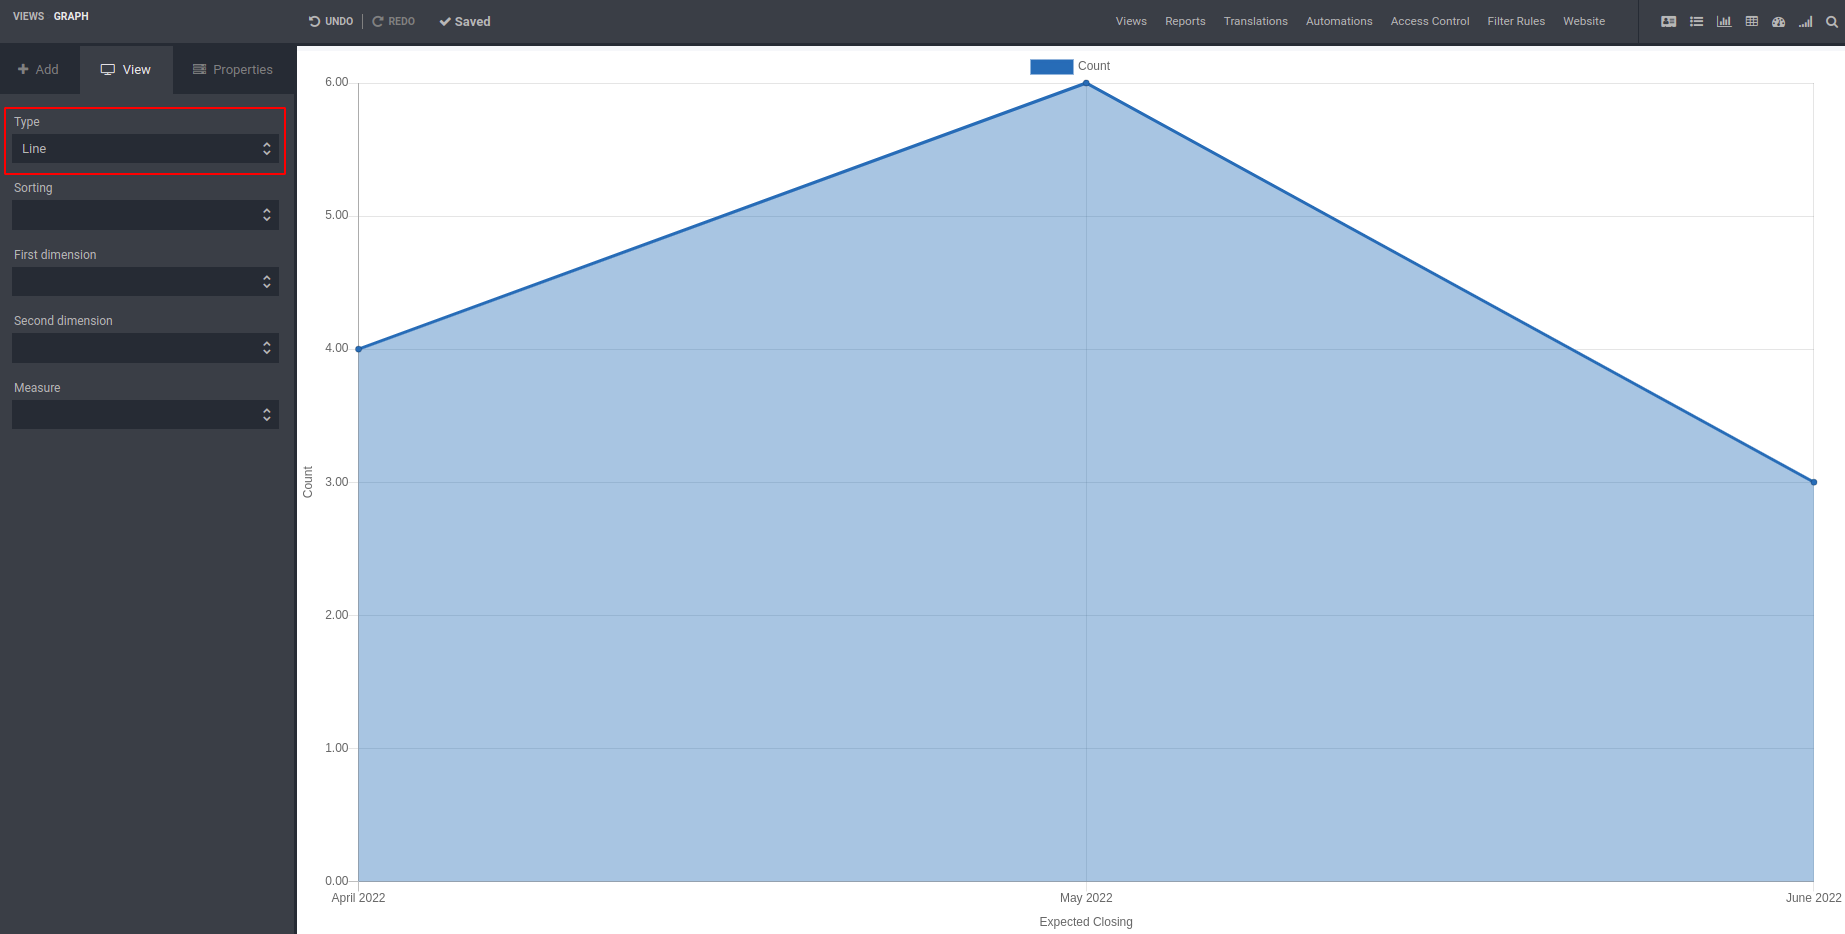
Select type as ‘Line’.
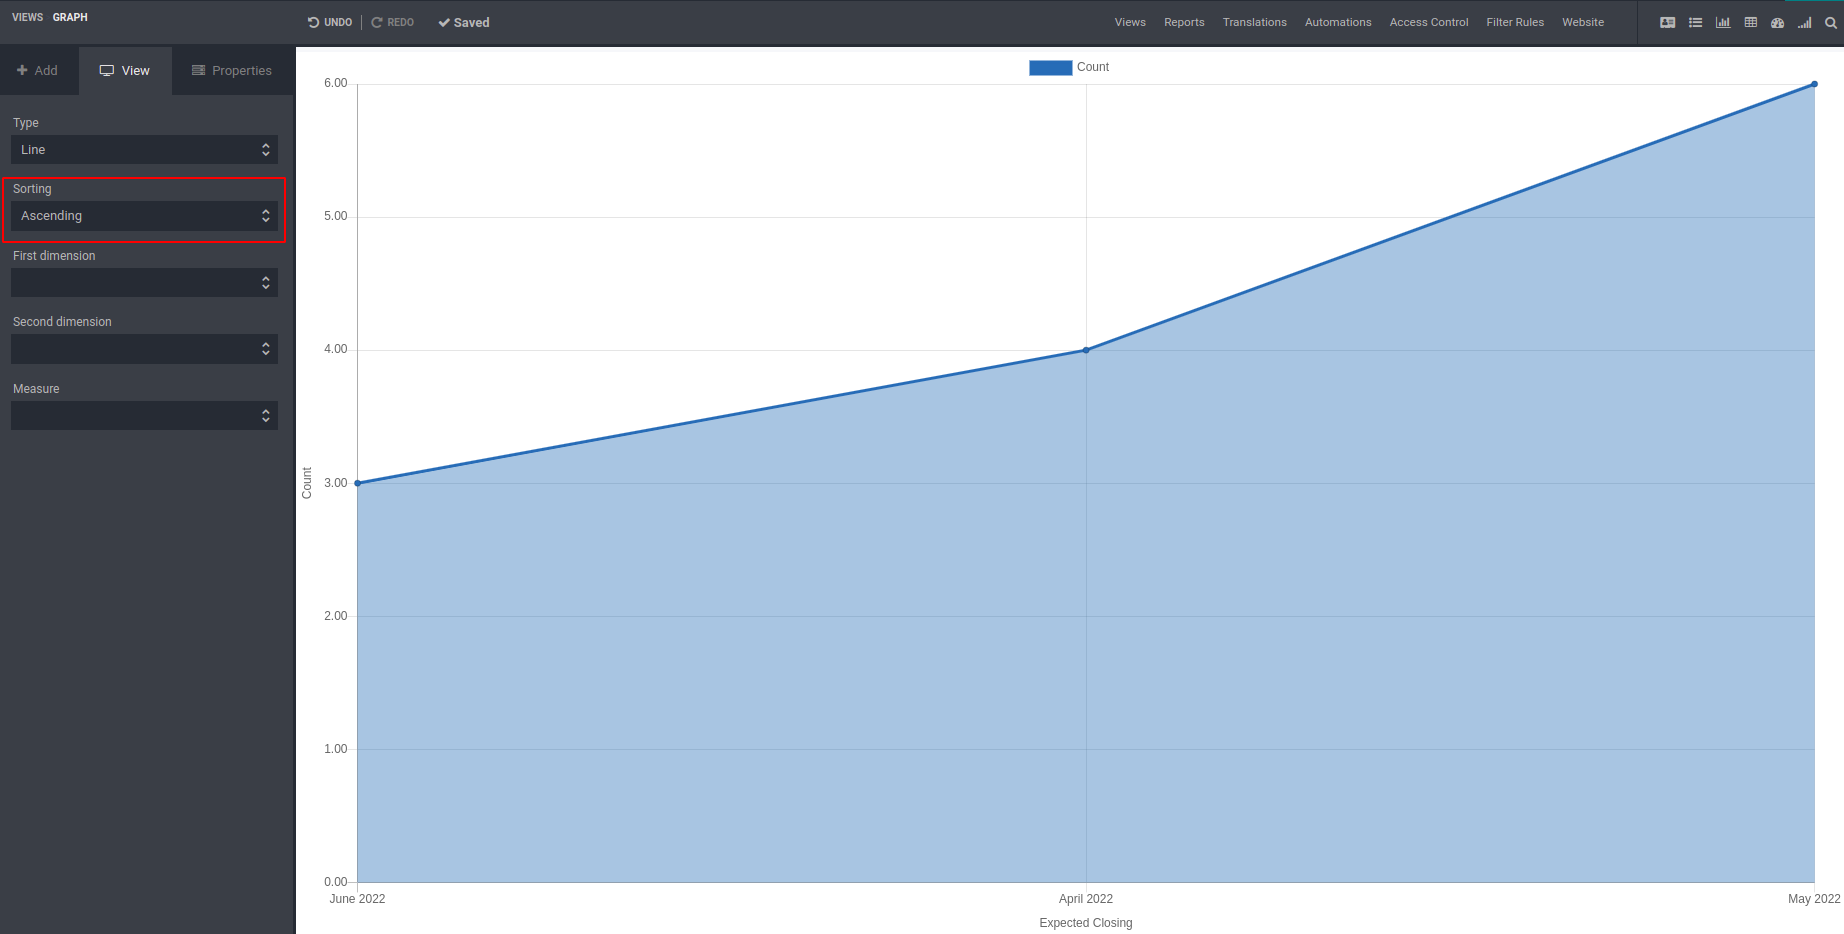
Can sort the line chart in ascending or descending order as you wish.
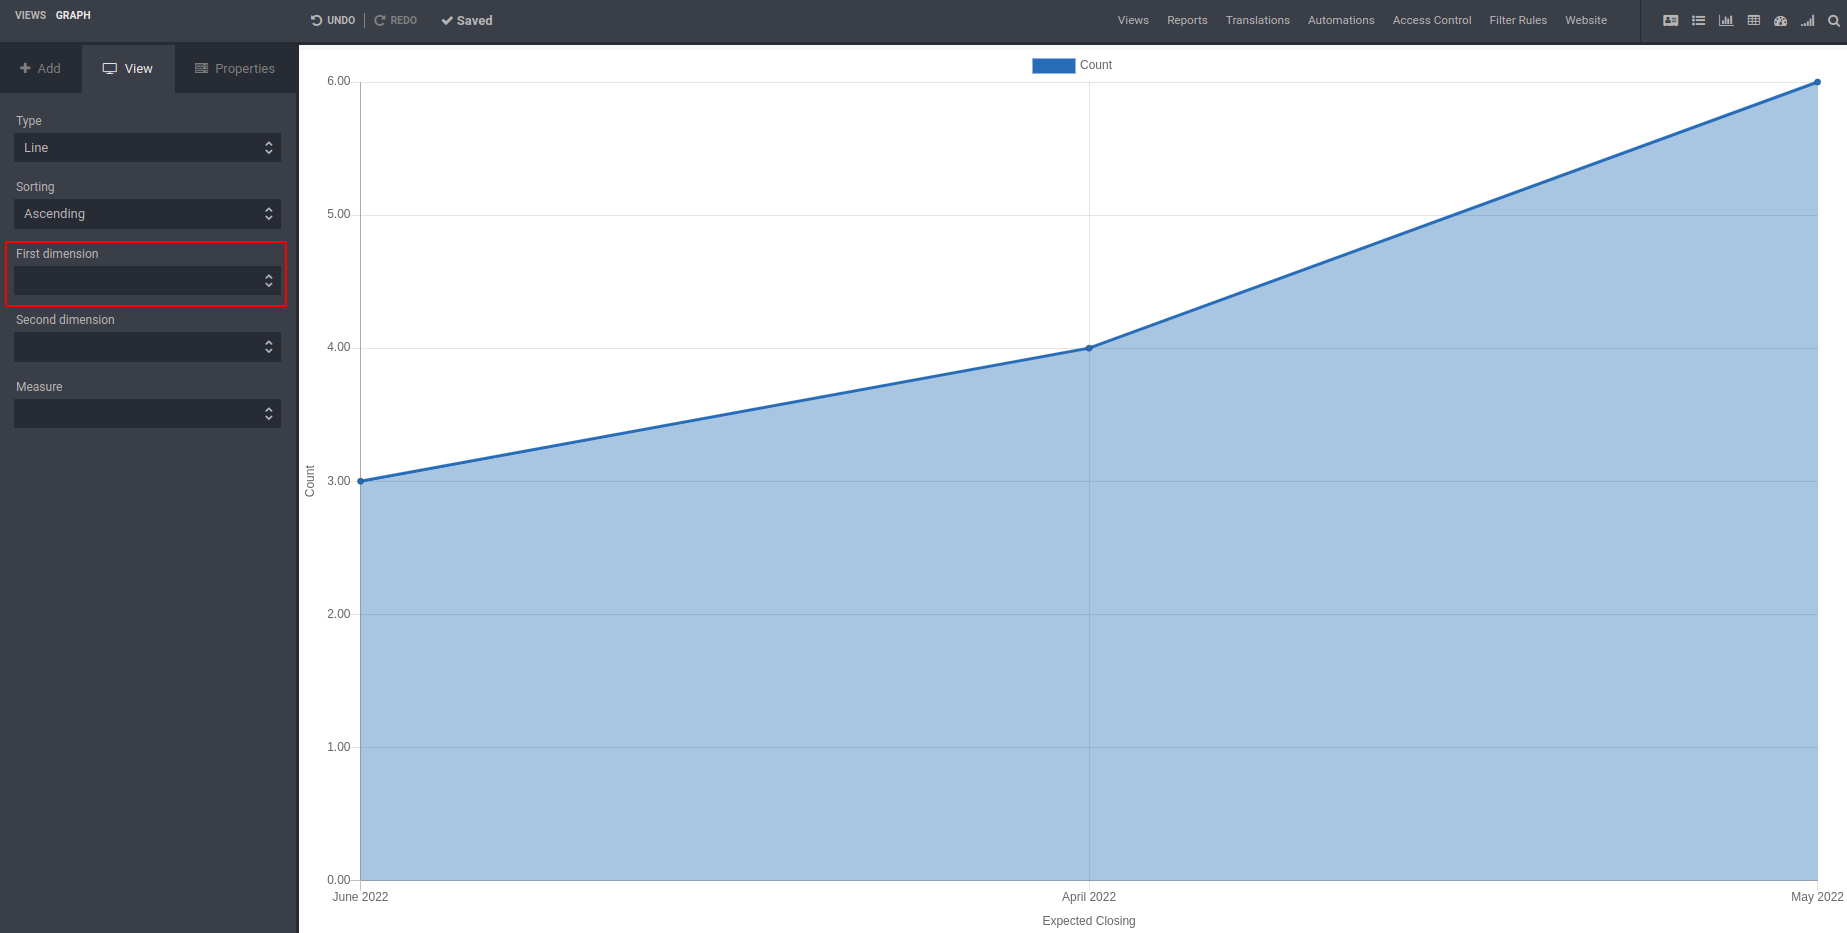
Set first dimension parameters. It varies for the models.
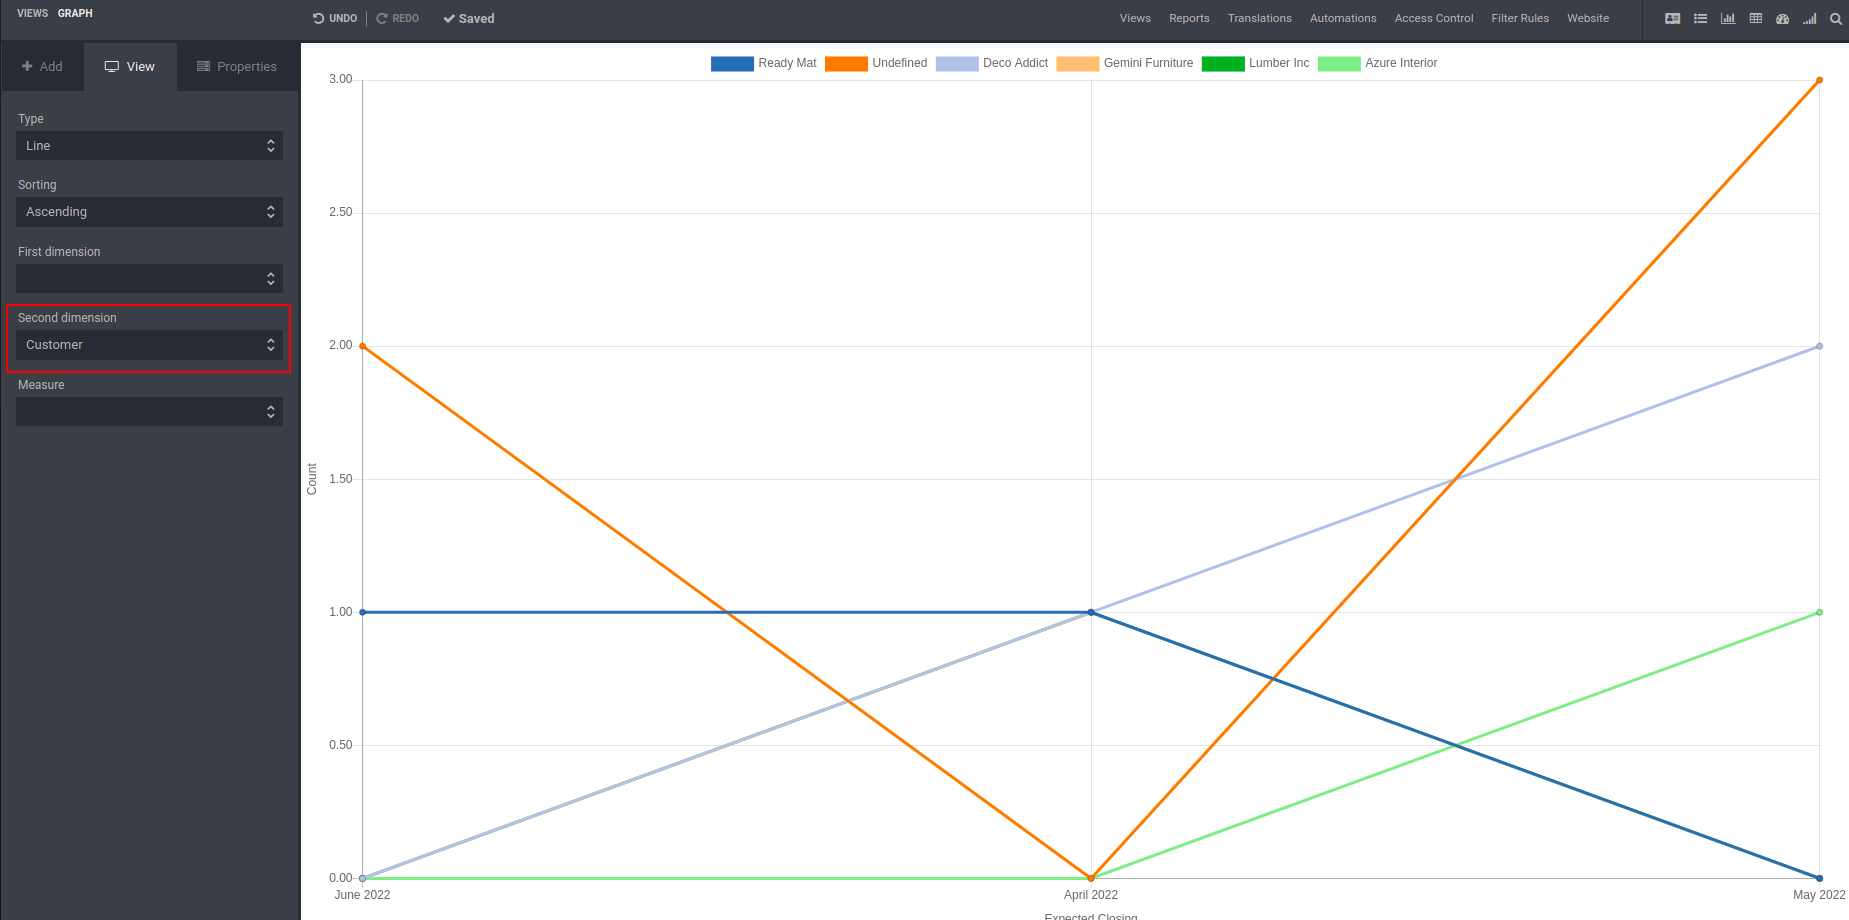
Set second dimension parameters. It varies for the models.
Set measures for this line chart. The line chart is displayed based on these measures.
