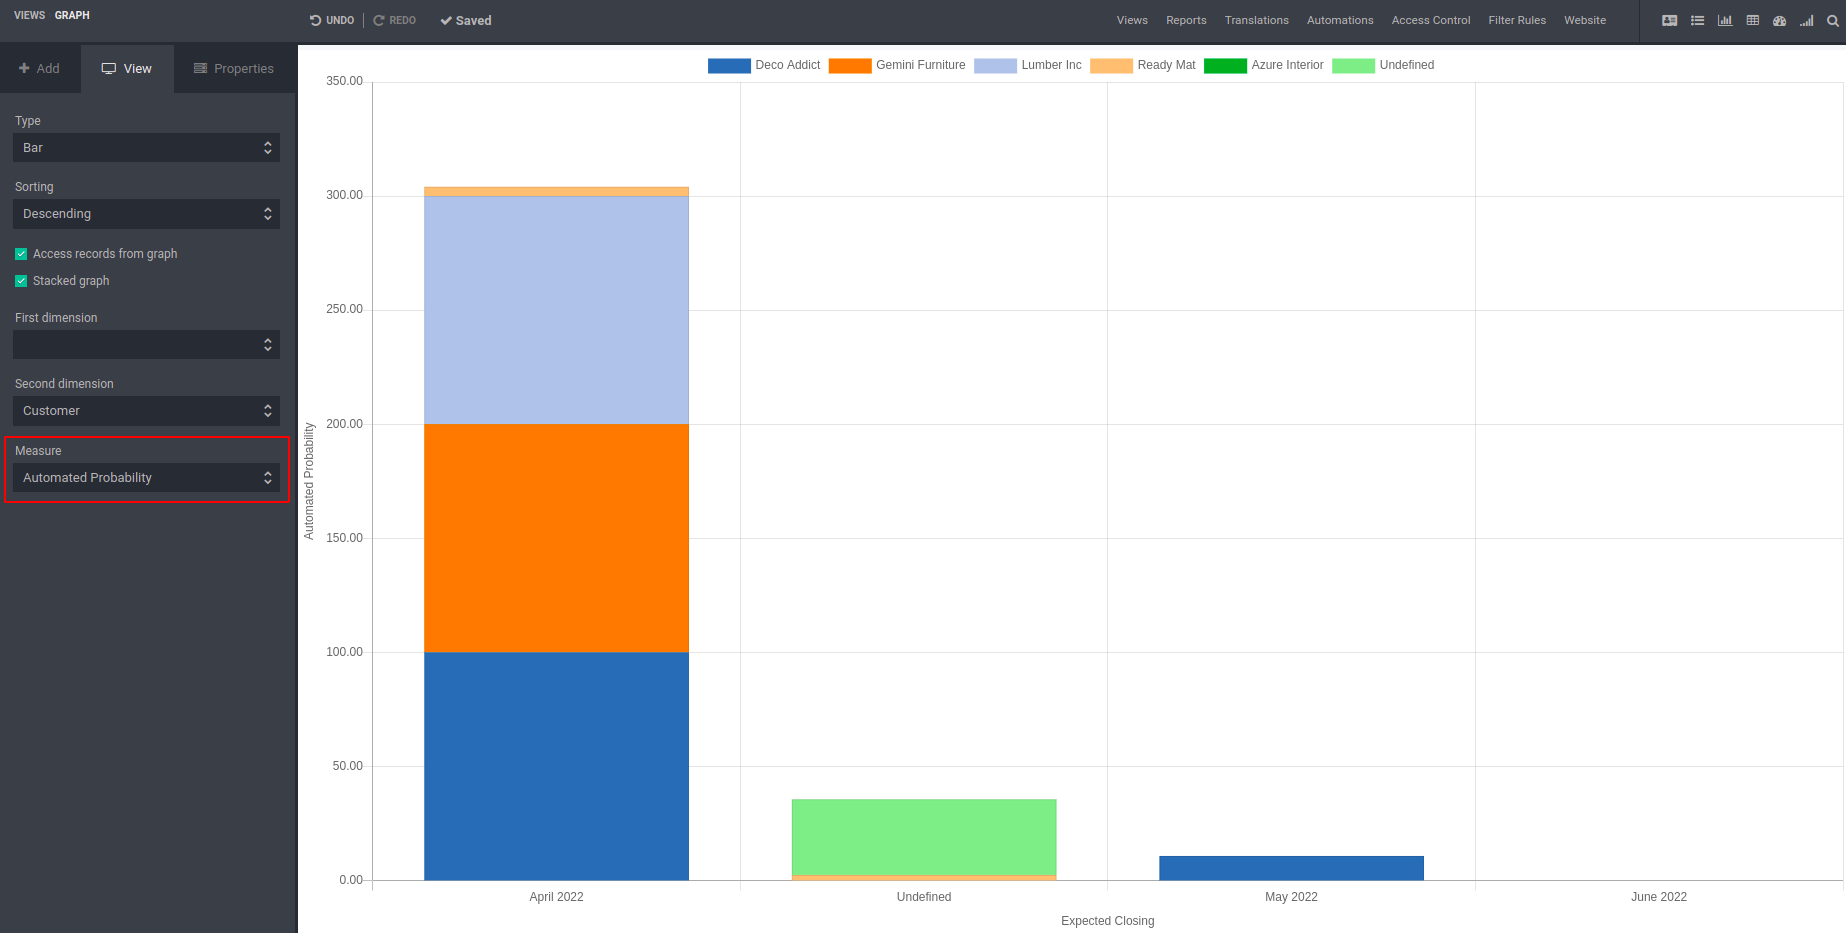
A bar graph or bar chart is a chart or graph that represents categorical data with
rectangular bars whose height or length is proportional to the value they represent.
Bars can be aligned vertically or horizontally. Vertically aligned bar charts are
sometimes referred to as column charts.
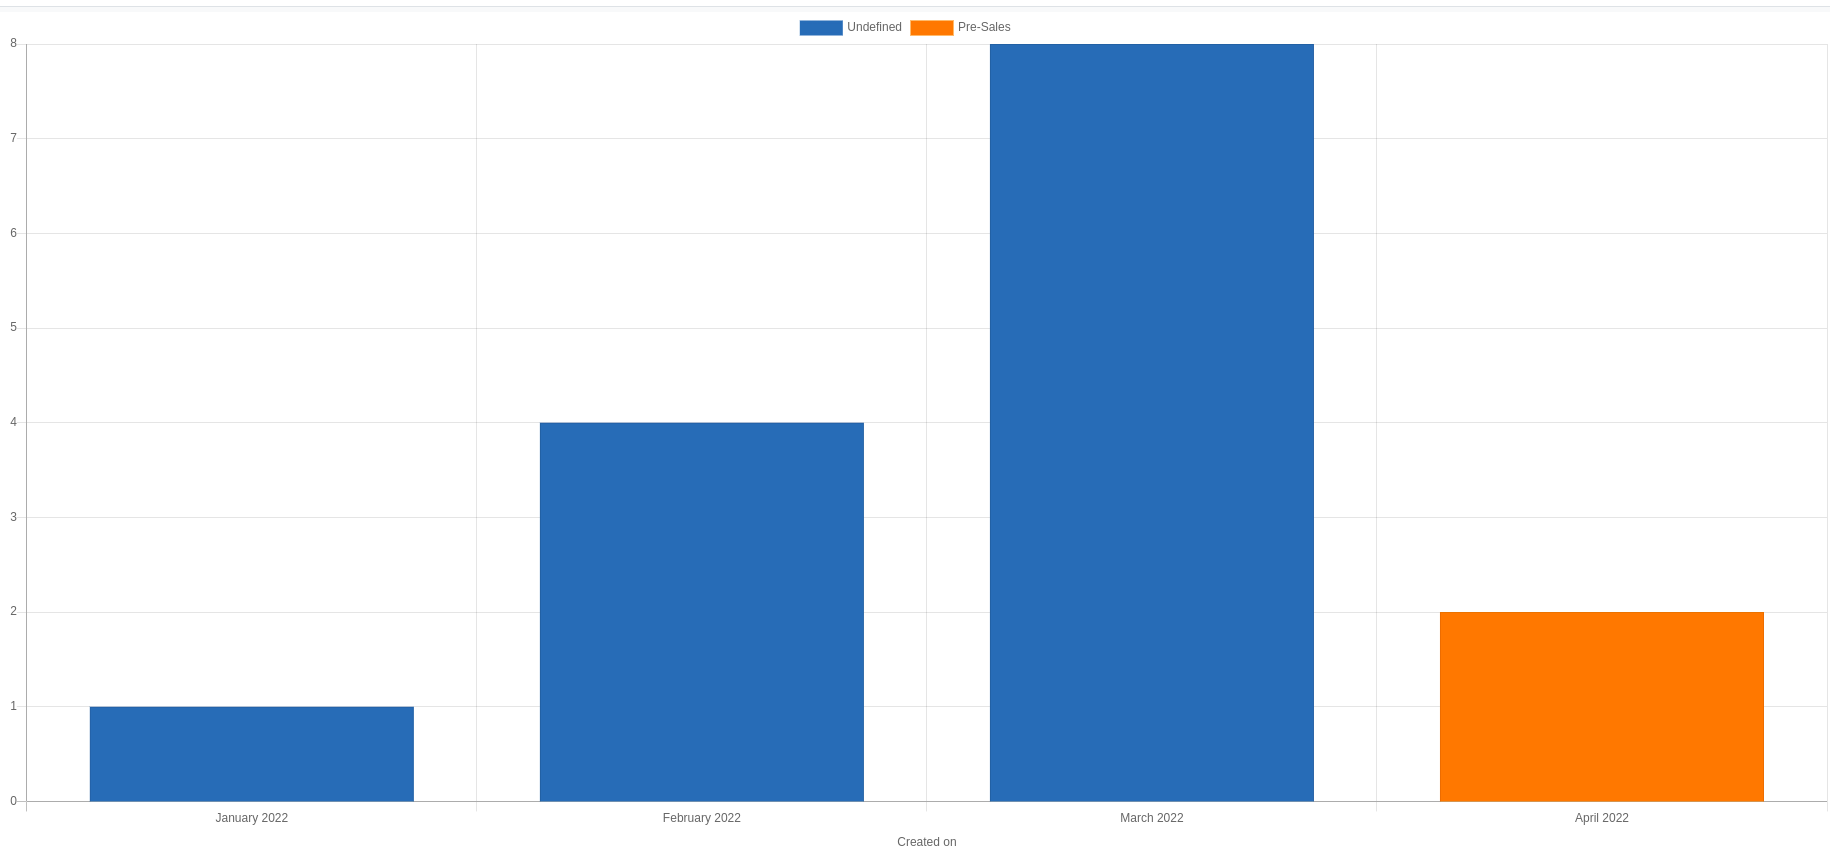
Let us create a bar chart using Studio:
Select type as ‘Bar’.
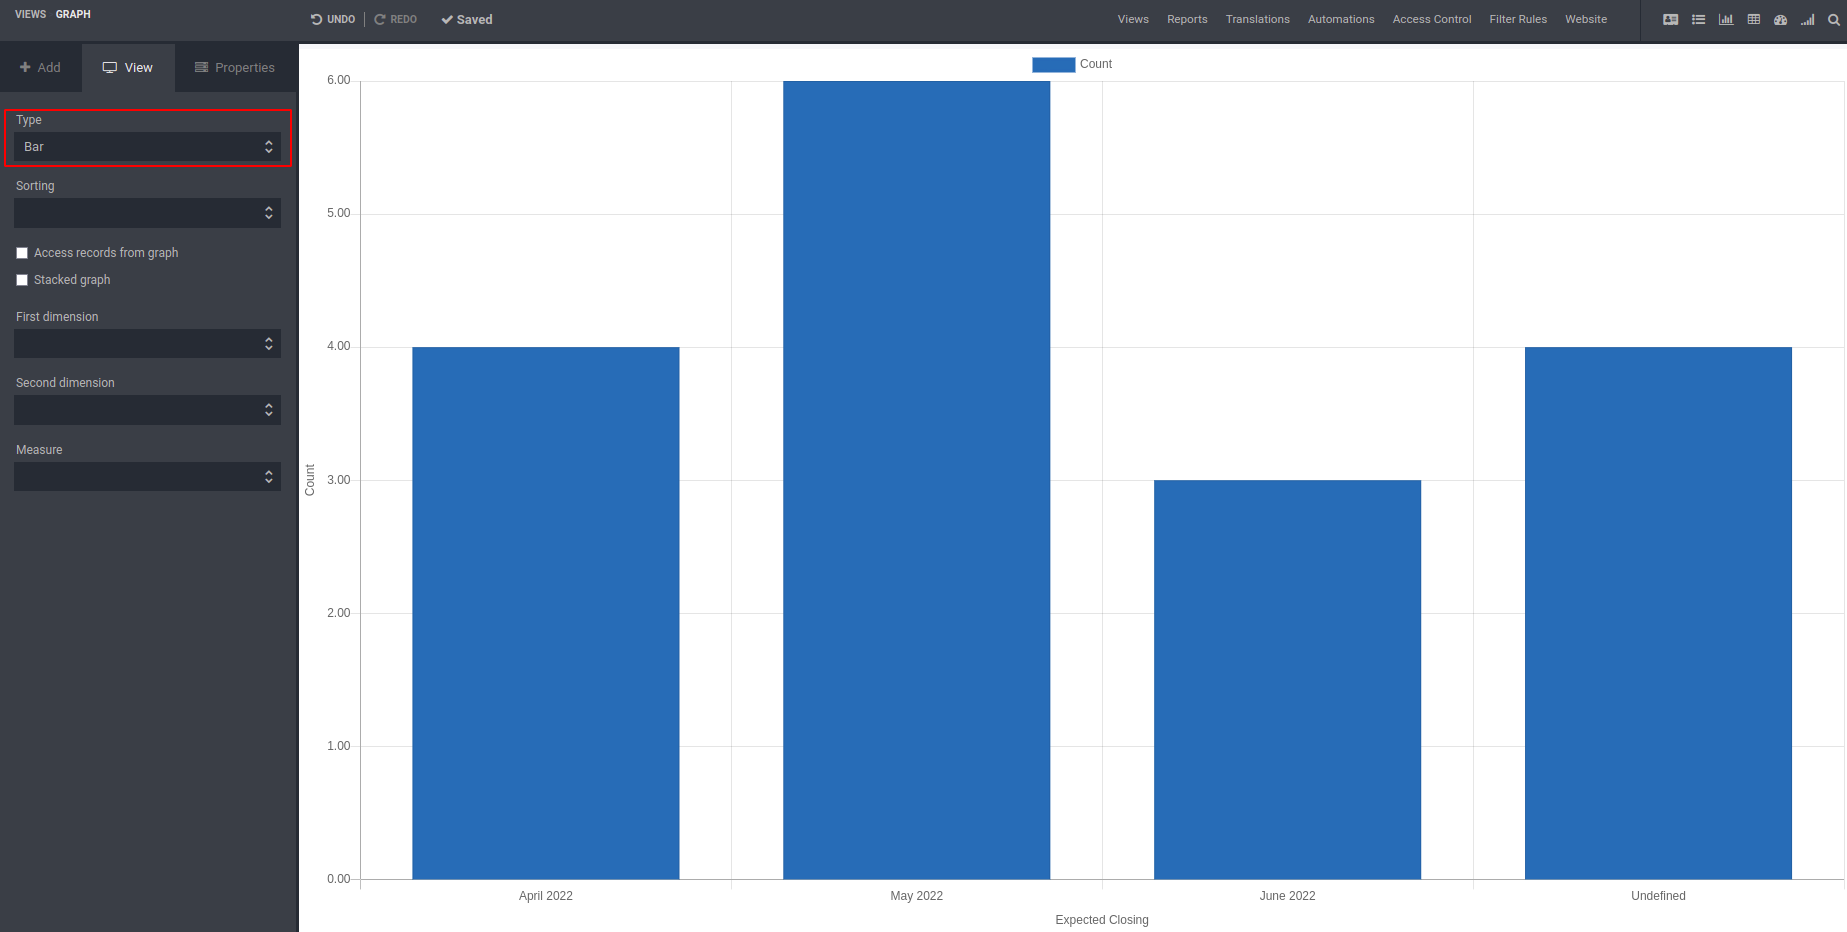
Can sort the bar chart in ascending or descending order as you wish.
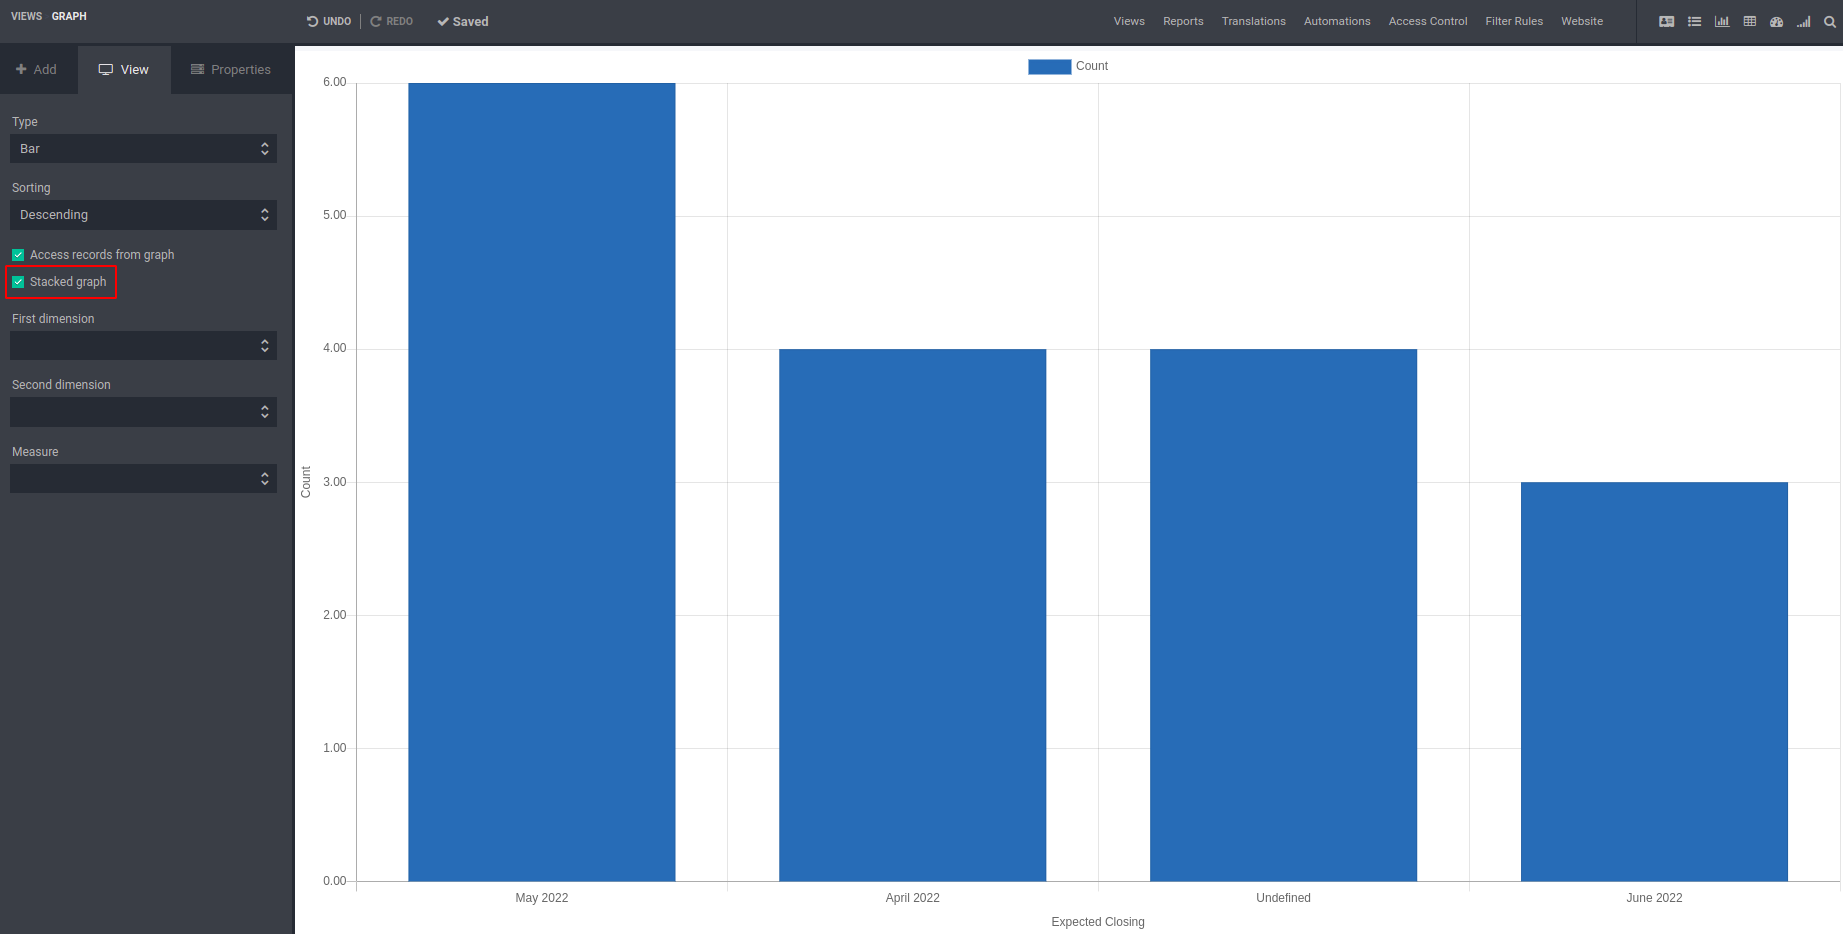
By enabling this you can access the records from the bar chart.
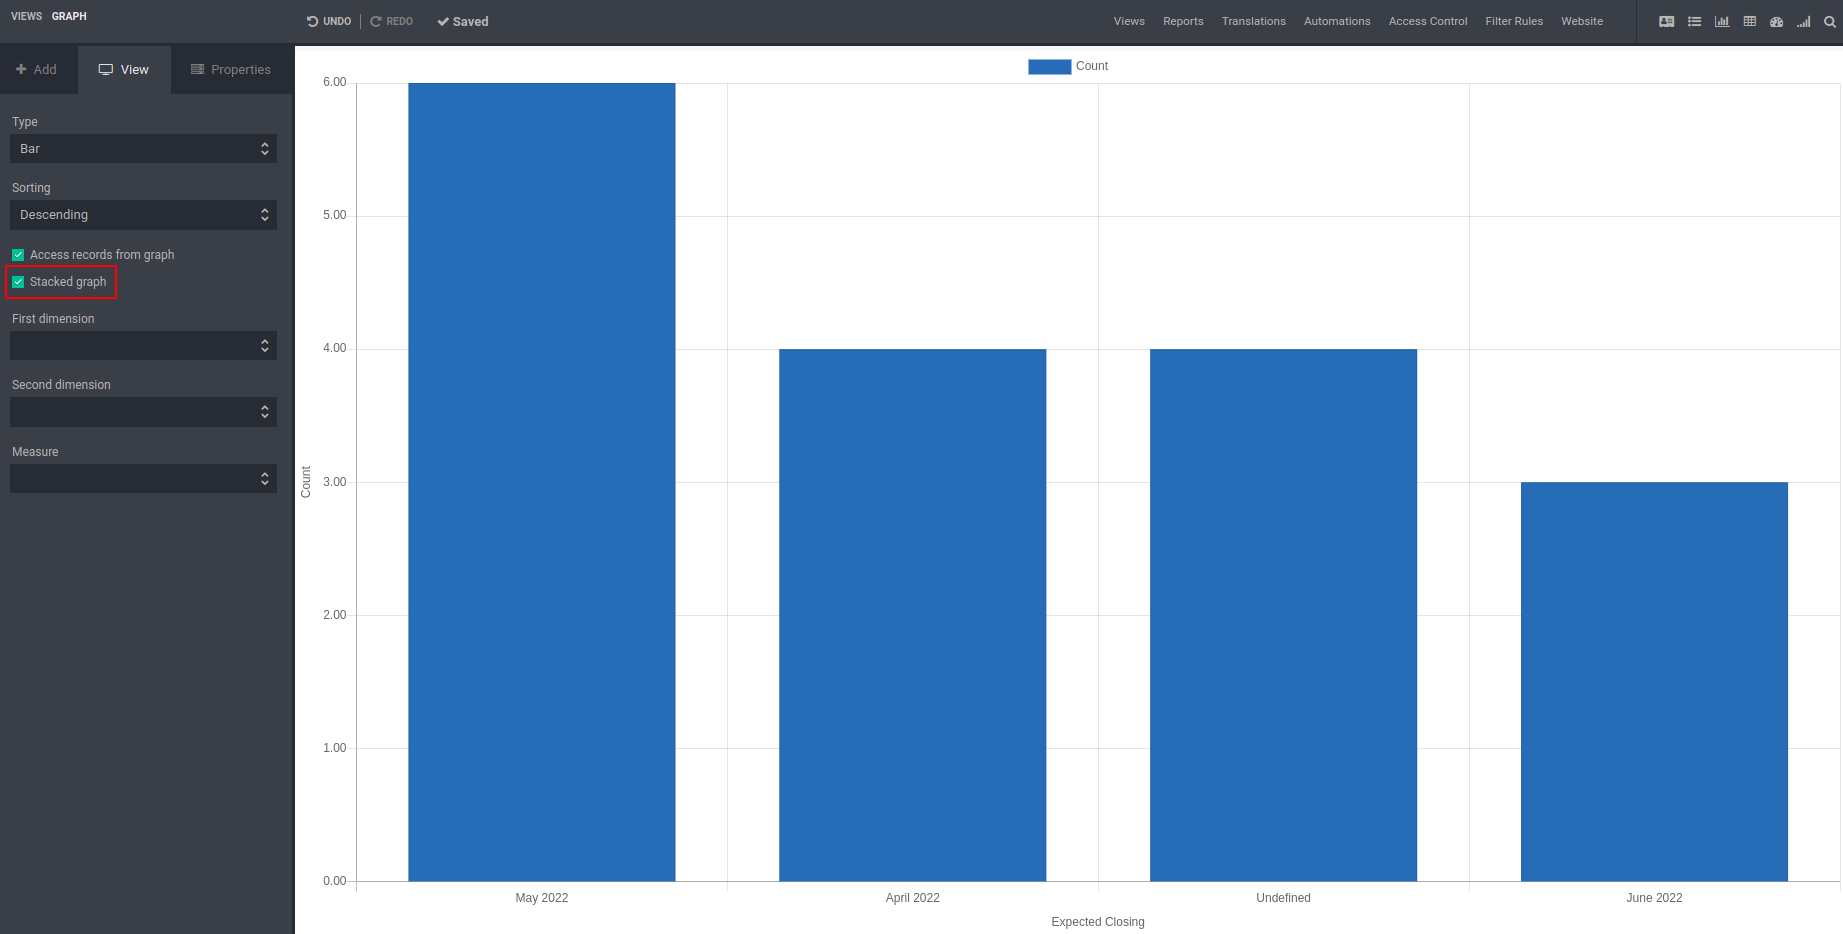
By enabling this you can add multiple data as a stack in a single bar.
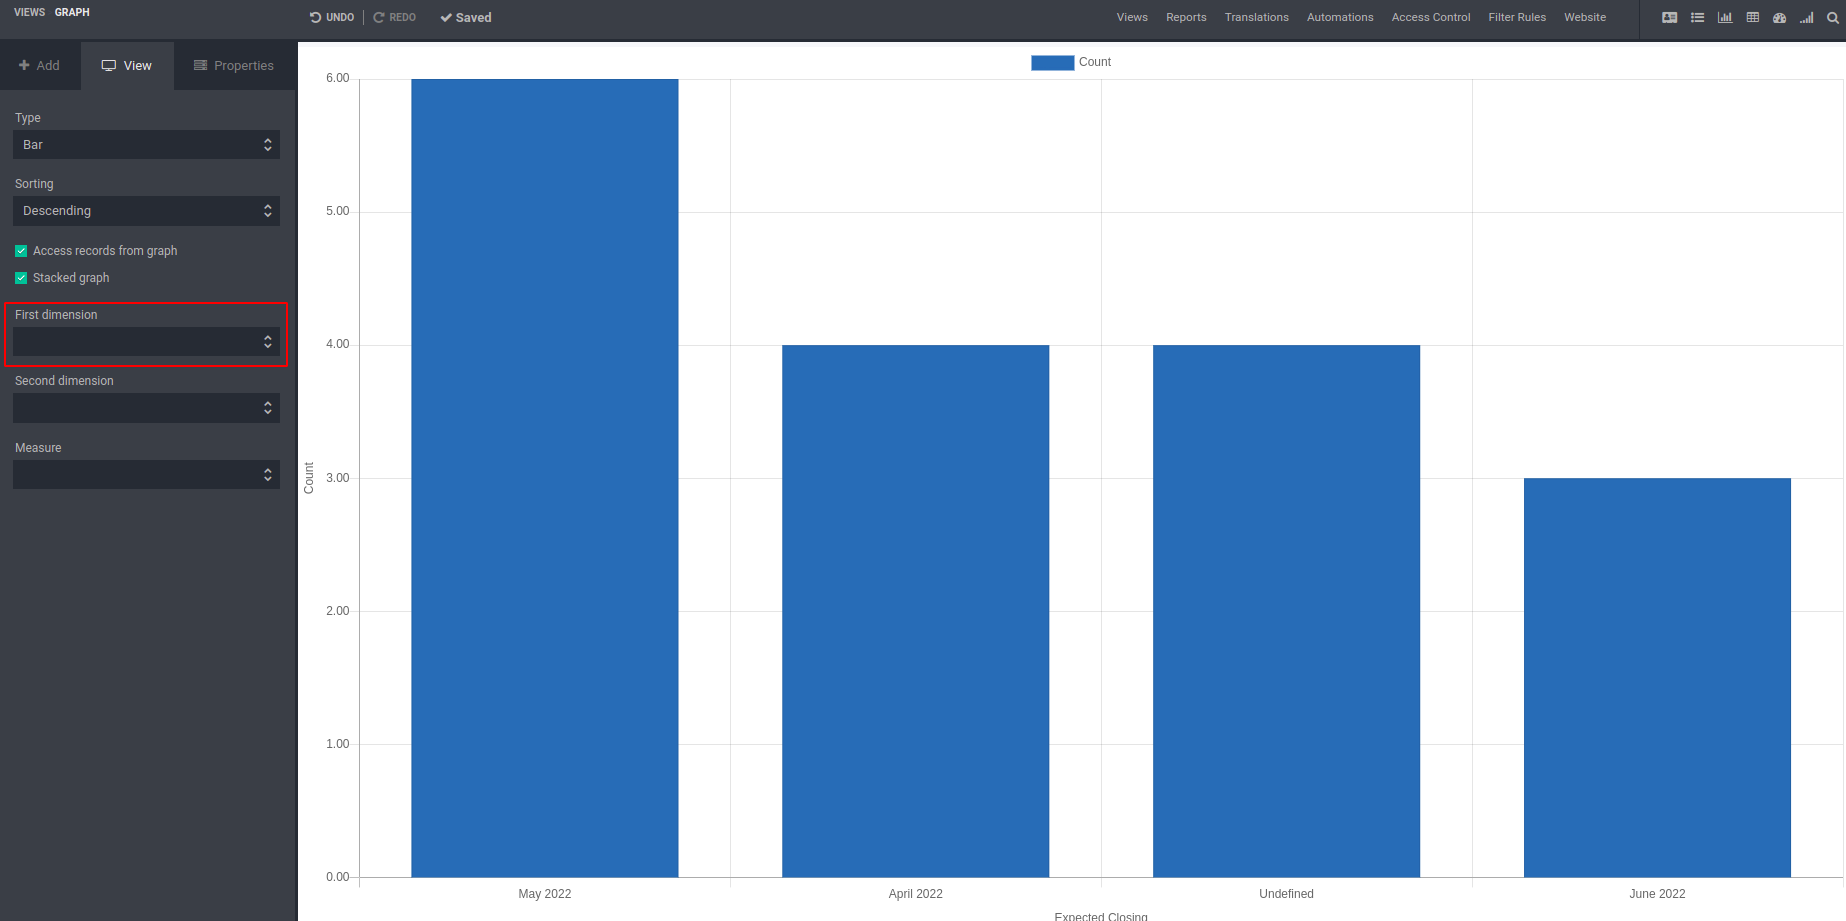
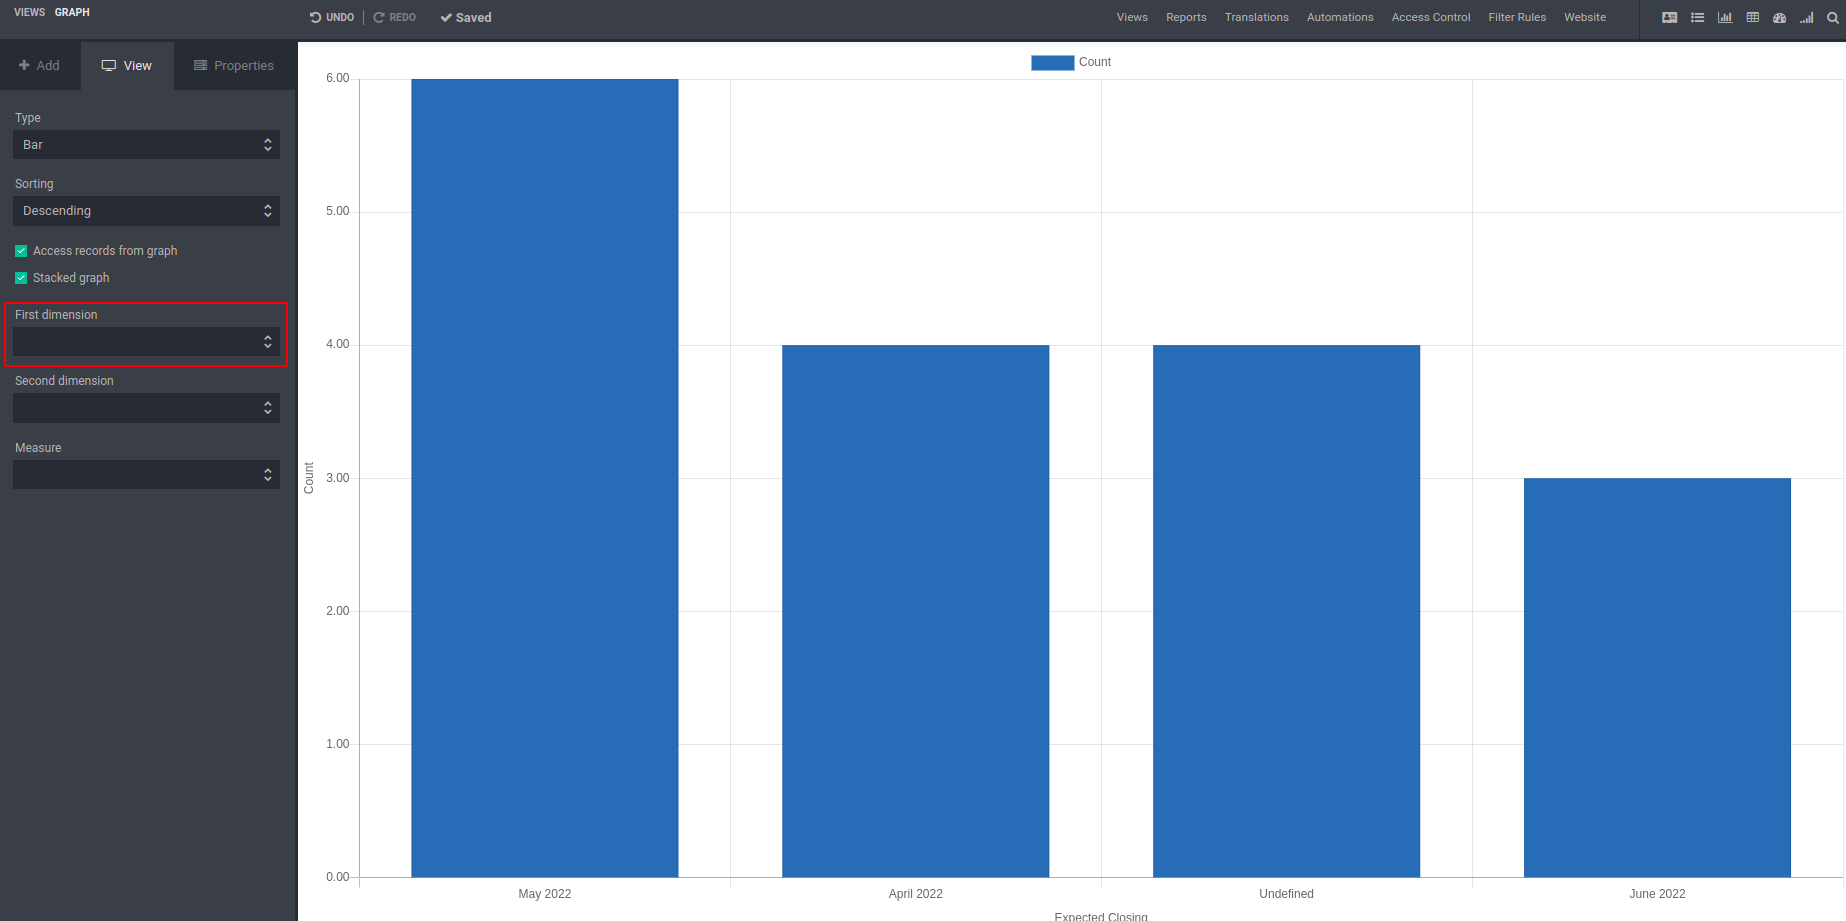
Set first dimension parameters. It varies for the models.
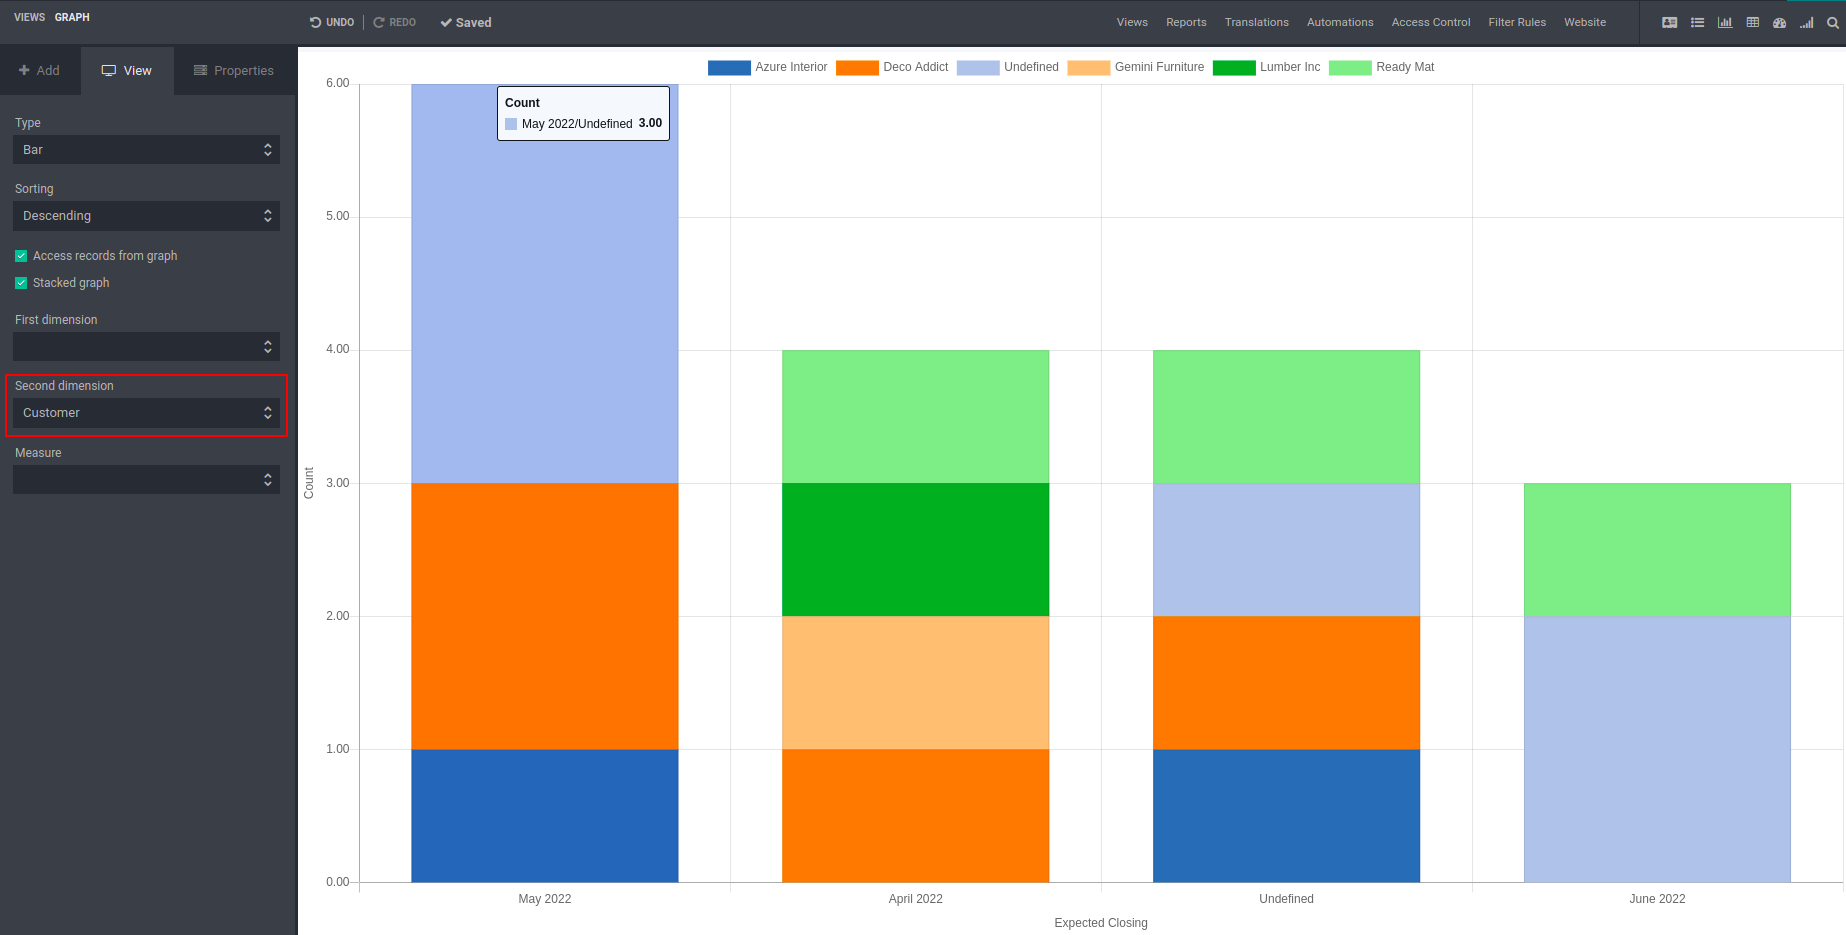
Set second dimension parameters. It varies for the models.
Set measures for this bar chart. The bar chart is displayed based on these measures.
